
Quarterly civil aviation statistics, third quarter 2020

Archived Content
Information identified as archived is provided for reference, research or recordkeeping purposes. It is not subject to the Government of Canada Web Standards and has not been altered or updated since it was archived. Please "contact us" to request a format other than those available.
Released: 2021-02-19

Highlights
The third quarter results continued to reflect the severity and abruptness of the impacts of the COVID-19 pandemic on Canadian airlines. In the third quarter, however—typically the best period for the Canadian airline industry—there were improvements to key operating metrics and financial measures from the low point in the second quarter of 2020.
Operating revenue for the 26 largest Canadian air carriers totalled $1.6 billion in the third quarter, down 79.9% from the third quarter of 2019. This third consecutive year-over-year quarterly decline resulted in a net operating loss of $811.1 million, which was about half the record loss of $1.6 billion in the previous quarter.
Air cargo continued to be a key revenue stream for some airlines in the wake of the COVID-19 pandemic, generating $474.7 million. Passenger revenue, however, which totalled $1.0 billion, reverted to the main source of revenue for the airlines.
Canadian air carriers transported 3.6 million passengers on scheduled and charter services in the third quarter of 2020. While this was two and a half times more passengers than in the second quarter, it was down 85.8% from the third quarter of 2019.
Despite this growth from the second quarter, it was a disastrous summer travel season as international demand (-96.0%) remained weak amid border travel restrictions and quarantine enforcements.
COVID-19 flattens the summer travel season
Although more passengers took to the skies in the third quarter of 2020 compared with the second quarter, Canadian airlines faced a significant decrease in demand (-85.8%) compared with the July to September period in 2019. While domestic travel steadily rebounded from the historic low reached in April 2020, international travel continued to stagnate with border restrictions and travel advisories.
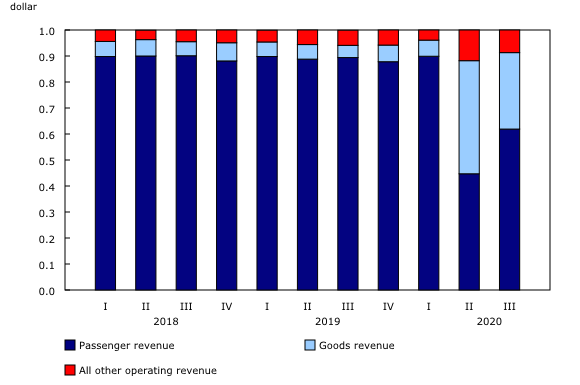
With continued weak passenger demand, air cargo driven by personal protective equipment and retail e-commerce shipments was a bright spot for some airlines in the third quarter. While passenger revenue plummeted 86.1% year over year, goods revenue increased 24.0% to $474.7 million. The former accounted for 61.9 cents of every dollar of total operating revenue, while goods revenue accounted for 29.4 cents. Prior to the crisis, passenger revenue accounted for nearly 90 cents, while goods revenue represented from 5 to 7 cents.
Chart 1

Distribution of every dollar of total operating revenue
Despite some signs of recovery, more red ink spills
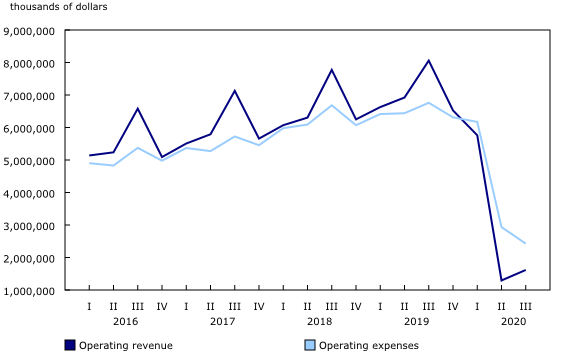
During the third quarter of 2020, operating revenue for the 26 largest Canadian air carriers (Levels I and II) totalled $1.6 billion, down 79.9% from the third quarter of 2019. The decline reflected a 90.1% decrease in traffic (scheduled and charter), which was partly offset by a 40.7% increase in yield (passenger revenue per passenger-kilometre).
The higher yield stemmed mainly from the change in traffic mix and the grounding of aircraft; however, the growth was slightly tempered by falling air fares. According to the Consumer Price Index, prices for air transportation were 9.7% lower in the third quarter of 2020 than in the same quarter in 2019.
On the other side of the ledger, total operating expenses fell 64.1% to $2.4 billion. The airlines' operating cost per available seat-kilometre (ASK, scheduled services only) was two times greater than it was in the third quarter of 2019.
As a result, Canadian air carriers recorded a net operating loss of $811.1 million in the third quarter, compared with a net operating income of $1.3 billion in the third quarter of 2019. This is the third consecutive loss after 8 straight years of net operating income. This amount, combined with a net non-operating income of $178.5 million, produced a net loss of $632.6 million, a significant improvement from the $1.9 billion net loss posted in the second quarter of 2020.
Chart 2
Operating revenue and expenses, Canadian air carriers
With fewer flights and lower energy prices, Canadian air carriers spent $345.9 million on turbo fuel, down 80.8% compared with the same quarter in 2019. The Industrial Product Price Index reported a sharp decline (-27.1%) in jet fuel for the July to September reference months.
Total employment was down 37.7% compared with the third quarter of 2019, and airlines paid $521.8 million in wages, salaries and benefits (-54.5%) to their 40,218 employees. Many airlines used the Canada Emergency Wage Subsidy to finance a portion of the salaries. Other operating expenses (64.3%) accounted for the largest share of total operating expenses in the third quarter of 2020, followed by wages, salaries and benefits (21.5%) and turbo fuel (14.3%).
The operating ratio—operating expenses expressed as a proportion of operating revenue—was 1.50 for these airlines in the third quarter, indicating that expenses of 1 dollar and 50 cents were incurred to generate one dollar of revenue. In the third quarter of 2019, about 84 cents in operating expenses was needed to generate a dollar in revenue.
In the third quarter, operating revenue per employee decreased 67.8% year over year to $40,192, as labour productivity—measured by tonne-kilometres (both cargo and passenger flights) per employee—declined to 30,540 tonne-kilometres, down 73.8% from the third quarter of 2019.
Key operating metrics show modest improvement
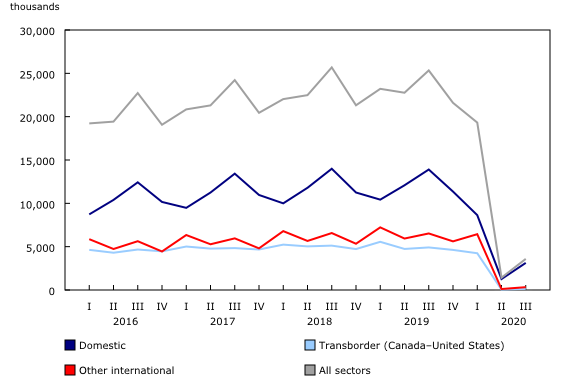
The 26 Canadian air carriers transported 3.6 million passengers in the third quarter, down 85.8% from the third quarter of 2019. The drop was steeper for passengers flying on scheduled flights (down 86.9% to 3.2 million) than for those on chartered flights (down 40.9% to 343,000).
Domestic traffic (within Canada) declined 77.5% to 3.1 million passengers, while international traffic fell 96.0% to 463,000—almost equally between transborder (between Canada and the United States) and other international traffic. As reported by the leading indicator of international arrivals to Canada by air, international arrivals of non-residents as well as returning Canadian residents from abroad were down significantly in the third quarter of 2020.
Chart 3
Passengers carried, by sector, Canadian air carriers
Year over year, scheduled (non-charter) traffic was down 90.5% to 6.3 billion passenger-kilometres, while capacity contracted 82.0% to 13.9 billion available seat-kilometres.
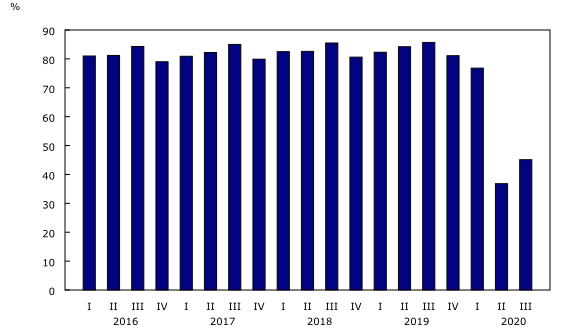
With the decline in demand for air travel larger than the decrease in capacity, carriers recorded a lower passenger load factor in the third quarter (45.1%) than in the same quarter a year earlier (85.7%).
Chart 4
Passenger load factor, Canadian air carriers
Note to readers
This release covers Canadian Level I and II air carriers. The number of air carriers remained 26 in 2020; however, one Level II air carrier was reclassified to Level I.
Level I air carriers include every Canadian air carrier that, in the calendar year before the year in which information is provided, transported at least 2 million revenue passengers or at least 400 000 tonnes of cargo.
Level II air carriers include every Canadian air carrier that, in the calendar year before the year in which information is provided, transported (a) at least 100,000, but fewer than 2 million, revenue passengers, or (b) at least 50 000 tonnes, but less than 400 000 tonnes, of cargo.
Net non-operating income and loss are from commercial ventures that are not part of the air transportation services; from other revenues and expenses attributable to financing or other activities that are not an integral part of air transportation; and from special recurrent items of a non-periodic nature. Provision for income taxes is also included. Non-operating income can be, for example, capital gains from the sale of aircraft, interest income and foreign exchange adjustment, while non-operating expenses can include capital losses and interest on bank loans and other debt.
Data in this release are not seasonally adjusted.
Data from the third quarter of 2019 to the second quarter of 2020 have been revised.
Because of rounding, components may not add up to the total.
Contact information
For more information, or to enquire about the concepts, methods or data quality of this release, contact us (toll-free 1-800-263-1136; 514-283-8300; STATCAN.infostats-infostats.STATCAN@canada.ca) or Media Relations (613-951-4636; STATCAN.mediahotline-ligneinfomedias.STATCAN@canada.ca).
- Date modified: