National balance sheet and financial flow accounts, fourth quarter 2020
Archived Content
Information identified as archived is provided for reference, research or recordkeeping purposes. It is not subject to the Government of Canada Web Standards and has not been altered or updated since it was archived. Please "contact us" to request a format other than those available.
Released: 2021-03-12
National net worth rises as financial and housing markets strengthen
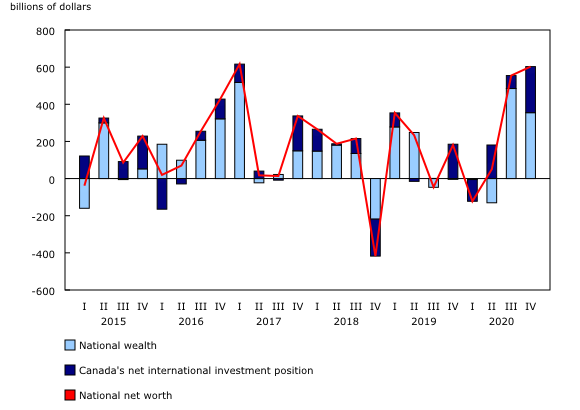
National net worth, the sum of national wealth and Canada's net foreign asset position, increased $602.9 billion from the previous quarter to $13,776.7 billion in the fourth quarter. This resulted from a second consecutive gain in the value of non-financial assets and continued improvement in Canada's net foreign asset position, which represents the difference between the value of Canada's assets and liabilities with the rest of the world. On a per capita basis, national net worth increased from $343,172 to $357,955. By the end of the year, net worth had increased by more than a trillion dollars since the end of 2019. Nearly two-thirds of this rise came from the expansion of Canada's national wealth, and the remainder came from Canada's net foreign asset position, which posted the largest yearly increase since 2015.
The Canadian economy added $354.8 billion to national wealth in the fourth quarter as the value of non-financial assets reached $12,416.1 billion. Residential real estate increased 3.3% in value, the second consecutive quarter of strong growth, as investment in both new and existing residential real estate remained robust. Natural resource wealth increased for the second quarter in a row, rising $119.6 billion. Meanwhile, the stock of machinery and equipment declined for a third consecutive quarter on weak investment that did not keep pace with depreciation.
Despite ongoing current account deficits and the corresponding need for foreign borrowing, Canada's net foreign asset position continued its upward trend in the fourth quarter to reach an unprecedented $1,360.6 billion. For a third consecutive quarter, the increase (+$248.1 billion) was attributable to higher foreign equity prices, as major foreign stock markets outperformed the Canadian stock market in the fourth quarter, and was moderated by the revaluation effect resulting from fluctuations in exchange rates.
Highlights
In the fourth quarter, the Canadian economy continued to recover, albeit at a slower pace, as households and businesses persisted in adjusting to the realities of the COVID-19 pandemic and its associated challenges. Canadians further reduced their reliance on government support measures as employee compensation regained additional lost ground. Government transfers and subsidies continued to wind down, declining for a second consecutive quarter, but nonetheless bolstered household savings and helped keep the savings rate in double-digit territory. The federal government continued to replace short-term borrowing with longer-term securities, issuing a record amount of bonds in the quarter. While government borrowing benefited from the low interest rate environment, so too did households, as they added a record amount to mortgage debt for the second quarter in a row. However, hot real estate markets in many regions helped propel house prices higher, with growth in the value of real estate outpacing mortgage borrowing, pushing the net worth of homeowners higher. By the end of 2020, Canadian stock markets had recouped their losses from the market panic earlier in the year as Canadians looked for places to keep their excess savings. This included accounts with financial institutions as households accumulated currency and deposits at a record pace over the year.
Households continue streak of strong savings
Household sector saving—the funds available to increase wealth—remained elevated for a fourth consecutive quarter as government support, directly through transfers and indirectly through business subsidies, continued to buttress household incomes.
Three consecutive quarters of two-digit savings rates placed households in a net lending position for the third quarter in a row; this means their transactions in financial assets exceeded those in liabilities (i.e., borrowing) as households added financial wealth overall. Households added over $48 billion to their currency and deposits in the fourth quarter, capping off a year that saw this asset expand by $207.4 billion, nearly double the increase of the previous year. Robust savings also meant less reliance by households on credit and more cash available to invest in real estate or financial products.
Household wealth rises despite challenging year
Household sector net worth—the value of all assets less liabilities—increased 3.7% to $12,788.9 billion in the fourth quarter, up 9.3% over the course of 2020. The value of financial assets rose $285.6 billion, partially because of increased holdings of cash and deposits among Canadian households. The larger impact came from growth in the value of pension wealth and equities, including notable increases in the value of mutual fund holdings. Equity markets finished the year on a strong note despite a rocky start in the first part of 2020. The Toronto Stock Exchange (TSX) was up 8.1% in the quarter, while international markets also posted sizable gains, including the Standard and Poor's 500 (+11.7%). While households do not hold large amounts of foreign equity directly, they possess significant holdings indirectly through mutual and pension funds. By the end of the year, the TSX had surpassed its pre-pandemic valuation by 2.2%, as households erased their losses in listed shares from the first quarter.
Counteracting the gains in financial assets, liabilities grew 1.5%, primarily owing to a second consecutive quarter of record mortgage borrowing. Year over year, financial assets increased 6.8%, while financial liabilities grew 4.2%.
Residential real estate a key contributor to wealth gains
The value of non-financial assets grew $211.7 billion in the quarter, mostly because of a 3.4% increase in residential real estate, whose value surpassed $6 trillion for the first time on record. Residential resale activity remained strong, increasing 5.2% on a seasonally adjusted basis, following a large rebound in the third quarter, as sales recovered from the effect of lockdowns at the beginning of the year. Despite the significant impact of pandemic-related restrictions, over 61,000 more units were sold in 2020 than in 2019, while the value of residential real estate rose 11.6% year over year, the fastest pace since 2006.
According to Statistics Canada's Residential Property Price Index, resale prices increased 9.4% over the course of the year, while new build prices rose 6.4%; the average selling price of existing homes surpassed $600,000 by the end of the year. Seasonally adjusted housing investment, which includes new purchases, reached its highest point on record, eclipsing the record set in the previous quarter by a healthy margin. The increase was widespread, with growth in renovations (+6.5%), new construction (+6.3%) and ownership transfer costs (+5.7%), the fees associated with home purchases.
Gains in household wealth distributed unequally
Extrapolating from the recently released experimental sub-annual distributions of household economic accounts (DHEA), it is evident that households did not benefit equally from the gains in housing and financial markets over the year. Those with a major income earner younger than 35 held the least wealth of any age group, with roughly $231,000 in net worth at the end of 2020, compared with more than $1.1 million for those with a major income earner aged 55 or older. Over the year, older households added over $91,000 in wealth, on average, compared with less than $27,000 for younger households. However, given the lower levels of wealth at the beginning of the year among younger households, they recorded a greater relative increase in their wealth (+13.1%) compared with older households (+8.9%).
Owning a home key to capturing gains in net worth
In 2020, households who owned their homes added over $1 trillion to their net worth, while renters saw their net worth expand by less than $90 billion. Over the course of the year, homeowners benefited from buoyant real estate prices, which helped push their non-financial asset holdings, primarily concentrated in real estate, higher by an average of roughly $66,000 per household, while renters added less than $5,000 per household.
Mortgage borrowing ends year strong
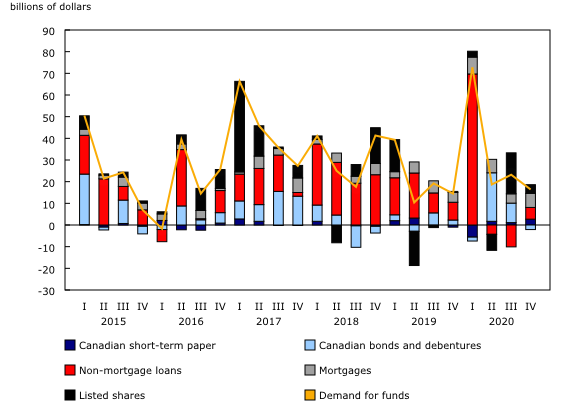
On a seasonally adjusted basis, total credit market borrowing reached $36.1 billion in the fourth quarter, down slightly from the record level of the previous quarter. Demand for mortgage loans reached $34.9 billion, surpassing the previous quarter's record. However, amid a softening in household spending, non-mortgage loans, including consumer credit, rose $1.2 billion, following a sharp decline in the second quarter (-$19.0 billion) and partial rebound in the third quarter (+$8.8 billion). Notably, non-mortgage borrowing bucked the seasonal trend of increasing balances at the end of the year, as demand for mortgages accounted for almost 97% of all borrowing in the fourth quarter.
The stock of credit market debt (consumer credit, and mortgage and non-mortgage loans) totalled $2,445.5 billion at the end of the quarter. Mortgage debt was $1,658.0 billion, while non-mortgage loans stood at $787.5 billion. Households reduced their credit card balances with chartered banks by 3.2% in the fourth quarter, mostly in December, and, overall, ended the year with 1.6% less non-mortgage debt from all lenders compared with 2019. Mortgage borrowing was up 7.1% from the previous year, but, altogether, total credit market debt rose 4.1% over the year, a fourth-quarter pace that was surpassed as recently as 2017.
Debt burden varies by age and income quintile
Some households were more frugal than others when it came to their debt. Extrapolating from the latest DHEA release, households across all income quintiles reduced their non-mortgage debt in 2020, with higher-income households tending to reduce their debt loads by a greater amount in absolute terms. Households with a major income earner younger than 35 accounted for the greatest share, nearly 28%, of the roughly $110 billion in mortgage debt added in 2020.
Debt servicing and debt-to-income ratios remain below pre-pandemic levels
The household debt service ratio, measured as total obligated payments of principal and interest on credit market debt as a proportion of household disposable income, increased to 13.58% from 13.18%, although the ratio was 9.8% lower than its peak in the third quarter of 2019. By the end of 2020, the vast majority of debt deferrals had concluded. Despite the robust pace of mortgage borrowing, overall debt interest payments declined, while obligated payments of principal grew.
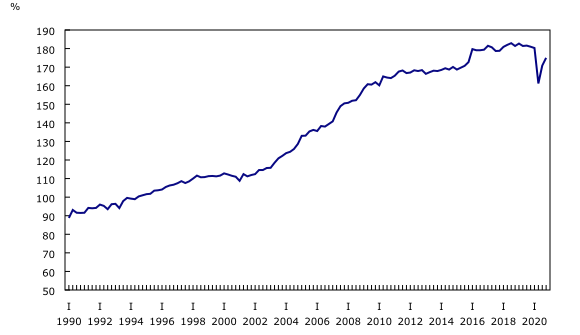
Household credit market debt as a proportion of household disposable income rose from 170.8% to 175.0%, as growth in the stock of credit market debt (+1.4%) contrasted with a 1.0% decline in household disposable income. In other words, there was $1.75 in credit market debt for every dollar of household disposable income, compared with $1.81 at the end of 2019.
Federal government continues to exchange short-term for long-term debt
The federal government demand for credit market debt was $36.0 billion in the fourth quarter. Unlike the third quarter, in which net issuances of bonds were almost entirely offset by net retirements of treasury bills, the increase in fourth-quarter borrowing was led by a record $93.9 billion in net issuances of federal bonds that were partially offset by net retirements of short-term paper ($57.5 billion). This shift from short-term to longer-term borrowing continued for the second consecutive quarter.
Other levels of government (excluding social security funds) borrowed $11.1 billion in the fourth quarter, less than half the amount of the prior quarter, of which provincial bond issuances made up the largest share. Other levels of government also reduced their liability position in short-term paper through net retirements of $3.9 billion.
The federal government's demand for credit market debt in 2020 totalled $370.0 billion, while other levels of government (excluding social security funds) acquired $110.3 billion in funds from credit markets.
Ratios of debt to gross domestic product expand, but more slowly in the fourth quarter
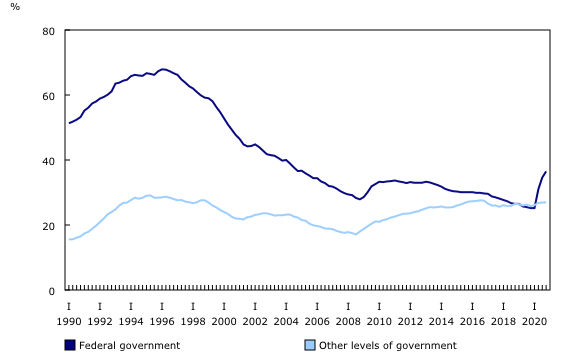
The ratio of federal government net debt (the book value of total financial liabilities less total financial assets) to gross domestic product (GDP) increased to 36.5% in the quarter, significantly higher than the 25.2% recorded at the end of the previous year, but marking a notable deceleration from the growth seen in the second and third quarters of 2020. Meanwhile, the ratio of other government net debt to GDP displayed similar trends, rising to 27.1% in the quarter, compared with 25.8% at the end of 2019. The increase in these ratios reflected both the economic downturn resulting from the pandemic and the increased borrowing to combat the downturn.
Non-financial private corporations demand fewer funds
The demand for funds by non-financial private corporations was a relatively modest $16.4 billion in the fourth quarter, down from $23.2 billion in the previous quarter; the funds were raised primarily through loans.
The federal government continued to provide non-mortgage loans to non-financial private corporations in the fourth quarter (+$7.6 billion) through government programs, such as the Canada Emergency Business Account, which was expanded in December. Throughout the entire year, the federal government extended $41.4 billion of this type of funding. On the other hand, non-mortgage loans from chartered banks continued to decline in the fourth quarter, but on a smaller scale. According to recently released Canadian Survey on Business Conditions results, covering the first quarter of 2021, nearly one-quarter of businesses expected maintaining sufficient cash flow or managing debt to be obstacles over the subsequent three months.
Financial sector supply of funds rises
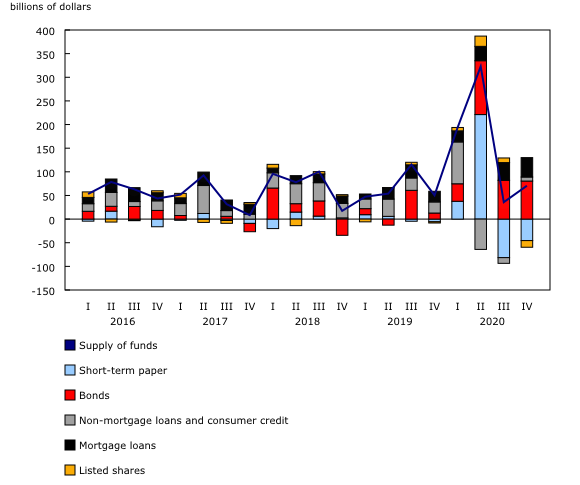
Financial corporations provided $70.5 billion in funds to the economy through financial market instruments, up from $35.8 billion in the previous quarter. Financing in the fourth quarter mainly took the form of $80.5 billion in bond purchases, moderated by a net reduction of short-term paper of roughly half the size. Mortgage lending was also a sizable component, surpassing the $40 billion mark for the first time, and standing in contrast to the more limited non-mortgage loan activity that was principally related to chartered bank lending to non-residents.
The Bank of Canada, a subsector of the financial sector, expanded the size of its balance sheet more than fourfold from $123.2 billion at the end of 2019 to $554.4 billion at the end of 2020.
The market value of financial assets was up 4.1% to $18,142.5 billion for financial corporations. This was principally attributable to an increase in the value of equity and investment fund shares of over $600 billion as gains in equity markets led to positive revaluations in domestic and foreign equity and investment fund shares. The story was similar for mutual funds, up 5.8% to $2,718.0 billion, and for trusteed pension funds, with much of the increase in the fourth quarter as a result of the upward valuation of foreign equity holdings. For both of these sectors driven by institutional investors, revaluations benefit the household sector's net worth, as households are the majority holder of mutual fund shares and pension wealth.
Note to readers
Revisions
This fourth-quarter release of the national balance sheet and financial flow accounts includes revised estimates from the first quarter to the third quarter of 2020. These data incorporate new and revised data, as well as updated data on seasonal trends. An overview of these conceptual, methodological and statistical revisions is available in "An overview of revisions to the Financial and Wealth Accounts, 1990 to 2020."
In the near future, data enhancements to the national balance sheet and financial flow accounts, such as the development of detailed counterparty information by sector, will be incorporated. To facilitate this initiative and others, it is necessary to extend the annual revision period (normally the previous three years) at the time of the third-quarter release. Consequently, for the next two years, with the third-quarter release of the financial and wealth accounts, data will be revised back to 1990 to ensure a continuous time series.
Distributional analysis
The distributional analysis presented in this release is based on extrapolations from the experimental sub-annual distributions of household economic accounts (DHEA) released on March 1, as well as data on trends in household liabilities. Fourth-quarter estimates of the DHEA will be released in the spring of 2021.
Financial and wealth accounts on a from-whom-to-whom basis: Selected financial instruments
The data visualization product "Financial accounts on a from-whom-to-whom basis, selected financial instruments" has been updated with data from the first quarter to the fourth quarter of 2020. Additionally, mortgage loans have been added with this release.
Next release
Data on the national balance sheet and financial flow accounts for the first quarter of 2021 will be released on June 11, 2021.
Overview of the Financial and Wealth Accounts
This release of the Financial and Wealth Accounts comprises the National Balance Sheet Accounts (NBSA), the Financial Flow Accounts (FFA), and the other changes in assets account.
The NBSA are composed of the balance sheets of all sectors and subsectors of the economy. The main sectors are households, non-profit institutions serving households, financial corporations, non-financial corporations, government and non-residents. The NBSA cover all national non-financial assets and all financial asset-liability claims outstanding in all sectors. To improve the interpretability of financial flows data, selected household borrowing series are available on a seasonally adjusted basis (table 38-10-0238-01). All other data are unadjusted for seasonal variation. For information on seasonal adjustment, see Seasonally adjusted data – Frequently asked questions.
The FFA articulate net lending or borrowing activity by sector by measuring financial transactions in the economy. The FFA arrive at a measure of net financial investment, which is the difference between transactions in financial assets and liabilities (for example, net purchases of securities less net issuances of securities). The FFA also provide the link between financial and non-financial activity in the economy, which ties estimates of saving and non-financial capital acquisition (for example, investment in new housing) to the underlying financial transactions.
While the FFA record changes in financial assets and liabilities between opening and closing balance sheets that are associated with transactions during the accounting period, the value of assets and liabilities held by an institution can also change for other reasons. These other types of changes, referred to as other economic flows, are recorded in the other changes in assets account.
There are two main components to this account. One is the other changes in the volume of assets account. This account includes changes in non-financial and financial assets and liabilities relating to the economic appearance and disappearance of assets, the effects of external events such as wars or catastrophes on the value of assets, and changes in the classification and structure of assets. The other main component is the revaluation account, showing holding gains or losses accruing to the owners of non-financial and financial assets and liabilities during the accounting period as a result of changes in market price valuations.
At present, only the aggregate other change in assets is available within the Canadian System of Macroeconomic Accounts; no details are available on the different components.
Definitions concerning financial indicators can be found in Financial indicators from the National Balance Sheet Accounts and in the Canadian System of Macroeconomic Accounts glossary.
Distributions of household economic accounts
The NBSA for the household sector is allocated across a number of socioeconomic dimensions as part of the DHEA. Data on wealth and its components by income quintile, age, generation and region are available in tables 36-10-0585-01, 36-10-0586-01, 36-10-0589-01, and 36-10-0590-01.
The methodology for DHEA wealth estimates can be found in the article "Distributions of Household Economic Accounts, estimates of asset, liability and net worth distributions, 2010 to 2019: Technical methodology and quality report."
Products
The document "An overview of revisions to the Financial and Wealth Accounts, 1990 to 2020," which is part of Latest Developments in the Canadian Economic Accounts (13-605-X), is now available.
The data visualization product "Financial accounts on a from-whom-to-whom basis, selected financial instruments," which is part of Statistics Canada – Data Visualization Products (71-607-X2018015), is now available.
The data visualization product "Infrastructure Statistics Hub," which is part of Statistics Canada – Data Visualization Products (71-607-X), is now available.
The data visualization product "Distributions of Household Economic Accounts, Wealth: Interactive tool," which is part of Statistics Canada – Data Visualization Products (71-607-X2020006), is now available.
The data visualization product "Securities statistics," part of the series Statistics Canada – Data Visualization Products (71-607-X2019004), is available online.
The Economic accounts statistics portal, accessible from the Subjects module of our website, features an up-to-date portrait of national and provincial economies and their structure.
The User Guide: Canadian System of Macroeconomic Accounts (13-606-G) is available.
The Methodological Guide: Canadian System of Macroeconomic Accounts (13-607-X) is available.
Contact information
For more information, or to enquire about the concepts, methods or data quality of this release, contact us (toll-free 1-800-263-1136; 514-283-8300; STATCAN.infostats-infostats.STATCAN@canada.ca) or Media Relations (613-951-4636; STATCAN.mediahotline-ligneinfomedias.STATCAN@canada.ca).
- Date modified:


