Consumer Price Index: Annual review, 2020
Archived Content
Information identified as archived is provided for reference, research or recordkeeping purposes. It is not subject to the Government of Canada Web Standards and has not been altered or updated since it was archived. Please "contact us" to request a format other than those available.
Released: 2021-01-20
137.0
2020
0.7% 
(annual change)
The COVID-19 pandemic has had an impact on the Consumer Price Index (CPI), both in terms of the shifts in consumer spending patterns and in terms of the special imputation treatments introduced to address missing or unavailable products and prices in 2020. Please refer to the note to readers for more information.
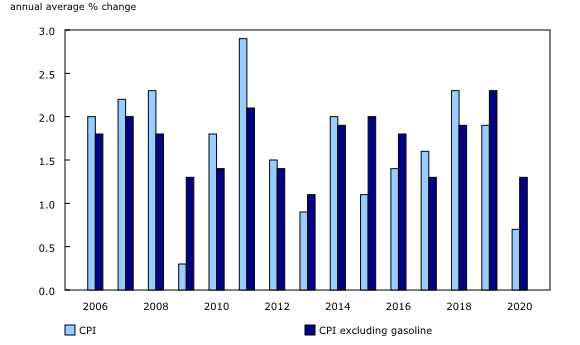
The CPI rose 0.7% in 2020 on an average annual basis, following an increase of 1.9% in 2019. In 2020, the CPI rose at the slowest pace since 2009, during the economic downturn. Slowing inflation was mostly attributable to a decline in consumer spending related to protective measures to restrict movement and encourage physical distancing during the pandemic. Excluding gasoline, the annual average CPI rose 1.3% in 2020.
Check out the 2020 annual review infographic
Today, Statistics Canada released the infographic Consumer Price Index: 2020 in Review, highlighting the annual average consumer price inflation in Canada and the regions in 2020 and showing the noteworthy average commodity price movements of the year in the context of the COVID-19 pandemic.
The pandemic slowed price growth in consumer goods and services in 2020 from a year earlier, partially reflecting how Canadians adapted to staying home, travelling less, and buying more of certain items and fewer of others.
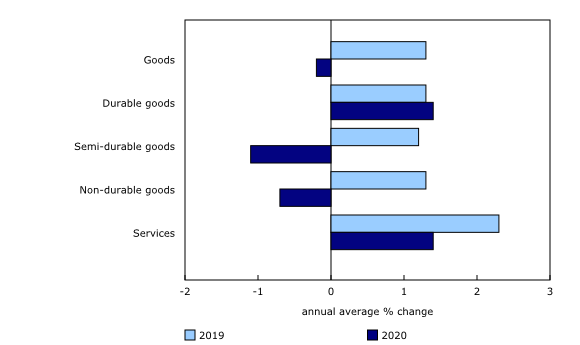
Despite food prices increasing, prices for non-durable goods declined because of falling gasoline prices, which were the largest contributor to the slowdown in CPI growth in 2020. Prices for semi-durable goods also decreased, mostly as a result of falling prices for clothing and footwear.
Conversely, the annual average price increase for durable goods (+1.4%) was similar to the gain in 2019 (+1.3%), and this contrasts with the last major economic downturn, with prices for durable goods falling 3.1% in 2009. The difference between durable goods prices in 2020 and 2009 was largely attributable to passenger vehicles. In 2020, a sharp drop in vehicle sales at the onset of the pandemic coincided with weaker price growth, but this had a muted impact on the annual average price movement as sales bounced back to pre-pandemic levels by August. In 2009, although the decline in passenger vehicle sales was more gradual and less pronounced than during the pandemic, sales remained low for longer. This weighed down on annual average prices for durable goods.
Prices for services rose in 2020 (+1.4%), albeit at a slower pace than in 2019 (+2.3%). Service prices in 2020 were weighed down by prices for traveller accommodation, as demand for travel was heavily impacted by conditions related to COVID-19 and Canadians opted to stay closer to home. At the same time, consumers paid more for passenger vehicle insurance premiums (+6.0%) and rent (+1.7%) in 2020.
Some service providers that incurred costs related to adopting personal protective equipment and implementing safety measures in response to COVID-19 passed a portion of these costs onto consumers. This contributed to higher prices for food purchased from restaurants (+2.2%) and personal care services (+4.2%).
Food prices (+2.3%) rose the most of the major components, albeit at a slower pace in 2020 after accelerating in 2018 and 2019. Fresh vegetable prices rose at a slower pace in 2020 (+3.0%) than in 2019 (+12.7%), when prices rose as a result of severe weather patterns causing supply issues in growing regions. Conversely, meat prices rose at a faster pace in 2020 (+4.5%) than in 2019 (+3.8%). Temporary closures and reduced operating capacities at several large beef processing plants contributed to notable growth in beef prices in early to mid-2020, but prices subsequently fell as production returned to pre-pandemic levels.
Passenger vehicle prices and insurance premiums were the largest contributors to the increase in the annual average CPI, although both rose at a slower pace than in 2019. As Canadians paid 2.4% more for passenger vehicles, they also paid more to insure them. Passenger vehicle insurance premiums rose 6.0% in 2020, despite many carriers providing rebates early in the pandemic.
Prices fell the most in the clothing and footwear component (-1.8%), mainly because of factors related to COVID-19. Clothing and footwear prices posted their largest annual average decline since 2010, when prices fell because of strong global competition. Many retailers offered large discounts to online prices in 2020 amid higher inventories, as in-person shopping for non-essential goods was suspended in most provinces throughout April and May. In the months after retail locations reopened, clothing sales remained lower than during the same period in 2019, reflecting the circumstances that kept Canadians at home for most of the year.
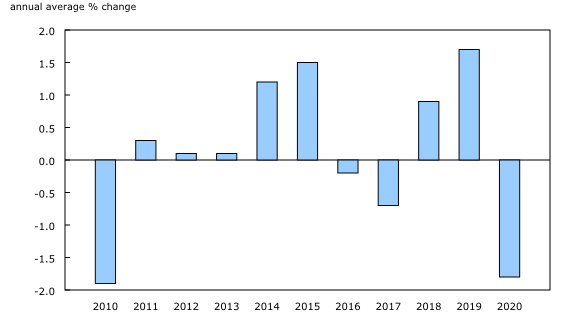
Gasoline prices were down 14.0% on an annual average basis in 2020, the largest drop since 2015, when a global oil supply glut drove prices lower at the gas pumps. Reduced economic activity, including limited travel and temporary business closures to comply with public health measures, led to lower demand for oil in 2020 compared with 2019, causing oil-producing states to reduce production in an effort to maintain price levels.
Prices for traveller accommodation (-17.6%) fell at their fastest pace on record. Prices were down throughout most of 2020 amid reduced tourist activity, stemming from land border closures and stay-at-home measures that encouraged only essential travel.
Lower demand for air travel throughout most of 2020 drove down the annual average price movement for air transportation (-0.8%). Although many flights remained cancelled or suspended as a result of the pandemic, airlines offered various incentives such as reduced fees, discounts and promotions to encourage a return to travel. In addition, jet fuel prices, which account for a significant portion of airline expenses, fell sharply at the onset of the pandemic in March.
Annual average prices for household equipment rose 1.8% in 2020, following a 0.3% decline in 2019. Strong demand for small kitchen appliances and fewer specials in 2020 compared with previous years supported the price increases. This coincided with Canadians cooking more at home as opposed to eating in restaurants. Consumers also paid 1.9% more for sporting and exercise equipment in 2020, following a 0.5% increase in 2019. As restrictions were placed on indoor gatherings, many Canadians likely turned more to outdoor sporting and at-home exercise activities. This coincided with higher retail sales.
Recreational cannabis prices fell 10.9% on an annual average basis as cannabis companies lowered prices in an effort to compete with the illicit market. Licensed sales outpaced illicit sales for the first time in the third quarter of 2020. Prices faced additional downward pressure in 2020 because of significant competition among an abundance of cannabis companies competing for market share, leading to higher inventories.
Regional highlights
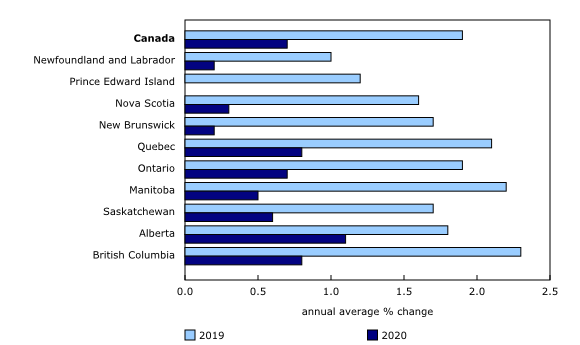
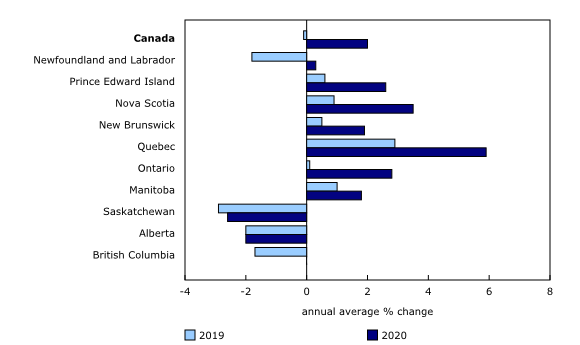
Average annual prices rose at a slower pace in every province in 2020 compared with a year earlier. Prices rose slowest in Atlantic Canada, where furnace fuel oil is more commonly used. Prices for fuel oil and other fuels, which are subject to similar oil price dynamics as gasoline, fell 17.3%.
The homeowners' replacement cost index, which is related to the price of new homes, rose 2.0% on an annual average basis in 2020, compared with a 0.1% decline in 2019, with prices rising the most in Quebec (+5.9%). Historically low interest rates, coupled with higher building material costs and low inventory of homes, contributed to rising prices for new housing throughout 2020. Costs fell the most in Saskatchewan (-2.6%) and in Alberta (-2.0%), and this is partly attributable to the economic activity slowdown in the oil and gas sector in these provinces.
Tuition fees fell 1.8% at the national level in 2020. This was the first decline on record, attributable to the planned reduction in tuition fees by the Ontario provincial government for the 2019/2020 academic year.
The city bus and subway transportation index, which is priced biannually in the CPI, rose 5.1% on an annual average basis in 2020, the largest increase since 2010. Despite a record drop in public transit use during the pandemic, public transit rates increased as planned rate changes took effect. For this reason, as well as cuts to municipal budgets, city bus and subway transportation prices rose sharply in early 2020, with Ontario prices contributing the most to the increase.
Additional research related to COVID-19
For more information about the impact of COVID-19 on consumer spending, please consult our additional publications, which are available in the Prices Analytical Series (62F0014M):
Canadian Consumers Prepare for COVID-19(released April 8, 2020)
Canadian Consumers Adapt to COVID-19: A Look at Canadian Grocery Sales up to April 11(released May 11, 2020)
Adjusting the Consumer Price Index to the new spending realities during the pandemic (released October 8, 2020). Note that table 18-10-0263-01 (monthly adjusted price index, provisional) and table 18-10-0264-01 (monthly adjusted consumer expenditure basket weights) were updated on January 12, 2021.
A document outlining the short-term plans and priorities for the Canadian Consumer Price Index (CPI) will be released this winter and will provide information about the next CPI basket update in July 2021.
Note to readers
This release examines the percentage change between the annual average Consumer Price Index (CPI) in 2019 and 2020.
Annual average indexes are obtained by calculating the average of the 12 monthly index values over the calendar year. Annual average percent change should not be confused with the 12-month percent change that is published every month with the release of the CPI. Unlike annual average change, 12-month change compares the monthly index level with the level from the same month a year earlier.
COVID-19 and the Consumer Price Index
Statistics Canada continues to monitor the impacts of the novel coronavirus (also known as COVID-19) on Canada's CPI.
Goods and services in the CPI that were not available to consumers throughout most of 2020 because of COVID-19 restrictions received special treatments, effectively removing their impact on the calculation of the monthly and annual average CPI.
Since the onset of the pandemic, Technical Supplement documents have been released with the CPI on a monthly basis and are available in the Prices Analytical Series, with further details on the imputations used to compile the monthly CPI in 2020.
Explore the Consumer Price Index
Check out the new Personal Inflation Calculator! This interactive calculator allows you to enter dollar amounts in the common expense categories to produce a personalized inflation rate, which you can compare with the official measure of inflation that represents the average Canadian household—the CPI.
Visit the Consumer Price Index Portal to find all CPI data, publications, interactive tools, and announcements highlighting new products and upcoming changes to the CPI in one convenient location.
Check out the Consumer Price Index Data Visualization Tool to access current and historical CPI data in a customizable visual format.
Products
The Consumer Price Index Data Visualization Tool is available on the Statistics Canada website.
More information about the concepts and use of the Consumer Price Index are available in The Canadian Consumer Price Index Reference Paper (62-553-X).
Contact information
For more information, or to enquire about the concepts, methods or data quality of this release, contact us (toll-free 1-800-263-1136; 514-283-8300; STATCAN.infostats-infostats.STATCAN@canada.ca) or Media Relations (613-951-4636; STATCAN.mediahotline-ligneinfomedias.STATCAN@canada.ca).
- Date modified:


