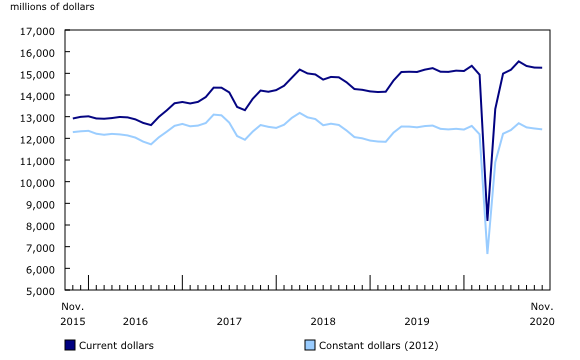
Investment in building construction, November 2020
Archived Content
Information identified as archived is provided for reference, research or recordkeeping purposes. It is not subject to the Government of Canada Web Standards and has not been altered or updated since it was archived. Please "contact us" to request a format other than those available.
Released: 2021-01-12
$15.3 billion
November 2020
-0.1% 
(monthly change)
Total investment in building construction declined for a third consecutive month, edging down 0.1% to $15.3 billion in November. Slight decreases in both residential and non-residential construction led to minimal change overall. Gains in Ontario and Nova Scotia were offset in large part by declines in six provinces.
On a constant dollar basis (2012=100), investment in building construction decreased 0.3% to $12.4 billion in November.
For more information on housing, please visit the Housing Statistics Portal.
Non-residential investment unchanged
Non-residential investment was mostly unchanged in November, remaining at $4.4 billion. Slight declines in six provinces were offset by small gains in Ontario (+0.4% to $1.8 billion) and British Columbia (+1.0% to $665 million).
As lockdowns and working from home continued across many parts of the country, reduced investment in office buildings, hotels and restaurants led to an overall reduction in commercial building investment (-0.5%). Commercial building investment was the lone component of non-residential construction to decline in November and remained below pre-COVID-19 levels (-13.5% compared with March 2020).
Investment in industrial building construction increased 0.6% in November, with the majority of the growth in Ontario (+1.7% to $339 million) and Quebec (+1.5% to $215 million). The increases reported in Ontario were attributable primarily to the construction of the $100 million Metrolinx Keelesdale transit station in the city of Toronto.
Institutional building investment advanced 0.4%—the first increase in this component following four months of declines. The majority of the growth was reported in Alberta (+2.6%) and British Columbia (+1.5%), stemming from new construction of educational buildings in both provinces and welfare homes in British Columbia.
Residential construction declines slightly
Investment in residential construction edged down 0.1% in November, declining for the first time in six months. Lower investment in multi-unit dwellings more than offset the growth reported for single-unit investment. Provincially, Manitoba reported the largest decline (-7.8% to $402 million), followed by Quebec (-1.1% to $2.3 billion). Meanwhile, Nova Scotia reached its second-highest value on record, up 15.2% to $271 million.
Despite the exceptional COVID-19-related decline in April 2020, year-over-year investment in single-unit buildings increased 9.4%. In November, single-unit investment was up 2.1% to $5.6 billion. The construction of new single family homes in Toronto led to an increase of 2.1% in Ontario—the largest increase of all the provinces.
Multi-unit construction investment declined for the second consecutive month in November, down 2.2% to $5.2 billion, and offsetting the growth observed in single-unit investment. Manitoba, Quebec, and Alberta reported the largest drops of the five provinces reporting declines in this component.
Note to readers
Based on the extraordinary events and business disruptions around the COVID-19 pandemic, Statistics Canada continues to make adjustments to the models used to estimate investment in building construction. As a result of these adjustments, there may be larger-than-normal revisions to the data.
Unadjusted data for the current reference month are subject to revision based on late responses. Data for the previous month have been revised. Deflated data and seasonally adjusted data are revised for the previous two months.
Data presented in this release are seasonally adjusted unless otherwise stated. Using seasonally adjusted data allows month-to-month comparisons by removing the effects of seasonal variations. For information on seasonal adjustment, see Seasonally adjusted data – Frequently asked questions.
Monthly estimates for constant dollars are calculated using quarterly deflators from the Building Construction Price Index (18-10-0135-01). Typically, the first two months of a quarter use the previous quarters' price level and are revised when the new quarterly price index becomes available.
Detailed data on investment activity by type of building and type of work are now available in the unadjusted current dollar series.
Prior to January 2018, building permits for cottages with a value greater than $60,000 were automatically reclassified to structure type Single. Beginning in January 2018, regardless of value, building permits received from municipalities coded as cottages remain classified as a cottage.
Effective November 23, 2018, table 34-10-0175-01 contains data on both the residential and non-residential sectors. It replaced tables 34-10-0010-01, 34-10-0011-01 and 34-10-0012-01.
Next release
Data on investment in building construction December 2020 will be released on February 8, 2021.
Products
A study titled "Price trends and outlook in key Canadian housing markets" looks at where the housing market was at the onset of the COVID-19 pandemic, sheds light on what has happened since then and explores the challenges facing the Canadian market going forward.
Statistics Canada has a "Housing Market Indicators" dashboard. This web application provides access to key housing market indicators for Canada, by province and by census metropolitan area. These indicators are updated automatically with new information from monthly releases, giving users access to the latest data.
Contact information
For more information, or to enquire about the concepts, methods or data quality of this release, contact us (toll-free 1-800-263-1136; 514-283-8300; STATCAN.infostats-infostats.STATCAN@canada.ca) or Media Relations (613-951-4636; STATCAN.mediahotline-ligneinfomedias.STATCAN@canada.ca).
- Date modified:


