Consumer Price Index, October 2020
Archived Content
Information identified as archived is provided for reference, research or recordkeeping purposes. It is not subject to the Government of Canada Web Standards and has not been altered or updated since it was archived. Please "contact us" to request a format other than those available.
Released: 2020-11-18
October 2020
0.7% 
(12-month change)
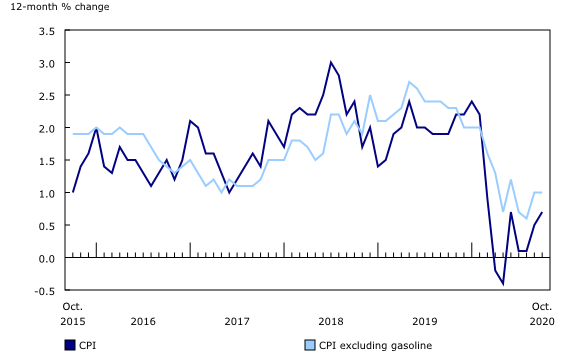
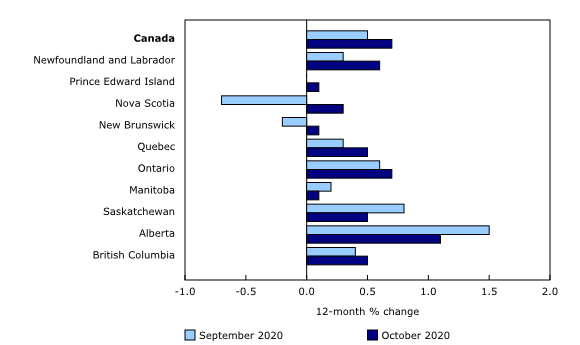
The Consumer Price Index (CPI) rose 0.7% on a year-over-year basis in October, up from a 0.5% increase in September, led by higher prices for food. Excluding gasoline, the CPI rose 1.0% in October, matching the increase in September. The year-over-year decline in gasoline prices in October (-12.4%) was comparable with the decreases in September (-10.7%) and August (-11.1%).
On a seasonally adjusted monthly basis, the CPI rose 0.3% in October.
Explore a new tool—The Personal Inflation Calculator
Check out the new Personal Inflation Calculator! This interactive calculator allows you to enter dollar amounts in the common expense categories to produce a personalized inflation rate, which you can compare to the official measure of inflation that represents the average Canadian household—the Consumer Price Index (CPI).
Reddit Ask Me Anything
Do you have questions about the CPI, Canadian inflation or the new Personal Inflation Calculator? Join us for a Reddit Ask Me Anything event with our data experts on Thursday, November 19 at 1:30 p.m., Eastern Time.
Multiple ways of exploring the Consumer Price Index
Visit the Consumer Price Index portal to find all CPI data, publications, interactive tools, and announcements highlighting new products and upcoming changes to the CPI in one convenient location.
Check out the "Consumer Price Index Data Visualization Tool" to access current and historical CPI data in a customizable visual format.
Highlights
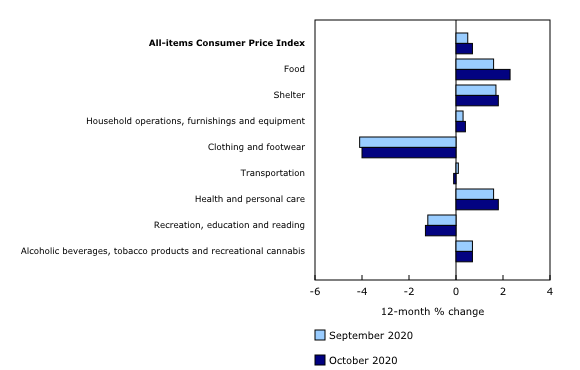
Prices rose in five of the eight major components on a year-over-year basis in October. While the shelter component contributed the most to the year-over-year increase, the all-items index rose at a faster pace in October compared with September, mainly due to the food component.
Prices for fresh vegetables and meat grow faster in October
Year-over-year price growth for fresh vegetables was higher in October (+9.5%) than September (+3.6%). This was partially attributable to higher prices for lettuce, which rose by around one-quarter (+25.6%) in October amid reduced supply stemming from disease and inclement weather in growing regions.
Meat prices rose 1.7% on a year-over-year basis in October, following a 0.4% increase in September. This faster price growth was supported by higher prices for fresh or frozen chicken (+2.4%) following a 2.2% decline in September. Volatility in the food service industry related to COVID-19 has had an unpredictable impact on chicken prices. The rise in prices in October followed production cuts beginning in May, which were implemented in an effort to steady the market.
Mortgage interest cost falls, while homeowners' replacement cost rises
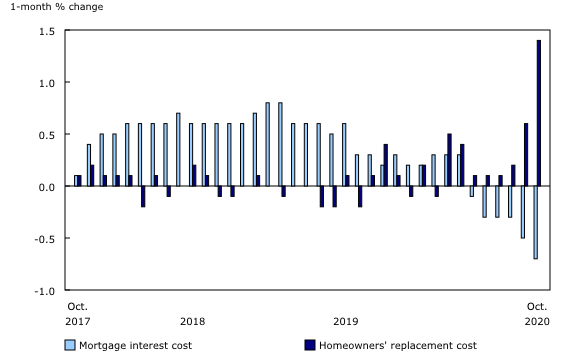
The mortgage interest cost index fell 0.7% on a month-over-month basis in October, following a 0.5% monthly decline in September. Mortgage rates continue to face downward pressure from lower interest rates following reductions in the Bank of Canada's policy interest rate in March.
Lower interest rates continued to coincide with increased demand for single-family homes. This, along with higher building material costs and low inventory of homes for sale, contributed to higher costs for new housing, with new home prices increasing at their fastest pace in 14 years. The homeowners' replacement cost index, which is derived from the price of new homes, rose 1.4% month over month, the largest monthly increase since June 1991.
Lower prices for traveller accommodation
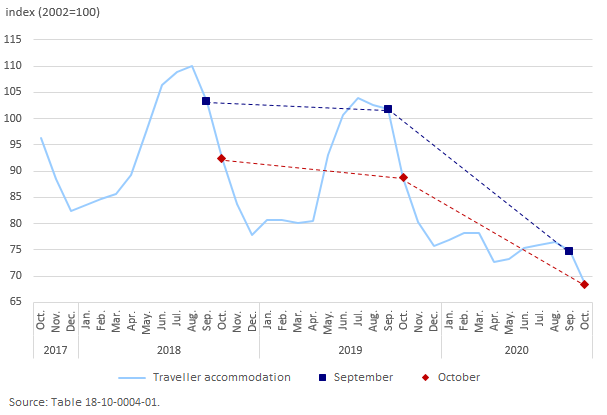
Although tourist activity has remained weak since the onset of COVID-19 and related safety measures, traveller accommodation prices fell less on a year-over-year basis in October (-22.9%) than in September (-26.5%). Prices for traveller accommodation traditionally decline in September and October as demand weakens following the peak summer travel period. Prices remained low this summer amid the COVID-19 pandemic, and as a result, prices fell less on a monthly basis this October (-8.4%) compared with October 2019 (-12.8%).
Regional highlights
Prices rose in all provinces on a year-over-year basis in October.
Cigarette prices increase in Newfoundland and Labrador
Prices for cigarettes rose 14.9% year over year in Newfoundland and Labrador in October, the largest increase since June 2003, as taxes on tobacco increased effective October 1.
Higher prices for natural gas in Ontario
Year over year, Canadians paid 11.6% more for natural gas in October, following a 1.8% increase in September. This was mainly driven by a 12.5% monthly increase in natural gas prices in Ontario as utilities revised commodity prices to reflect higher current and forecasted prices, after deferring rate increases in the previous quarter.
Property taxes decline for the third consecutive year in Quebec, while Ontario leads the national increase
The property tax index, which is priced annually in October, rose 1.9% at the national level in 2020, albeit at a slower pace compared with the previous year. Similar to the previous two years, property taxes declined in Quebec as the provincial government lowered school taxes. Ontario contributed the most to the national increase as a result of higher assessment values for residential properties.
Additional research related to COVID-19
For more information about the impact of COVID-19 on consumer spending, please consult the research document entitled "Adjusting the Consumer Price Index to the new spending realities during the pandemic" released on October 8, which explores new sources of expenditure data to estimate basket weights that reflect shifting consumption patterns during the pandemic. The Monthly adjusted price index (provisional) and the Monthly adjusted consumer expenditure basket weights data tables are available.
For more information on consumer expenditures during COVID-19, users can consult two available documents. The first is "Canadian Consumers Prepare for COVID-19," which examines the shifting consumption patterns of Canadians during the COVID-19 pandemic up to March 14. The second is "Canadian Consumers Adapt to COVID-19: A Look at Canadian Grocery Sales up to April 11," which explores a continued shift in the consumption patterns of Canadians during the COVID-19 pandemic up to April 11.
All of the above publications can be found in the Prices Analytical Series (62F0014M).
Note to readers
COVID-19 and the Consumer Price Index
Statistics Canada continues to monitor the impacts of the novel coronavirus (also known as COVID-19) on Canada's Consumer Price Index (CPI).
Goods and services in the Consumer Price Index (CPI) which were not available to consumers in October due to COVID-19 restrictions received special treatments, effectively removing their impact on the monthly CPI. The following sub-indexes were imputed from the monthly change in the All-items index: travel tours, components of spectator entertainment, recreational services, and some components of use of recreational facilities and services in some areas.
Due to new restrictions, the price indexes for beer served in licensed establishments, wine served in licensed establishments and liquor served in licensed establishments were imputed in Quebec, using the indexes to which consumers likely redirected their expenditures: beer purchased from stores, wine purchased from stores and liquor purchased from stores.
Consistent with previous months affected by the COVID-19 pandemic, prices for suspended flights are excluded from the October CPI calculation because passengers were ultimately unable to consume them. As a result, select sub-components of the air transportation index were imputed from the parent index (air transportation).
A document entitled "Technical Supplement for the October 2020 Consumer Price Index" is available in the Prices Analytical Series (62F0014M) publication, with further details on the imputations used to compile the October 2020 CPI.
Cellular services index
The cellular services index is now published in data table 18-10-0004-01.
Real-time data tables
Real-time data table 18-10-0259-01 will be updated on November 30. For more information, consult the document Real-time CANSIM tables.
Next release
The Consumer Price Index for November will be released on December 16.
Products
The "Consumer Price Index Data Visualization Tool" is available on the Statistics Canada website.
More information about the concepts and use of the Consumer Price Index (CPI) is available in The Canadian Consumer Price Index Reference Paper (62-553-X).
For information on the history of the CPI in Canada, consult the publication Exploring the First Century of Canada's Consumer Price Index (62-604-X).
Two videos, "An Overview of Canada's Consumer Price Index (CPI)" and "The Consumer Price Index and Your Experience of Price Change," are available on Statistics Canada's YouTube channel.
Contact information
For more information, or to enquire about the concepts, methods or data quality of this release, contact us (toll-free 1-800-263-1136; 514-283-8300; STATCAN.infostats-infostats.STATCAN@canada.ca) or Media Relations (613-951-4636; STATCAN.mediahotline-ligneinfomedias.STATCAN@canada.ca).
- Date modified:


