Consumer Price Index, May 2020
Archived Content
Information identified as archived is provided for reference, research or recordkeeping purposes. It is not subject to the Government of Canada Web Standards and has not been altered or updated since it was archived. Please "contact us" to request a format other than those available.
Released: 2020-06-17
May 2020
-0.4% 
(12-month change)
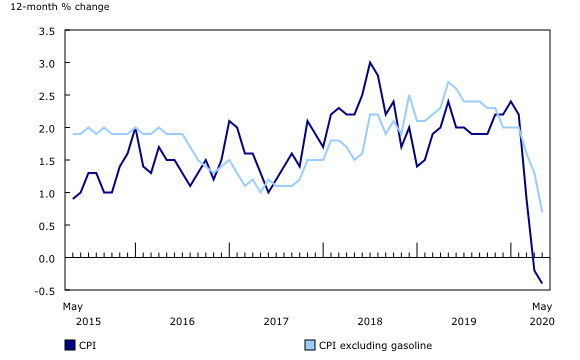
The Consumer Price Index (CPI) fell 0.4% on a year-over-year basis in May, down from a 0.2% decline in April. Excluding gasoline, the CPI rose 0.7%, the smallest increase since January 2013.
On a seasonally adjusted monthly basis, the CPI increased 0.1% in May. Among the major components, the transportation index (+2.7%) was the only one to increase, driven by higher gasoline prices in May.
Highlights
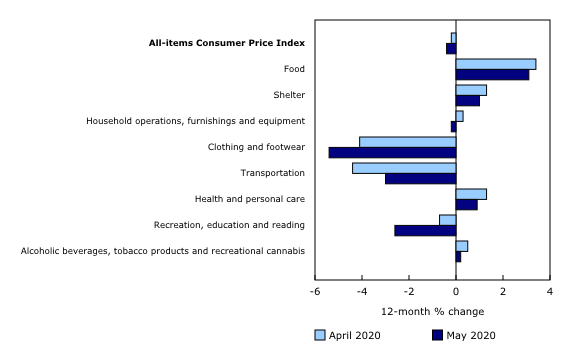
Prices rose in four of the eight major components on a year-over-year basis. Transportation prices contributed the most to the decline in the CPI, mainly because of lower gas prices compared with May 2019. Food prices (+3.1%) remained high in May, with the largest year-over-year increase among the major components.
As the year-over-year decline in prices for goods (-2.3%) slowed in May, largely the result of rising energy prices, year-over-year growth in prices for services slowed from 2.0% in April to 1.3% in May. This slowdown was broad-based, with travel, shelter and contract services, such as telephone services and passenger vehicle insurance premiums, all contributing.
Rent and mortgage interest costs decrease
Rents declined for the second consecutive month in May, decreasing 0.8% from April. Physical distancing measures that kept many Canadians at home and unprecedented employment losses in March and April contributed to lower-than-usual demand for rentals. In addition, many short-term rental units were converted to long-term rentals in response to lower demand and regional restrictions during COVID-19. This boosted the supply of rentals in major cities and also contributed to lower rents.
The mortgage interest cost index decreased 0.1% on a month-over-month basis because of major commercial banks lowering their mortgage rates in response to falling bond yields and policy interest rate cuts from the Bank of Canada. This was the first monthly decline in the mortgage interest cost index since July 2017.
Prices for telephone services decrease with May specials
The telephone services price index fell 2.4% on a monthly basis in May because of a series of nationwide price promotions for cellular services. Consumers paid less in every province in May as major wireless carriers offered specials for plans with higher data allowances.
Consumers pay less for traveller accommodation year over year
Traveller accommodation prices were down 21.3% compared with May 2019, the largest year-over-year decline on record. Lower prices were observed amid reduced demand for hotel rooms stemming from the closure of the Canadian border to tourists and stay-at-home measures that discouraged domestic travel.
Gasoline prices rise with higher international demand
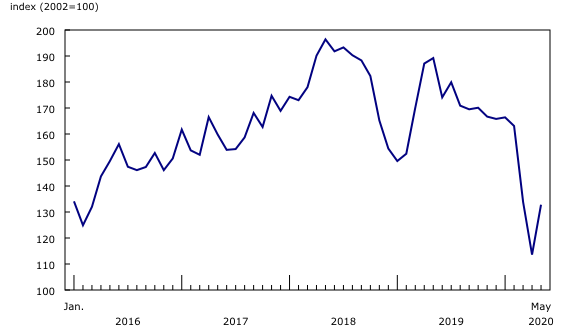
Gasoline prices rose 16.9% on a month-over-month basis in May after falling significantly in April (-15.2%) and March (-17.8%). Rising global demand for oil and gas drove the increase in May, as many countries started to ease restrictions that were put in place in response to the COVID-19 pandemic. In addition, major oil-producing countries agreed to cut production starting May 1, and this contributed to the rise in prices by limiting supply. Despite the monthly increase in May, prices for gasoline were 29.8% lower compared with May 2019 and remained below the price level observed in March 2020.
Consumers pay more for meat and non-perishable foods
Consumers paid 7.8% more for meat compared with May 2019, as fresh or frozen beef prices (+13.7%) rose the most, on a year-over-year basis, since 2015. The increase followed a series of supply disruptions, including plant closures as a result of COVID-19, and higher import prices from a weaker Canadian dollar.
Year-over-year prices for canned tuna (+13.9%), flour and flour-based mixes (+9.4%), and rice and rice-based mixes (+9.3%) rose in May, coinciding with higher demand for non-perishable foods.
Regional highlights
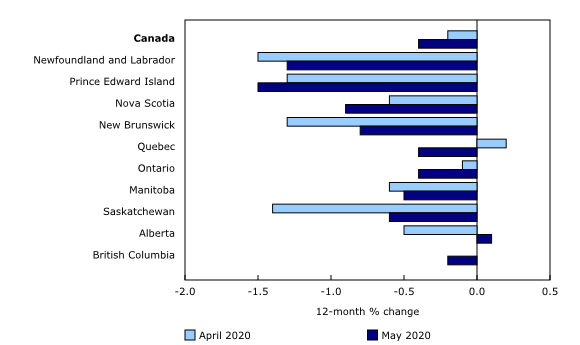
Prices declined in nine provinces on a year-over-year basis in May.
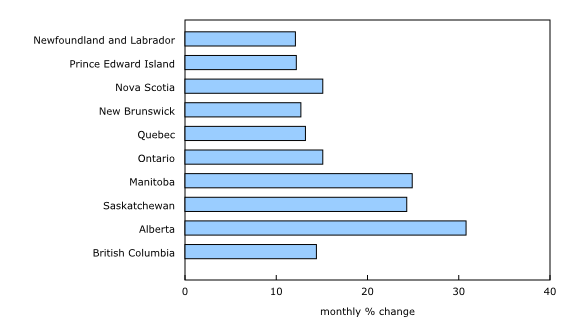
Gasoline prices rise the most in the Prairies
On a month-over-month basis, gasoline prices increased in all provinces in May. The gains were strongest in the Prairie provinces, which began reopening their economies and easing physical distancing measures ahead of other provinces.
Two ways of exploring the Consumer Price Index (CPI)
Visit the Consumer Price Index Portal to find all CPI data, publications, interactive tools, and announcements highlighting new products and upcoming changes to the CPI in one convenient location.
Check out the Consumer Price Index Data Visualization Tool to access current and historical CPI data in a customizable visual format.
Consumer expenditures during the COVID-19 pandemic
The COVID-19 pandemic has undoubtedly led to shifts in consumer purchasing patterns, as Canadians adapt to driving less, travelling less and buying more of certain items, such as cleaning products and non-perishable foods. Changing purchasing patterns have implications for the basket weights used to calculate the Consumer Price Index (CPI), which is built to represent the consumption expenditures of the average Canadian household.
The Canadian CPI uses a fixed basket, based on expenditure data reported by Canadians in the Survey of Household Spending. This method allows for consistent measurement of pure price change by quantifying how the cost of this fixed basket of goods and services changes over time. It works well in stable economic conditions.
In partnership with the Bank of Canada, Statistics Canada is exploring ways to use current, ad hoc sources of expenditure data to estimate CPI basket weights that reflect shifting consumption patterns during the pandemic. These data cover several CPI product categories and provide an estimate of expenditure weights during the pandemic. Weight estimates, updated to reflect expenditures during the COVID-19 pandemic and the concurrent period of physical distancing, can provide insight into whether major shifts in consumption patterns result in statistically significant changes to the headline CPI. The results of this work will be released soon.
Statistics Canada will continue to calculate the official CPI based on the fixed basket approach. However, this exploratory work recognizes that an analytical CPI series that accounts for temporary extreme shifts in consumer purchasing patterns can provide additional insight into the impact of COVID-19 on the CPI.
Note to readers
COVID-19 and the Consumer Price Index
Statistics Canada continues to monitor the impacts of the novel coronavirus (also known as COVID-19) on Canada's Consumer Price Index (CPI).
In May, measures remained in place across much of the country to restrict the movement of people and order the temporary closure of businesses. Subsequently, in-person field collection was conducted via telephone or Internet, supplementing prices collected via web scraping, transaction data and administrative data. Because of the impact of COVID-19 on product availability in May 2020, selected sub-components of the CPI received temporary special imputations.
While some products and services, such as child care and housekeeping services, started to become available for consumption in May, others, such as spectator entertainment and travel tours, remained unavailable. Availability of these goods and services varied throughout the country, as different provinces reopened their economies to various extents at different times. The following sub-indexes were imputed from the monthly change in the all-items index: travel tours, spectator entertainment, and use of recreational facilities. These imputations have the effect of removing the impact of these goods and services on the CPI.
Although prices for airfares were collected prior to the suspension of flights, prices for suspended flights are excluded from the May CPI calculation because passengers were ultimately unable to consume these services. As a result, selected sub-components of the air transportation index were imputed from the parent index.
The price indexes for beer served in licensed establishments, wine served in licensed establishments and liquor served in licensed establishments were imputed in regions where the restrictions remained in place, using the indexes to which consumers likely redirected their expenditures: beer purchased from stores, wine purchased from stores and liquor purchased from stores.
Where prices were missing because of high levels of out-of-stock products or the temporary closure of businesses, they were imputed with the average price movement of available prices for those items.
As in April, selected sub-components of the CPI received temporary special imputations because of the impact of COVID-19 on product availability. A document entitled "Technical Supplement for the May 2020 Consumer Price Index" is available in the Prices Analytical Series (62F0014M) publication, with further details on the imputations used to compile the May 2020 CPI.
Cellular services index
The cellular services index is available upon request. For more information, contact us (toll-free 1-800-263-1136; 514-283-8300; STATCAN.infostats-infostats.STATCAN@canada.ca).
Real-time data tables
Real-time data table 18-10-0259-01 will be updated on June 29.
Next release
The Consumer Price Index for June will be released on July 22.
Products
The Consumer Price Index Data Visualization Tool is available on the Statistics Canada website.
More information about the concepts and use of the Consumer Price Index (CPI) is available in The Canadian Consumer Price Index Reference Paper (62-553-X).
For information on the history of the CPI in Canada, consult the publication Exploring the First Century of Canada's Consumer Price Index (62-604-X).
Two videos, "An Overview of Canada's Consumer Price Index (CPI)" and "The Consumer Price Index and Your Experience of Price Change," are available on Statistics Canada's YouTube channel.
Contact information
For more information, or to enquire about the concepts, methods or data quality of this release, contact us (toll-free 1-800-263-1136; 514-283-8300; STATCAN.infostats-infostats.STATCAN@canada.ca) or Media Relations (613-951-4636; STATCAN.mediahotline-ligneinfomedias.STATCAN@canada.ca).
- Date modified:


