Canadian Housing Statistics Program, 2019
Archived Content
Information identified as archived is provided for reference, research or recordkeeping purposes. It is not subject to the Government of Canada Web Standards and has not been altered or updated since it was archived. Please "contact us" to request a format other than those available.
Released: 2020-05-22
For the first time, today the Canadian Housing Statistics Program (CHSP) is publishing data on residential properties in New Brunswick and their characteristics.
This overview of residential properties in New Brunswick for reference year 2019 expands on the previously released data for British Columbia, Ontario and Nova Scotia. This publication also marks the introduction of a new level of geographical detail, the census agglomeration (CA) level.
The Fundy Isles have the highest non-resident ownership rate in New Brunswick
In New Brunswick, 2.9% of the province's 374,995 residential properties were owned by non-residents of Canada. Vacant land (44.9%) and single-detached houses (43.1%) were the most common types of residential properties owned by non-residents. In comparison, 64.4% of resident-owned properties were single-detached houses, and 20.0% were vacant land.
The highest rates of non-resident ownership were found in areas bordering the United States, such as the Fundy Isles. This is similar to previous findings that showed that non-resident ownership in other provinces was highest in areas bordering the United States and in recreational destinations outside metropolitan areas.
In Campobello Island, where the non-resident ownership rate in 2019 was the highest across all census subdivisions in New Brunswick, two out of five properties were owned by non-residents. This island is accessible year-round from the state of Maine.
Semi-detached houses and row houses in New Brunswick have higher values than single-detached houses
In New Brunswick, the median assessment values of semi-detached houses ($148,000) and row houses ($146,000) were higher than those of single-detached houses ($128,000). Almost all semi-detached and row houses (93.0%) were within census metropolitan areas (CMAs) and CAs, compared with just over half of the single-detached houses.
The CA of Fredericton reported the highest median assessment values for single-detached houses, semi-detached houses and row houses in the province. As the capital of New Brunswick, Fredericton has two universities and a growing tech sector and is close to a military training facility.
In New Brunswick fewer properties outside population centres are occupied by owners
In New Brunswick, properties that are not occupied by the owner are taxed by both the municipality and province. The share of owner-occupied properties (78.5%) was comparable to that in Ontario (77.5%), but higher than that in British Columbia (71.1%) and Nova Scotia (64.9%).
Fewer properties (72.3%) outside CMAs and CAs were occupied by owners since these properties were more likely to be secondary properties, such as cottages or other seasonal dwellings. Owner-occupied properties outside CMAs and CAs were valued 1.6 times higher than properties not occupied by the owner.
The majority of residential properties in New Brunswick are over 20 years old
In New Brunswick, nearly two-thirds (63.8%) of residential properties were single-detached houses, and one in five (20.7%) residential properties was vacant land. These proportions are similar to those previously observed in Nova Scotia.
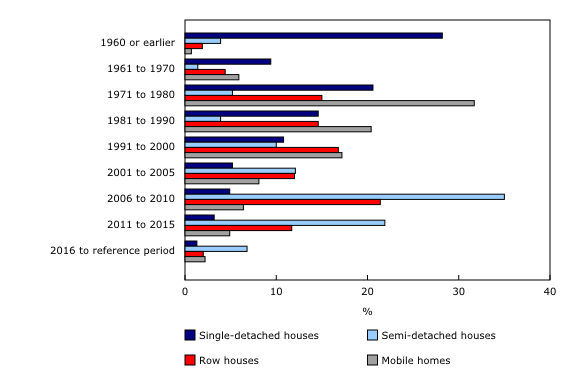
The majority of single-detached houses (83.5%), mobile homes (75.9%) and row houses (52.7%) in New Brunswick were built before 2001. In contrast, three-quarters (75.8%) of semi-detached houses in New Brunswick were built after 2000.
Note to readers
The data released today reflect the stock of residential properties available on the 2019 property assessment roll in New Brunswick.
The assessment values for New Brunswick are in 2018 dollars.
Assessment values are used to determine property taxes and do not necessarily represent market values. It is difficult to compare assessment values of similar property types among provinces and territories since each province and territory has its own assessment period and duration of the valuation roll.
For the first time in the CHSP, mobile homes are classified separately from single-detached houses. These data will be available in releases going forward to provide more precise assessment values and living area measures for property types.
A mobile home is a single dwelling designed and constructed to be transported on its own chassis and capable of being moved to a new location on short notice. It may be placed temporarily on a foundation pad and may have a skirt. The mobile home category may also include houseboats and mini homes.
Contact information
For more information, or to enquire about the concepts, methods or data quality of this release, contact Jean-Philippe Deschamps-Laporte (343-998-7200; jean-philippe.deschamps-laporte@canada.ca) or Ellen Bekkering (613-878-7146; ellen.bekkering@canada.ca).
- Date modified:


