Building permits, October 2019
Archived Content
Information identified as archived is provided for reference, research or recordkeeping purposes. It is not subject to the Government of Canada Web Standards and has not been altered or updated since it was archived. Please "contact us" to request a format other than those available.
Released: 2019-12-09
$8.3 billion
October 2019
-1.5% 
(monthly change)
$53.6 million
October 2019
-19.5% 
(monthly change)
$48.3 million
October 2019
8.7% 
(monthly change)
$172.2 million
October 2019
5.3% 
(monthly change)
$81.9 million
October 2019
-7.5% 
(monthly change)
$1,690.6 million
October 2019
12.3% 
(monthly change)
$3,359.5 million
October 2019
-3.4% 
(monthly change)
$438.0 million
October 2019
74.3% 
(monthly change)
$136.6 million
October 2019
22.0% 
(monthly change)
$960.2 million
October 2019
-6.6% 
(monthly change)
$1,296.9 million
October 2019
-21.2% 
(monthly change)
$32.4 million
October 2019
204.2% 
(monthly change)
$4.5 million
October 2019
85.3% 
(monthly change)
$0.5 million
October 2019
-88.4% 
(monthly change)
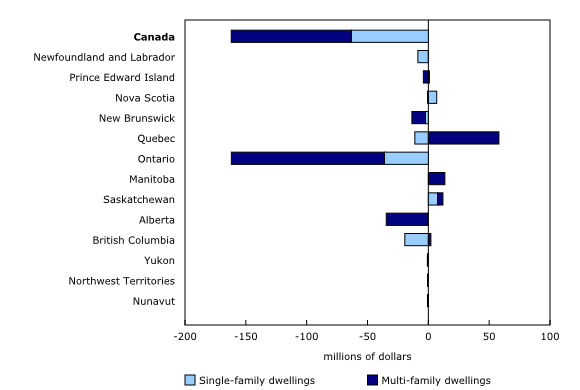
The total value of building permits issued by Canadian municipalities decreased 1.5% to $8.3 billion in October. Declines were reported in five provinces, with the largest decrease in British Columbia (-21.2% to $1.3 billion). Quebec offset some of this decline, with the value of building permits in that province rising 12.3% to $1.7 billion.
For more information on housing, please visit the Housing Statistics Portal.
Residential permits down
The total value of residential permits fell below $5 billion in October for the first time since March 2019. The value of permits declined for both single (-2.9%) and multi-family (-3.4%) dwellings.
Increase in the value of institutional permits
The value of institutional permits rose 24.9% to $765 million in October, largely due to gains in Manitoba (+$79 million) and Ontario (+$72 million).
The value of commercial permits decreased 5.3% to $2.0 billion. Gains were reported in eight provinces, led by Quebec (+$161 million), but this was not enough to offset a sizeable decline in British Columbia (-$317 million).
Industrial permits decreased 1.1% to $604 million.
Manitoba permits reach record high
Manitoba reported gains in all categories of permits in October, with the total value increasing 74.3% to a record high of $438 million. This increase was largely attributable to high value permits issued in Winnipeg. The mixed-use development True North Square drove gains in multi-family and commercial permits. Institutional permits reached their highest value since April 2003, largely due to an expansion at Red River College. Major upgrades to a water treatment plant in Brandon significantly contributed to the value of industrial permits, which more than doubled compared with September.
Note to readers
Unless otherwise stated, this release presents seasonally adjusted data, which facilitate month-to-month comparisons by removing the effects of seasonal variations. For information on seasonal adjustment, see Seasonally adjusted data – Frequently asked questions.
The Building Permits Survey covers over 2,400 municipalities, representing 95% of the Canadian population. The communities representing the other 5% of the population are very small, and their levels of building activity have little impact on the total for the entire population.
Building permit data are used as a leading indicator of activity in the construction industry.
The value of planned construction activities presented in this release excludes engineering projects (such as waterworks, sewers or culverts) and land.
For the purposes of this release, the census metropolitan area of Ottawa–Gatineau (Ontario and Quebec) is divided into two areas: the Ottawa part and the Gatineau part.
Unless otherwise specified, the highlights refer to seasonally adjusted current dollars and are ranked in terms of dollar change rather than percentage change.
Building components
Single-family dwellings: Residential buildings containing only one dwelling unit (for example, single-detached house, bungalow, linked home [linked at the foundation]).
Multi-family dwellings: Residential buildings containing multiple dwelling units (for example, apartment, apartment condominium, row house, semi-detached).
Industrial buildings: Buildings used in the processing or production of goods, or related to transportation and communication.
Commercial buildings: Buildings used in the trade or distribution of goods and services.
Institutional and government buildings: Buildings used to house public and semi-public services, such as those related to health and welfare, education, or public administration, as well as buildings used for religious services.
Revision
Unadjusted data for the current reference month are subject to revision based on late responses. Data for the previous month have been revised. Seasonally adjusted data for the previous two months have also been revised.
Trend-cycle estimates have been added to the charts as a complement to the seasonally adjusted series. Both seasonally adjusted data and trend-cycle estimates are subject to revision as additional observations become available. These revisions could be large and could even lead to a reversal of movement, especially at the end of the series. The higher variability associated with trend-cycle estimates is indicated with a dotted line on the chart.
For information on trend-cycle data, see the StatCan Blog and Trend-cycle estimates – Frequently asked questions.
Next release
Data on building permits for November 2019 will be released on January 9, 2020.
Contact information
For more information, or to enquire about the concepts, methods or data quality of this release, contact us (toll-free 1-800-263-1136; 514-283-8300; STATCAN.infostats-infostats.STATCAN@canada.ca) or Media Relations (613-951-4636; STATCAN.mediahotline-ligneinfomedias.STATCAN@canada.ca).
- Date modified:


