National tourism indicators, second quarter 2019
Archived Content
Information identified as archived is provided for reference, research or recordkeeping purposes. It is not subject to the Government of Canada Web Standards and has not been altered or updated since it was archived. Please "contact us" to request a format other than those available.
Released: 2019-09-26
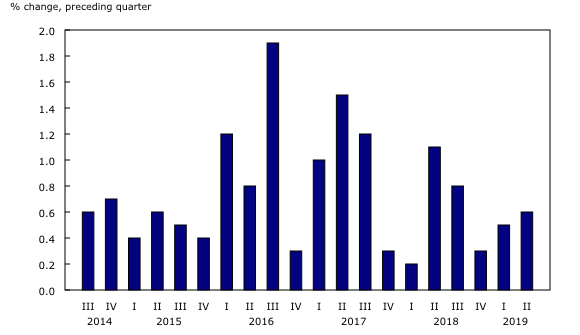
Tourism spending in Canada rose 0.6% in the second quarter following a 0.5% gain in the first quarter. Growth in the second quarter was driven by increased spending by international visitors.
Tourism represented 2.0% of economy-wide gross domestic product (GDP) and 3.9% of Canadian jobs in the second quarter.
Tourism GDP rose 1.1%, a slightly faster pace than the economy-wide GDP (+0.9%), as growth in the accommodation and transportation industries increased. However, tourism jobs rose at a slower pace (+0.2%) compared with growth in jobs for the overall economy (+0.7%).
Tourism spending by Canadians edges up
Tourism spending by Canadians in Canada edged up 0.1% in the second quarter, following a 0.4% increase in the first quarter. It accounted for 78.4% of total tourism spending in Canada.
Accommodation (+0.7%), travel services (+1.2%) and pre-trip expenses (+1.0%), such as luggage and camping equipment, contributed to the increase, while non-tourism products (-0.6%), such as groceries and clothing, dampened the overall growth.
Spending by international visitors increases
Tourism spending by international visitors to Canada rose 2.4% in the second quarter, following a 0.6% increase in the previous quarter.
Growth was driven by accommodation (+3.0%), passenger air transport (+2.8%), food and beverage services (+2.4%), and non-tourism products (+1.4%).
Both overnight travel from abroad and same-day car travel from the United States increased in the second quarter.
Growth in tourism GDP accelerates
Tourism GDP rose 1.1% in the second quarter, following a 0.5% increase in the first quarter.
The increase in tourism GDP was largely due to gains in the accommodation (+2.2%) and transportation (+1.2%) industries, while other industries also posted growth.
Employment attributable to tourism rose 0.2% in the second quarter, following a 0.6% gain in the previous quarter. Increased employment in the recreation and entertainment (+0.6%) and food and beverage services (+0.5%) industries was partially offset by lower employment in the air transportation (-0.9%) industry.
Government revenue attributable to tourism increases in 2018
In 2018, $28.9 billion of government revenue was directly attributable to tourism, up 4.3% from 2017. Domestic tourism spending accounted for 76.0% of this revenue, with the remainder coming from tourism exports.
Taxes on products sold to final consumers ($16.4 billion), such as the goods and services tax and harmonized sales tax, were the largest source of government revenue attributable to tourism, followed by corporate and individual income tax ($6.7 billion).
Most of the revenue generated from tourism was collected by the federal, provincial and territorial governments (95.2%). The remainder was collected by municipal and Aboriginal governments.
Every $100 spent by non-resident visitors generated, on average, $31.36 in government revenue, up from $31.00 in 2017. Resident visitors generated $27.81 in revenue for every $100 spent, compared with $27.45 the previous year. Overall, every $100 in tourism spending generated $28.30 in government revenue in 2018, down from $28.52 in 2017.
Sustainable development goals
On January 1, 2016, the world officially began implementing the 2030 Agenda for Sustainable Development, the United Nations' transformative plan of action that addresses urgent global challenges over the next 15 years. The plan is based on 17 specific sustainable development goals.
The national tourism indicators are an example of how Statistics Canada supports the reporting on the global goals for sustainable development. This release will be used in helping to measure the following goal:

Note to readers
Growth rates for tourism spending and gross domestic product (GDP) are expressed in real terms (that is, adjusted for price changes), using reference year 2012, as well as adjusted for seasonal variations, unless otherwise indicated. Employment data are also seasonally adjusted. Tourism's share of economy-wide GDP is calculated from seasonally adjusted nominal values. Tourism's share of economy-wide employment is calculated using seasonally adjusted values. Government revenue attributable to tourism is expressed in nominal terms. For information on seasonal adjustment, see Seasonally adjusted data – Frequently asked questions.
Associated percentage changes are presented at quarterly rates unless otherwise noted.
Economy-wide GDP is obtained from table 36-10-0104-01. Economy-wide employment is obtained from table 36-10-0207-01.
The national tourism indicators are funded by Destination Canada.
Next release
Data on the national tourism indicators for the third quarter will be released on January 9, 2020.
Products
The data visualization product "Provincial and Territorial Tourism Satellite Account," which is part of Statistics Canada – Data Visualization Products (71-607-X), is available.
The Latest Developments in the Canadian Economic Accounts (13-605-X) is available.
The User Guide: Canadian System of Macroeconomic Accounts (13-606-G) is available.
The Methodological Guide: Canadian System of Macroeconomic Accounts (13-607-X) is available.
Contact information
For more information, or to enquire about the concepts, methods or data quality of this release, contact us (toll-free 1-800-263-1136; 514-283-8300; STATCAN.infostats-infostats.STATCAN@canada.ca) or Media Relations (613-951-4636; STATCAN.mediahotline-ligneinfomedias.STATCAN@canada.ca).
- Date modified:


