The Canadian immigrant labour market: Recent trends from 2006 to 2017
Archived Content
Information identified as archived is provided for reference, research or recordkeeping purposes. It is not subject to the Government of Canada Web Standards and has not been altered or updated since it was archived. Please "contact us" to request a format other than those available.
Released: 2018-12-24
Like other industrialized countries, Canada has been experiencing an aging population—a longstanding trend that is reflected in the country's continued reliance on immigration to maintain and further its population and economic growth.
This trend is also reflected in the labour market, as employment growth essentially comes from two groups: core-working-age immigrants and Canadian-born aged 55 and older. From 2016 to 2017, employment in the core working-ages of 25 to 54 increased by 2.9% (+87,000) among landed immigrants, while it rose by 0.7% (+59,000) among the Canadian-born. Additional employment gains during 2017 came from Canadian-born aged 55 and older (+3.8% or +103,000).
Employment-rate gap between immigrants and Canadian-born narrowing
The employment rate for core-working-age immigrants rose to 78.9% in 2017, the highest since 2006—when comparable data became available. The corresponding rate for the Canadian-born population was 84.0%. In 2017, the gap between these two rates narrowed to its lowest level since 2006—after widening during and after the 2008-2009 recession.
Employment rates among immigrants tend to increase the longer they have been in the country. In 2017, immigrants who had been in Canada for five years or less had an employment rate of 69.8%, compared with 82.0% for immigrants who had been living in the country for more than a decade.
Higher employment rates in Western Canada for immigrants
Manitoba had the highest employment rate for immigrants (83.1%) in 2017, compared with 83.9% for the Canadian-born, the smallest gap among the provinces.
In Alberta, the rate of employment started to trend downward in 2014, for both immigrants and the Canadian-born—coinciding with economic weakness due to falling oil prices—hitting record lows in 2016, before moving upwards the following year. In 2017, the employment rate for immigrants in Alberta was the third highest in the country at 79.8%, while that in British Columbia was the second highest at 80.1%.
The largest employment-rate gap between immigrants and the Canadian-born was in Quebec, with rates of 77.8% and 86.2%, respectively.
Immigrants' industrial profile differs from Canadian-born
Immigrants are more likely to work in some industries and less likely to work in others. While they accounted for 26% of overall employment, their share in the low-earning accommodation and food services was 35% in 2017. On the other hand, their proportion was also greater in some high-paying industries such as finance, insurance, real estate, rental and leasing services (34%), as well as professional, scientific and technical services (32%). In contrast, 16% of workers in public administration were immigrants.
Newcomers' unemployment rate lowest since 2006
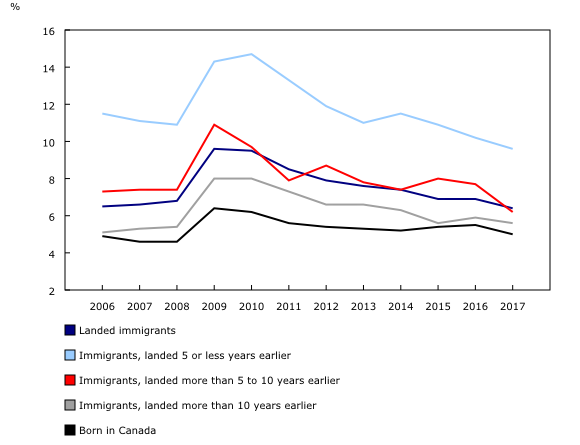
The unemployment rate for core-working-age immigrants was 6.4% in 2017, the lowest rate since 2006—when comparable data became available. All immigrant groups saw a decline in their rate of unemployment, especially newcomers (in the country for five years or less), whose rate (9.6%) fell below double-digits for the first time since 2006. The unemployment rate for Canadian-born also declined in 2017, to 5.0%, the lowest rate since 2008.
Recent immigrants (landed 5 to 10 years earlier) recorded the most notable decline in their unemployment rate, from 7.7% in 2016 to 6.2% in 2017.
Immigrant men faring better than immigrant women
In 2017, and for the first time since 2006—when comparable data became available—the unemployment rate for core-working-age immigrant men and Canadian-born men was the same, at 5.6%.
Also, the employment rate for core-working-age immigrant men (86.5%) was slightly higher than the rate for their Canadian-born counterparts (86.0%). In fact, it was significantly higher for recent immigrants (landed 5 to 10 years earlier) and established immigrants (landed more than 10 years earlier)—at 88.2% and 87.3% respectively. However, the employment rate for core-working-age men who were very recent immigrants (in the country for 5 years or less) was significantly lower, at 82.2%.
In contrast, labour-market gaps are typically wider for immigrant women, compared with both their male counterparts and with Canadian-born women. For example, the employment rate for core-working-age immigrant women was notably lower compared with Canadian-born women (72.0% versus 82.0%) in 2017, and their unemployment rate was almost double (7.2% versus 4.3%).
Note to readers
Data in this release are from the Labour Force Survey series on immigrants.
Products
A detailed report entitled "The Canadian Immigrant Labour Market: Recent Trends from 2006 to 2017"—released today as part of The Immigrant Labour Force Analysis Series (71-606-X)—examines recent trends in labour-market outcomes of immigrants, namely two key indicators: the rate of employment and the unemployment rate. The analysis focuses on immigrants in the core working-ages of 25 to 54. Individuals in this age group are most likely to have finished their schooling and to have not yet retired from the workforce.
The report also examines labour-market outcomes for core-working-age immigrants by province, industry, educational attainment, socio-demographic characteristics, and place of birth. A brief analysis of immigrant wages is also included.
Contact information
For more information, contact us (toll-free: 1-800-263-1136; 514-283-8300; STATCAN.infostats-infostats.STATCAN@canada.ca).
To enquire about the concepts, methods or data quality of this release, contact Lahouaria Yssaad (613-951-0627; lahouaria.yssaad@canada.ca), Andrew Fields (613-951-3551; andrew.fields@canada.ca) or Client Services (toll-free: 1-866-873-8788; statcan.labour-travail.statcan@canada.ca), Labour Statistics Division.
- Date modified:


