In the midst of high job vacancies and historically low unemployment, Canada faces record retirements from an aging labour force: number of seniors aged 65 and older grows six times faster than children 0-14
Archived Content
Information identified as archived is provided for reference, research or recordkeeping purposes. It is not subject to the Government of Canada Web Standards and has not been altered or updated since it was archived. Please "contact us" to request a format other than those available.
Released: 2022-04-27
A person's age is closely related to the goods they consume and the services they need. For example, a young adult may be thinking about buying their first home or purchasing goods and services to meet the needs of their young family, such as daycare. An older, retired person may seek out other goods and services, such as those related to recreation and health, and may even buy a smaller home or a car after their children have moved out.
A population has different needs depending on whether its age structure is younger or older, and changes to this structure can have significant effects on the economy and society as a whole. For many decades Canada's population has been aging; the number and proportion of older adults has been rising continuously. Population aging shifts the balance of services needed in some areas of the country and puts additional pressure on a number of sectors, including health care and labour.
Population aging is not new, but other changes to the age structure are more recent, such as a decrease in the number of very young children due to declining fertility since 2016. Furthermore, the COVID-19 pandemic has affected population age groups differently. For example, youth aged 15 to 24 saw a bigger decline in mental health, while older seniors were affected to a greater extent by excess mortality related to COVID-19.
Today, Statistics Canada is releasing a second series of results from the 2021 Census which features the age structure of the Canadian population and the types of dwelling in which Canadians live.
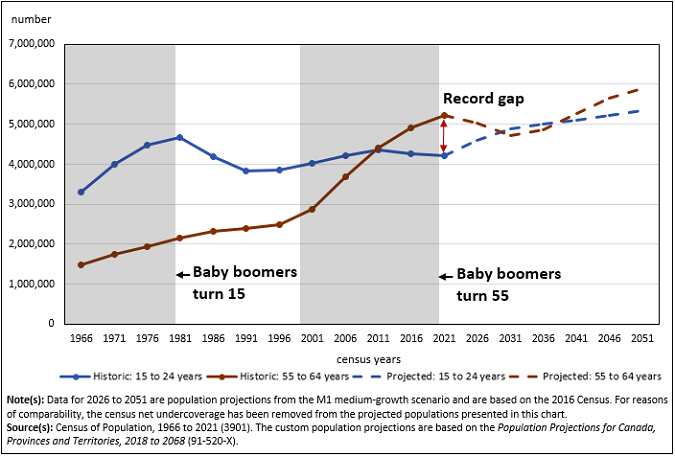
The working-age population, persons aged 15 to 64 who produce the bulk of goods and services in the Canadian economy, has reached a turning point. Never before has the number of people nearing retirement been so high. More than 1 in 5 (21.8%) persons of working age are aged 55 to 64. This is an all-time high in the history of Canadian censuses and one of the factors behind the labour shortages facing some industries across the country. The aging of many baby boom cohorts—the youngest of whom are between 56 and 64 years today—is accelerating population aging in general.
This release also presents results for other population age groups and an analysis of the types of dwellings in which Canadians live. The different types of dwellings reflect the realities of a population that is getting older, becoming more diverse, and more urban.
In the coming months, Statistics Canada will release more results from the 2021 Census, which will provide a comprehensive statistical portrait of Canadian communities from coast to coast to coast.
Please see the 2021 Census release schedule to find out when data and analysis on the upcoming topics will be released throughout 2022.
Highlights
The working-age population (persons aged 15 to 64) has never been older. More than 1 in 5 persons (21.8%) in this population is close to retirement, that is, aged 55 to 64. This proportion represents an all-time high in the history of Canadian censuses.
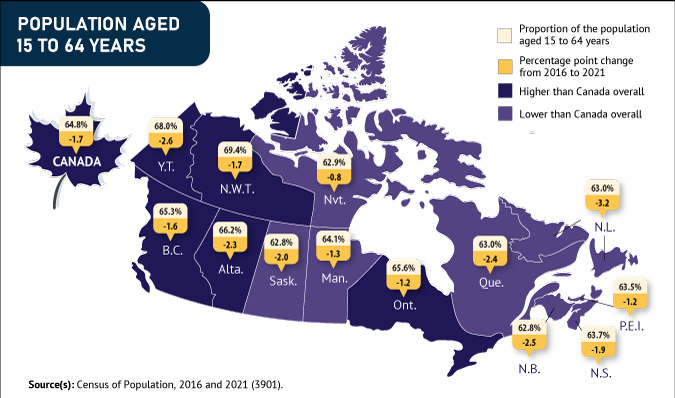
In Canada, the population aged 15 to 64 still represents a larger share of the total population (64.8%) than in the other G7 countries, particularly Japan (less than 60%). The proportion for the United States is very close to Canada's.
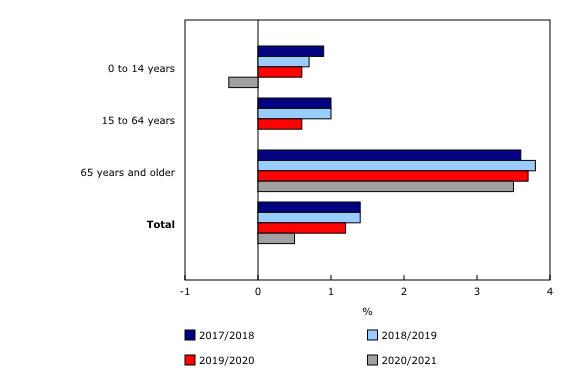
From 2016 to 2021, the number of persons aged 65 and older rose 18.3% to 7.0 million. This is the second largest increase in 75 years, after the increase observed from 2011 to 2016 (+20.0%).
The 7 million people aged 65 and older in 2021 represent nearly 1 in 5 Canadians (19.0%), up from 16.9% in 2016. Older Canadians are a growing economic and politically influential group. They are staying healthier, active, and involved for longer.
The number of persons aged 85 and older has doubled since 2001, reaching 861,000 in 2021. According to population projections, this number could triple by 2046.
From 2016 to 2021, the number of children under the age of 15 grew at a pace six times slower than the number of people aged 65 and older, to total 6.0 million.
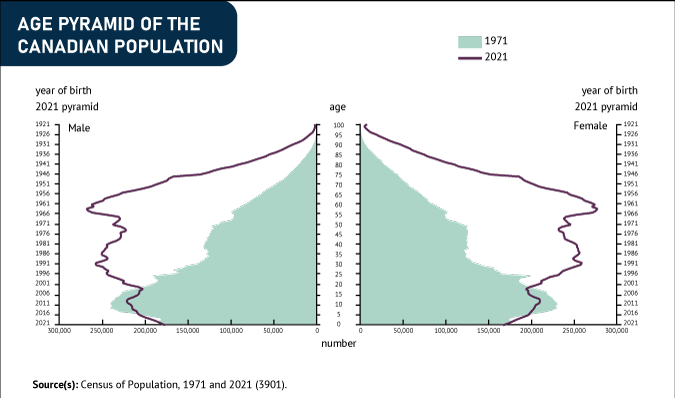
These demographic shifts are due to low fertility (the total fertility rate at fewer than two children per woman for nearly 50 years), the gradual increase in life expectancy, and the fact that the large baby boom generation (born between 1946 and 1965) started turning 65 in 2011.
Immigration has a rejuvenating effect on the Canadian population, but this effect is not enough to stop the population aging process.
While aging, Canada still has one of the youngest populations among the G7 countries, after the United States and the United Kingdom.
The COVID-19 pandemic slowed population growth in all age groups. However, it has not had a significant impact on population aging.
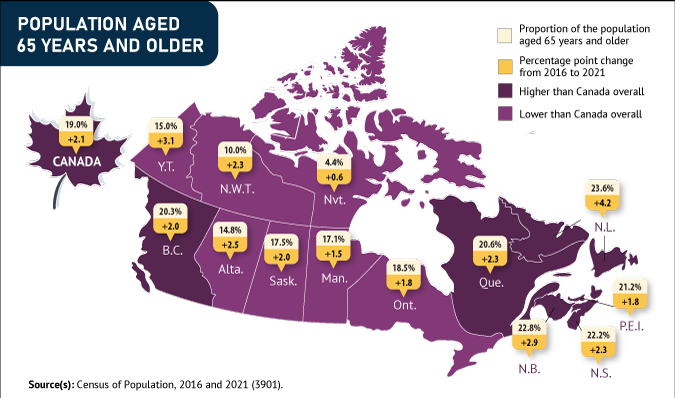
From 2016 to 2021, the proportion of the population aged 65 and older grew the fastest in Newfoundland and Labrador (+4.2 percentage points).
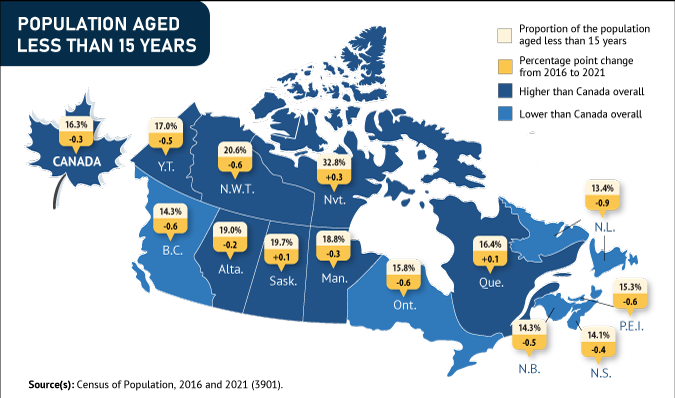
Manitoba, Saskatchewan and Alberta are the only provinces in the country where children under the age of 15 still outnumber persons aged 65 and older.
The age structure of Nunavut is very different from the other provinces and territories; nearly 1 in 3 persons (32.8%) in this territory is younger than 15, by far the highest proportion in the country. In contrast, fewer than 1 in 20 people in Nunavut is 65 years and older.
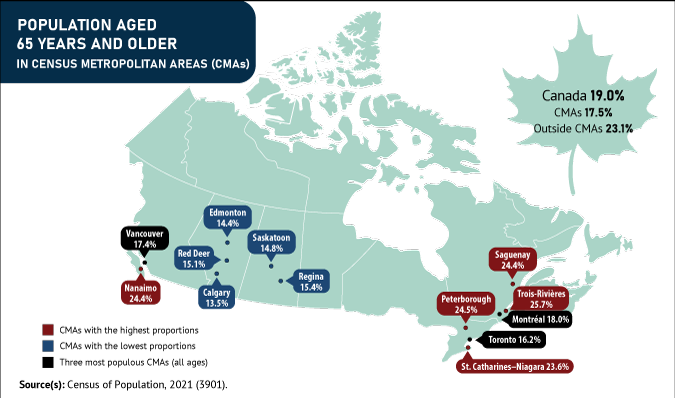
Small and large urban centres have younger populations on average; they have a lower proportion of persons 65 years and older (18.2%) than areas outside these centres (23.2%).
There are differences among large urban centres; just over one-quarter (25.7%) of the population of Trois-Rivières is 65 years and older, compared with 1 in 7 in Calgary (13.5%).
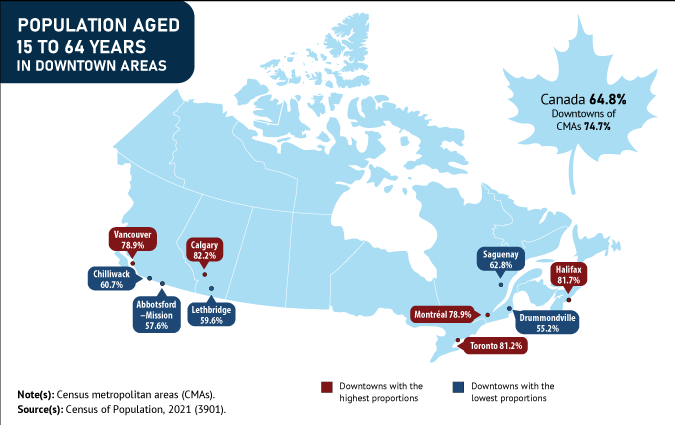
Working-age people—those aged 15 to 64—account for three-quarters of the population of downtowns, a much higher proportion than the national average (64.8%).
More than 4 in 5 people living in downtown Calgary, Halifax and Toronto are age 15 to 64.
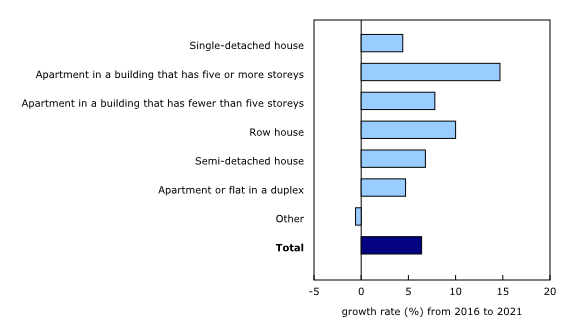
The number of apartments located in high-rise apartment buildings increased more than twice as fast (+14.7%) as the total number of private dwellings (+6.4%) from 2016 to 2021.
From 2016 to 2021, the number of apartments in high-rise apartment buildings in British Columbia (+24.8%) grew more than five times faster than the number of single-detached houses (+4.3%).
Apartments located in high-rises represent just over 3 in 10 dwellings (30.7%) in the large urban centre of Toronto, the highest percentage in the country.
Record wave of looming retirements
The Canadian workforce, mostly made up of persons aged 15 to 64, produces goods and services that drive the economy. In some regions and different sectors of the economy, labour shortages in recent years have created challenges for Canadian companies and businesses.
In Canada, the population aged 15 to 64 still represents a larger share of the total population (64.8%) than in the other G7 countries, particularly Japan (less than 60%). The proportion for the United States is very close to Canada's. For Canada and the United States, this may be a relative advantage because proportionally more people are of working age, and therefore able to produce goods and services for the total population. This also means that people who are economically more dependent, such as children younger than 15 and retirees, account for a smaller fraction of the total population.
Despite this relative advantage, Canada's working-age population has never been older. More than 1 in 5 persons (21.8%) are close to retirement age (between 55 and 64 years), an all-time high in the history of Canadian censuses. The aging of many baby boomer cohorts, the youngest of whom are between 56 and 64 years today, is accelerating population aging. There are challenges associated with an older workforce, including knowledge transfer, retaining experienced employees, and workforce renewal.
There are also more persons aged 55 to 64 than young adults aged 15 to 24, the ages at which individuals typically enter the labour market. In 2021, there were 81 persons aged 15 to 24 per 100 persons aged 55 to 64. In 1966, this ratio was very different, with more than 200 persons aged 15 to 24 per 100 persons aged 55 to 64.
Over the next decade, persons aged 55 to 64 are expected to carry less demographic weight within the working-age population. This is because the last cohorts of the large baby boom generation will have turned 65 by 2030. They will be replaced by individuals from the smaller Generation X and, as a result, the number of people nearing retirement is expected to decline over the coming years.
As the last of the baby boom cohorts turn 65 this will mean that the working age population, those age 15 to 64, will make up a smaller proportion of the overall Canadian population. Standing at 64.8% in 2021, this proportion could fall below 60% in 2051. An increase in immigration—even a large one—would not significantly curb this projected drop. A higher labour force participation rate among persons aged 50 and older could play a role in reducing the impact on the labour force.
These demographic shifts will change the face of the working-age population, which is becoming more educated and ethnoculturally diverse, given greater diversity among younger generations. In addition, young generations may have different values and expectations from those of their predecessors, such as work–life-leisure time balance, and job flexibility.
A date with demographic destiny as baby boomers accelerate population aging
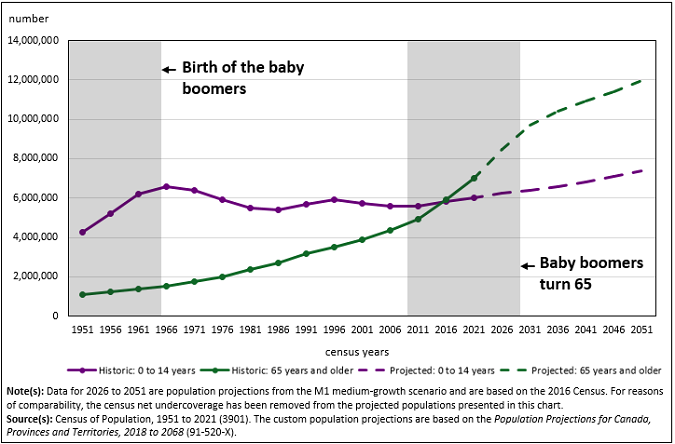
From 2016 to 2021, the number of persons aged 65 and older rose 18.3% to 7.0 million. This is the second-largest increase in 75 years, after the one observed from 2011 to 2016 (+20.0%).
Although population aging is primarily the result of low fertility and longer life expectancy, it has accelerated since the first baby boomers started turning 65 in 2011.
An article in the Census in Brief series offers a more in-depth examination of the size and growth of the different generations in Canada (A generational portrait of Canada's aging population from the 2021 Census).
The 7 million people aged 65 and older now account for nearly one-fifth of the total population (19.0%), up from 16.9% in 2016.
The number of persons aged 85 and older (+11.8%) and centenarians (those aged 100 and older) (+15.9%) have also rapidly grown since 2016. Over the next 30 years, the number of persons aged 85 and older could triple from 861,000 to 2.7 million.
An article in the Census in Brief series offers a more in-depth examination of the demographic and housing trends of the population aged 85 and older (A portrait of Canada's growing population aged 85 and older from the 2021 Census).
According to population projections, in 2051, one-quarter of the population (24.9%) could be aged 65 and older, and this age group could total almost 12 million persons.
This acceleration of the aging of the Canadian population puts additional pressure on health care and pension systems. These systems have felt other pressures as well, such as pressure brought on by the recent COVID-19 pandemic.
Population aging also offers new opportunities for all generations. For example, while proportionally more people today are older and often retired, they can also be more available to help out younger generations, including their children and grandchildren, in different ways. More older persons also choose to stay in the labour market longer nowadays than in the past.
A tale of two cohorts: growth in population aged 65 years and older outpacing children
From 2016 to 2021, the number of children younger than 15 grew six times slower than the number of persons aged 65 and older. In 2021, there were 6.0 million children, representing 16.3% of the total Canadian population.
The number of very young children (under the age of 5) fell 3.6%, from 1,899,000 in 2016 to 1,831,000 in 2021. This decline is due to a decrease in the fertility rate for Canadian women that has been observed since 2016. In 2020, the total fertility rate reached a historic low of 1.4 children per woman. A further decrease in the fertility rate is possible in the near future, as 1 in 5 Canadian women reported that they wanted to delay their plans to have children because of the COVID-19 pandemic.
The 2016 Census marked the first time that the number of Canadians aged 65 and older topped the number of children younger than 15. Since then, the gap has widened from 96,000 in 2016 to just over 1 million in 2021.
In 2021, three provinces still had more children younger than age 15 than persons aged 65 and older: Manitoba, Saskatchewan and Alberta. This is also observed in the three territories.
Population projections suggest that the gap between the number of persons aged 65 and older and children younger than 15 at the national level will continue widening in the coming years. In 2051, the number of Canadians aged 65 and older could reach almost 12.0 million, and the number of children under 15 years could total 7.4 million.
Canada has one of the youngest populations among G7 countries
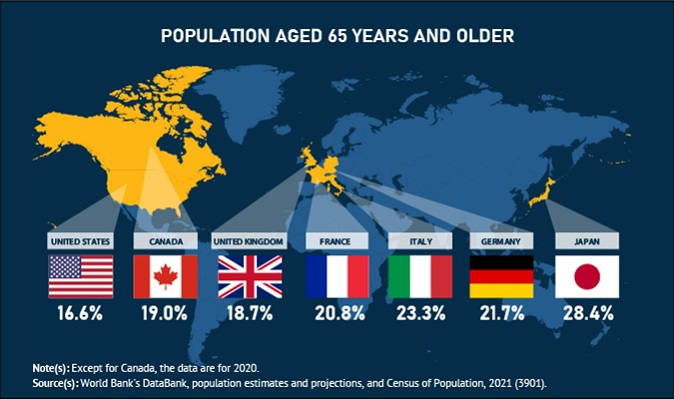
Despite population aging accelerating over the past decade, Canada has one of the youngest populations among the G7 countries. Only the United States and the United Kingdom have a lower proportion of their population aged 65 and older.
The US population is younger than Canada's mainly because of its higher fertility. This means that their population of children under 15 years of age is proportionally larger than Canada's.
The United Kingdom not only had a smaller baby boom than Canada, but it also has a slightly higher fertility rate.
Japan has the highest proportion of seniors, with nearly 3 in 10 persons aged 65 and older compared with less than 2 in 10 for Canada. Japan also has the lowest percentage of children under 15 and persons aged 15 to 64. This is a reflection of their very low fertility, the highest life expectancy in the world, and almost no immigration. Japan's population has also been declining for many years.
Like many countries in Europe, Japan is ahead of Canada in terms of population aging, and these countries have found different ways to adapt to these demographic shifts. For example, the retirement age is set to increase in Italy and in most Organisation for Economic Co-operation and Development (OECD) countries, while countries such as Sweden and Japan are reforming their health care systems to integrate in-home care. Japan, which must also deal with a decreasing population, has prioritized higher productivity, notably through automation and robotics among other things. In the coming years, Canada's level of productivity is projected to be well below the average for OECD countries.
The pandemic—little impact on population aging
The first release of 2021 Census data showed that the COVID-19 pandemic almost halted population growth in Canada in 2020. As well, the pandemic contributed to an estimated, and likely temporary, reduction in life expectancy at birth of 0.41 years in 2020.
The COVID-19 pandemic has had many repercussions on the lives of Canadians. It also slowed population growth in all age groups. Although the pandemic caused many deaths among the very old, particularly those living in collective dwellings, it has not had a significant impact on population aging for two reasons.
First, the 12,900 additional deaths due to COVID-19 among the population 65 years and older from March 1, 2020 to May 15, 2021 was significantly lower than the increase of nearly 245,000 people in this population, an increase driven by those who turned 65 in 2020.
Second, immigration fell significantly in 2020 as a result of the border restrictions imposed around the world; just under 185,000 immigrants were admitted in 2020, compared with more than 340,000 in 2019. This decline in the number of immigrants drove the share of young adults in the total population down slightly, since immigrants and non-permanent residents are often young adults in their twenties or thirties when they arrive in Canada.
According to population projections, even if immigration to Canada were to increase in the coming years or decades, even significantly, it would still not curb population aging, which is inevitable.
More persons of female sex than of male sex in the population given their longer life expectancy
In the 2021 Census, Statistics Canada not only introduced a new question on gender, it also adjusted the question on sex—used in previous censuses—to ask for information on sex at birth. These changes fill data gaps and ensure better quality in the information collected.
A Daily release from today provides a detailed profile of transgender and non-binary people living in Canada (Canada is the first country to provide census data on transgender and non-binary people).
In 2021, persons of female sex made up just over half of the population (50.7%), down 0.2 percentage points from 2016. Given the longer life expectancy of persons of female sex and population aging, they make up just over half of the total population.
The proportion of persons of female sex is highest in most of the Atlantic provinces and in Ontario (about 51%). The Atlantic provinces also have the oldest populations in the country. The proportion of persons of female sex is lowest in Nunavut (49.1%). This territory's population is also much younger than that of other provinces and territories.
Older or younger population? Increasingly, it depends on where you live
National trends mask large differences in the age structure of populations from one region to another. These differences have been widening, mainly as a result of fertility and migration trends that vary by region. Growing differences between Canada's regions pose challenges for developing national programs to serve Canadians.
For example, the Prairie provinces and the territories have younger populations, while those in the Atlantic provinces and Quebec are older.
In 2021, for the first time, British Columbia had just over 1 million persons aged 65 and older. This age group represents 20.3% of the province's population, an all-time high for provinces west of Quebec.
Of the country's four most populated provinces, Quebec has the highest proportion of people 65 years and older (20.6%, or just over 1 in 5 people).
In addition, from 2016 to 2021, population aging was faster in some provinces or territories, namely in Newfoundland and Labrador, Yukon and New Brunswick. In Newfoundland and Labrador, the proportion of persons aged 65 and older rose 4.2 percentage points to 23.6%, or almost 1 in 4 people—the highest share among the provinces and territories.
Of the four most populated provinces, Ontario's population is aging the slowest. From 2016 to 2021, its proportion of persons aged 65 and older rose by 1.8 percentage points.
Often, faster population aging is the result of lower fertility and immigration, as well as migration losses to other parts of the country.
Still more children under the age of 15 than persons age 65 and older in the Prairies
Manitoba, Saskatchewan and Alberta are the only provinces in Canada where children under 15 still outnumber people 65 years and older. This is mostly due to higher fertility in these three provinces than elsewhere in Canada, except the territories.
Alberta has the largest gap, with the proportion of children younger than 15 exceeding that of persons 65 years and older by 4.2 percentage points (19.0% versus 14.8%).
In contrast, Newfoundland and Labrador has the lowest proportion of children under the age of 15 in the country (13.4%). Its fertility rate is among the lowest in Canada.
According to population projections for Manitoba and Alberta, persons aged 65 and older are not expected to outnumber children under 15 until 2031 and until 2036 in Saskatchewan. Nearly one-fifth of the population (19.7%) in Saskatchewan is under the age of 15, the highest proportion among the provinces.
Nunavut has by far the youngest population in Canada
Nunavut stands out from all other regions in Canada with a significantly younger population and slower population aging.
Close to 1 in 3 (32.8%) persons in Nunavut is under age 15, by far the highest proportion in the country. The fertility rate in this territory is by far the highest in Canada; in 2020, it was 2.7 children per woman, compared with 1.4 for Canada as a whole. The last time Canada's fertility rate was above 2.7 children per woman was in 1966, at the end of the baby boom.
Fewer than 1 in 20 people in Nunavut are 65 years and older, in part due to a lower life expectancy than in other parts of the country. In addition, the proportion of seniors edged up 0.6 percentage points from 2016 to 2021, the lowest increase among all provinces and territories.
Children under age 15 make up 20.6% of the population of the Northwest Territories, or 1 in 5 people. This is the second-highest proportion of children in the country, behind Nunavut.
The Northwest Territories (69.4%) and Yukon (68.0%) also stood out for their high proportions of people aged 15 to 64. Many people migrate to these two territories for work.
The territories are home to many people who report an Indigenous identity, and the fertility of some Indigenous groups is significantly higher than that of the rest of the Canadian population. Life expectancy in the territories is also lower than elsewhere, notably due to different living conditions. Data on First Nations, Métis and Inuit from the 2021 Census, which will be released on September 21, 2022, will provide a portrait of Canada's Indigenous populations.
Rural population aging faster than urban population
The census provides high-quality, detailed data on the population in different regions within the provinces and territories, such as large urban centres (also called census metropolitan areas), smaller urban centres (also called census agglomerations) and all municipalities (also called census subdivisions) in the country.
Results from the 2021 Census indicate that not only do the country's small and large urban centres have higher population growth than elsewhere, but their populations are also younger.
For example, the urban population, those living in the country's small and large urban centres, has a smaller proportion of people 65 years and older (18.2%) than the rural population (23.2%).
In addition, population aging is slower in small and large urban centres. From 2016 to 2021, the proportion of people aged 65 and older rose by 1.9 percentage points in urban centres, compared with 3.1 percentage points in rural areas (those outside small and large urban centres).
Indicative of the pull of large universities and their economic vitality, small and large urban centres also have more working-age people (15 to 64 years) than rural areas (65.7% compared with 60.1%).
The population of Trois-Rivières is twice as old as Calgary's
While large urban centres have a younger population on average, there are differences between large urban centres. For example, just over one-quarter of the population of Trois-Rivières is 65 years and older (25.7%), a record among the country's large urban centres. This proportion is well above the national average (19.0%).
Trois-Rivières also has the lowest proportion of working-age people (59.8%), which can pose challenges in terms of economic activity, such as the availability of labour, and the provision of services to the population.
In contrast, of all the large urban centres in Canada, Calgary has the lowest proportion of people aged 65 and older (13.5%) and one of the highest proportions of working-age people in the country (more than 2 in 3, or 68.0%).
Of all large urban centres, the proportion of people aged 65 and older grew fastest in Saguenay (+3.8 percentage points), Trois-Rivières (+3.4 percentage points) and St. John's (+3.3 percentage points) from 2016 to 2021.
By comparison, the proportion of the population aged 65 and older grew by 1.1 percentage points in each of Kitchener–Cambridge–Waterloo, Oshawa and Chilliwack.
As another indication of the diversity of populations in large urban centres, 10 of the country's 41 large urban centres still have more children under 15 than people aged 65 and older. These centres include the seven large urban centres in Manitoba, Saskatchewan and Alberta, as well as Barrie, Oshawa, and Kitchener–Cambridge–Waterloo in Ontario.
The five large urban centres with the highest proportion of children under the age of 15 are all located in Saskatchewan or Alberta: Saskatoon (19.1%), Lethbridge (19.0%), Regina (19.0%), Edmonton (18.6%), and Calgary (18.5%).
In 2021, there were more persons aged 65 and older than children under 15 in the country's three largest urban centres — Toronto, Montréal, and Vancouver — whereas in 2016, this was the case only in Vancouver.
Vancouver (68.5%) and Toronto (68.3%) had the highest proportions of working-age people in 2021. These large urban centres welcome a large number of immigrants, most of whom are in the working-age population.
Downtowns attract younger adults
The first 2021 Census data release revealed that the downtowns of Canada's large urban centres saw strong population growth from 2016 to 2021.
Three-quarters of the population of downtowns is made up of working-age people (15 to 64 years), a proportion significantly higher than the national average (64.8%). More than 80% of the population in downtown Calgary, Halifax and Toronto are in this age group.
Younger adults aged 25 to 40 (or the Millennial Generation) make up 35.9% of the population of downtowns, compared with less than one-quarter of the total population of the country's large urban centres. An article in the Census in Brief series offers a more in-depth examination of the size and growth of the different generations in Canada (A generational portrait of Canada's aging population from the 2021 Census).
Younger adults are drawn to the downtowns of Canada's large urban centres thanks to the unique lifestyle associated with these areas, the variety of activities offered, booming economic activity, and the presence of many higher education institutions.
For example, in downtown Calgary, close to half of the population is younger adults aged 25 to 40 (49.1%), the highest among all large urban centres in the country. Three other downtowns stand out as having at least 2 in 5 (40%) persons who are age 25 to 40: Toronto, Vancouver, and Halifax.
There are proportionally fewer persons aged 65 years and older in downtowns. Their average proportion is 16.6%, which is lower than the national average (19.0%), but similar to the proportion for all large urban centres. It is particularly low in downtown Calgary, Toronto and Halifax, where fewer than 1 in 8 people are 65 years of age and older.
There are exceptions: the downtowns of Drummondville (34.9%), Lethbridge (32.1%) and Saguenay (30.0%) had the highest proportion of people aged 65 and older in 2021. These three downtowns have some of the smallest populations of large urban centres in Canada, and like most other downtowns in the country, they offer different services to residents, including health care, which can attract an older population.
The seven municipalities with the oldest populations are in British Columbia
Of Canada's 737 municipalities with 5,000 or more residents, two-thirds (495) have more persons aged 65 and older than children under age 15.
The situation varies considerably across municipalities and provinces. For example, all municipalities in Nova Scotia have more people aged 65 and older than children under 15 whereas this is the case for less than one-third of municipalities in Manitoba.
Of the municipalities with the country's oldest populations, the first seven are all located in British Columbia: Qualicum Beach (more than half of its population is 65 years and older), Osoyoos, Sidney, Parksville, Southern Gulf Islands, Nanaimo E, and Nanaimo G. These municipalities, often located on Vancouver Island, are popular destinations for seniors wishing to retire, particularly because of the more temperate climate in these places.
Two municipalities stand out for their very high proportion of children under 15 years: Mackenzie County, Alberta (36.2%), and Norway House 17, Manitoba (34.7%). Mackenzie County has a large Mennonite community, while Norway House 17 has a relatively large Indigenous population. Both of these groups have a higher fertility rate.
Some Canadian municipalities have a large working-age population (from 15 to 64 years). Such is the case for Whistler (79.8%) and Banff (78.4%), which have the highest proportions of working-age populations in Canada. These two municipalities attract young people because of the job opportunities in the recreation sector. The working-age population makes up more than 70% of the population of 11 other municipalities in the country: Metro Vancouver A, Wood Buffalo, Iqaluit, Vancouver, Yellowknife, New Westminster, Lincoln, Revelstoke, Labrador City, Fort St. John, and Waterloo.
Growth of private dwellings still outpaces population growth
The dwelling in which people live affects almost every aspect of their daily life. Factors such as population aging, increasing urbanization, and greater ethnocultural diversity as a result of sustained immigration also have a significant impact on housing demand in Canada. Housing data are vital to developing appropriate policies to help Canadians access safe, adequate and affordable housing. For example, homeownership has become a key issue for Canadians, particularly young adults, in recent years. More information on housing in Canada can be found on the Housing statistics portal.
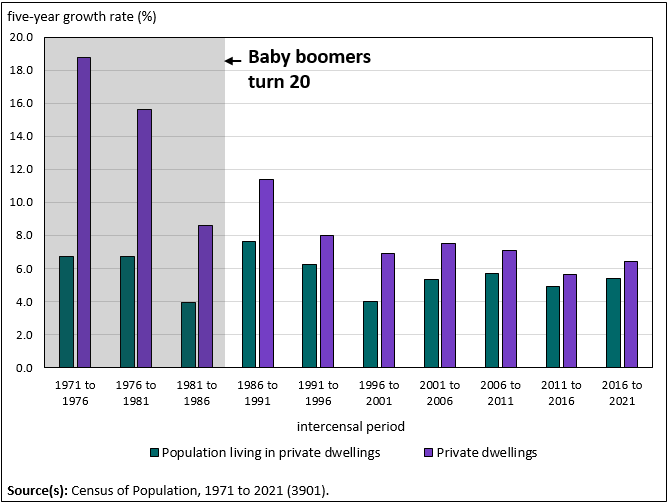
From 2016 to 2021, growth in the number of private dwellings (+6.4%) outpaced the growth of the population living in these dwellings (+5.4%). This is not new; at the national level this trend has been observed since at least the early 1950s. From the mid-1960s to the mid-1980s, the number of private dwellings grew at more than twice the rate of the population. At the time, the many baby boomer cohorts in Canada were leaving their parents' home and starting their own family.
At the regional level, the situation can be different. Population growth of some regions of the country can exceed the growth in the number of dwellings.
Despite sustained growth in the number of private dwellings for the past few decades, the real estate market across the country is feeling increasing pressure, and particularly in large urban centres where population growth is faster.
A number of factors explain the faster growth in the number of private dwellings in recent decades, including the decline in household size due to the sharp decrease in fertility since the end of the baby boom, the many baby boom cohorts moving out of their parents' home and into their own dwelling, population aging—many seniors live alone or in households without children, therefore in smaller dwellings—and the construction of smaller dwellings, especially in the country's large urban centres.
More recently, other factors have contributed to the existing pressures on the real estate market, such as foreign investment in real estate, short-term apartment rentals, and more people who own a second residence. These pressures are not felt the same way among age groups. For example, such factors affect the ability of young adults to own a home, especially those who have or want to start a family and have different housing needs (proximity to day care centres, parks and schools, as well as a larger dwelling). Young adults in the millennial generation account for a small share of all residential property owners in Canada, partly because of higher prices for properties.
The next 2021 Census data releases will provide a portrait of families and households (July 13, 2022) and of housing in Canada (September 21, 2022).
In the 2021 Census, almost 15 million private dwellings were enumerated. They were occupied by 36.3 million people.
Other Canadians (657,920 people, or 1.8% of the population) were living in a collective dwelling. Of these, 412,495 (62.7%) were living in a nursing home or seniors' residence. Given the aging of Canada's population, the number of people living in a nursing home or seniors' residence is expected to rise in the coming years. This trend will have a significant impact on the need for services for seniors and funding of these institutions.
Rapid growth in high-rise apartments
The real estate market has changed considerably over the last decade, in part due to the decline in interest rates since the recession of 2008/2009, the rise in home prices, greater demand, and an increase in the number of apartments being built.
The number of apartments in a high-rise apartment building—with five or more storeys—has risen quickly. From 2016 to 2021, it increased 14.7%, more than double the total growth in the number of private dwellings (+6.4%).
Row houses also posted strong growth from 2016 to 2021 (+10.0%).
Apartments overall accounted for 34.4% of dwellings in 2021, compared with 30.1% in 1981.
The rapid increase in the number of apartments is expected to continue in the future, and even accelerate. Apartments represented more than half of the building permits issued from 2016 to 2021. Before 2011, apartments accounted for less than 40% of building permits.
A number of factors explain this trend: population aging (seniors often live in smaller households), higher housing prices, smaller household sizes, and increasing urbanization.
Despite the rapid growth in the number of apartments, single detached houses remain the most common type of dwelling in Canada, representing 7.9 million dwellings or 52.6% of the total number of dwellings. Due to slower growth from 2016 to 2021 (+4.4%), the share of these houses among all private dwellings has decreased since 1981 (57.2%).
Very strong growth in high-rise apartments in British Columbia
British Columbia had the lowest proportion of single-detached houses in Canada in 2021 (42.4%). In 1981, this proportion was 62.4%. This decrease of 20 percentage points from 1981 to 2021 was the largest in the country.
From 2016 to 2021, the number of apartments in high-rise apartment buildings in British Columbia grew more than five times faster (+24.8%) than the number of single-detached houses (+4.3%). Housing prices in British Columbia are among the highest in the country, and an increasing number of houses have been converted into semi-detached houses or apartments, especially in the large urban centre of Vancouver.
Conversely, Newfoundland and Labrador (72.3%) and Saskatchewan (71.6%) had the highest proportions of single-detached houses.
In Nunavut, 43.1% of private dwellings in 2021 were single-detached houses. This territory faces unique housing challenges, such as many crowded dwellings, and high prices.
In Toronto, 30% of dwellings are high-rise apartments
Canada's large urban centres often have a much higher population density and higher housing prices than the rest of the country. This has a direct impact on the type of dwellings that can be found in these large centres.
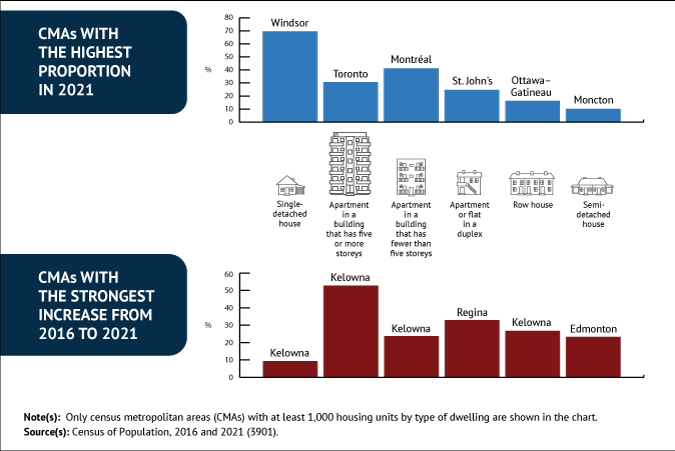
Just over 3 in 10 dwellings (30.7%) in the large urban centre of Toronto are apartments located in a high-rise apartment building (with five or more storeys). This is the highest proportion among large urban centres.
Quebec's large urban centres have more apartments in buildings with fewer than five storeys, mainly in Montréal, where these dwellings account for 41.3% of private dwellings.
Other large urban centres have a very different housing stock. In Kelowna, Chilliwack, Nanaimo and Kamloops, four fast-growing large urban centres, apartments in buildings with five or more storeys represent less than 3% of all occupied dwellings. Ottawa–Gatineau (16.3%) stands out for its proportion of row houses, which is more than double the proportion for all large urban centres (7.8%). In Moncton, just over 1 in 10 private dwellings (10.2%) is a semi-detached house, compared with 5.4% in all large urban centres.
In addition, growth in housing stock varies from one large urban centre to another. Generally speaking, growth in the number of private dwellings is closely linked to population growth. From 2016 to 2021, the number of single-detached houses rose almost 10% in Kelowna, a high among large urban centres, while the number of apartments in a high-rise building was up by 52.8%. The large urban centre of Kelowna also posted the strongest population growth from 2016 to 2021.
From 2016 to 2021, the number of apartments in a building with fewer than five storeys rose by more than 20% in three large urban centres: Kelowna (23.7%), Moncton (21.4%) and Fredericton (20.3%).
In Drummondville, the number of apartments in a high-rise building doubled to almost 500 housing units from 2016 to 2021.
Housing data from the 2021 Census, to be published on September 21, 2022, will provide a more detailed picture of the housing landscape in Canada.
Looking ahead: Telling the stories of Canadians
The 2021 Census data to be released in the coming months will help to complete the portrait of the Canadian population.
The next data releases for the 2021 Census of Population on July 13, 2022 will feature families and the income of Canadians.
Governments, businesses, communities and Canadians rely on census data to make informed decisions in areas such as immigration policies, economic development, social programs, urban planning, community well-being, and to decide where to live.
Note to readers
Canadians are invited to download the StatsCAN app to view the census results.
Definitions, concepts and geography
The population growth rates presented in this document are calculating by the difference in population size between two dates (between two censuses, for example), then dividing that difference by the population of the earlier date. Rates are expressed as a percentage.
All data and findings presented in this document are based on the 2021 geographic boundaries.
According to the 2021 Census geographic boundaries, Canada now has 41 census metropolitan areas (CMAs) and 111 census agglomerations (CAs). Readers can consult the CMA and CA reference maps.
Canada's six new CMAs are Fredericton, New Brunswick; Drummondville, Quebec; Red Deer, Alberta; Kamloops, British Columbia; Chilliwack, British Columbia; and, Nanaimo, British Columbia.
In addition, the Ottawa–Gatineau CMA was expanded to include the CAs of Arnprior and Carleton Place. Similarly, the Windsor CMA was expanded to include the Leamington CA.
For detailed definitions of CMAs, please refer to the Census Dictionary.
2021 Census of Population products and releases
Today, Statistics Canada is releasing the second results from the 2021 Census of Population.
Several 2021 Census products are also available today on the 2021 Census Program web module. This web module has been designed to provide easy access to census data, free of charge.
Analytical products include two articles in The Daily and two articles in the Census in Brief series.
Data products include the age and type of dwelling, as well as sex at birth and gender results for a wide range of standard geographic areas, available through the Census Profile and data tables.
Focus on Geography provides data and highlights on key topics found in this Daily release and in the Census in Brief articles at various levels of geography.
Reference materials are designed to help users make the most of census data. They include the Guide to the Census of Population, 2021, the Dictionary, Census of Population, 2021, and the 2021 Census of Population questionnaires. Both the Dictionary and the Guide are updated with additional information throughout the release cycle. The Type of Dwelling Reference Guide, and Age, Sex at Birth and Gender Reference Guide are also available.
Geography-related 2021 Census Program products and services can be found under Geography. This includes GeoSearch, an interactive mapping tool, and thematic maps, which show data for various standard geographic areas, along with the Focus on Geography and Census Program Data Viewer, which are data visualization tools.
Videos on census concepts can be found in the Census learning centre.
The Age Pyramids include the Comparison Age and Gender Pyramid (2021) which allows users to compare the age and gender structure of the population at three different levels of geography, and the Historical Age and Sex at Birth Pyramid (1851 to 2043) which shows the age and sex at birth structure of the population for Canada, the provinces and territories.
Over the coming months, Statistics Canada will continue to release results from the 2021 Census of Population, and provide an even more comprehensive picture of the Canadian population. Please see the 2021 Census release schedule to find out when data and analysis on the different topics will be released throughout 2022.
Contact information
For more information, or to enquire about the concepts, methods or data quality of this release, contact us (toll-free 1-800-263-1136; 514-283-8300; infostats@statcan.gc.ca) or Media Relations (statcan.mediahotline-ligneinfomedias.statcan@statcan.gc.ca).
- Date modified:


