
Insights on Canadian Society
Response mobility to Indigenous identification questions in Canada, 2016 to 2021 
Text begins
Acknowledgment
This study was funded by Indigenous Services Canada.
Overview of the study
Response mobility in the Indigenous population of Canada refers to responses changing between Indigenous and non-Indigenous identity categories from one census cycle to the next. Using linked data from the 2016 Census of Population and the 2021 Census of Population, this study builds upon previous research to analyze how response mobility affected the size and composition of the Indigenous identity population from 2016 to 2021.
- It is estimated that response mobility increased the Indigenous identity population by 100,150 people, corresponding to roughly two-thirds (64.7%) of growth in the Indigenous identity population, from 2016 to 2021.
- Métis and First Nations people without Registered or Treaty Indian status made up 88.2% of people who left the Indigenous identity population from 2016 to 2021 and 86.5% of those who joined the Indigenous identity population in 2021.
- Response mobility varied by province or territory, with a reduction in the size of the Métis population in Quebec, New Brunswick and Nova Scotia. However, response mobility led to growth in the First Nations population without Registered or Treaty Indian status in these same provinces.
Introduction
From 2016 to 2021, the Indigenous population grew at a faster pace (+9.4%) than the non-Indigenous population (+5.3%).Note 1 While higher birth rates among Indigenous people have played a role in the relatively high growth rates over time,Note 2 this factor alone cannot account for the entire difference. Research shows that a non-demographic factor, response mobility,Note 3 plays an important role in the growth of the Indigenous populationNote 4 and impacts population projections.Note 5 In this context, response mobility refers to instances where a person’s responses to questions related to Indigenous identity change over time (e.g., changing one’s Indigenous identity response from non-Indigenous to Métis). This phenomenon has been observed in other countries—including the United States,Note 6 New ZealandNote 7 and Australia.Note 8
Social factors, legislative changes and court decisions may influence rates of response mobility because Indigenous identification in Canada involves self-identification and legal status. Research has suggested that factors contributing to response mobility include mixed parentage,Note 9 changes in the way the Indigenous identity question is asked, respondents’ perception of the reason the question is being asked, experiences of racism and discrimination, and public perception or media portrayal of Indigenous Peoples.Note 10
Since the late 2010s, high-profile examples of fraudulent claims to Indigeneity in Canada have influenced discussions on Indigenous identity, the limitations of self-identification and the importance of community recognition.Note 11 The phenomenon of response mobility should not be overgeneralized as fraudulent claims. Because of the impacts of colonization, there are many cases where individuals were deprived of knowledge of their Indigeneity through forced removal from family and community or shamed into denying their Indigenous identity.Note 12
Understanding the composition and growth of Indigenous populations is important for service providers and governments of all levels to better target programs for Indigenous Peoples. However, population changes attributable to response mobility have the potential to impact socioeconomic and demographic measures of the Indigenous population, depending on whether those who change responses are different from those who consistently respond as Indigenous. These changes may make it difficult to measure progress in eliminating disparities between Indigenous and non-Indigenous populations because it may not be clear whether changes reflect shifting responses or actual progress. Therefore, quantifying these impacts can help better understand whether socioeconomic gaps are truly closing.
Building on previous research, this study uses linked data from the 2016 and 2021 Census of Population cycles to examine the number and proportion of people whose responses changed between Indigenous and non-Indigenous identities, as well as between different Indigenous identity groups, from 2016 to 2021. It also looks at the impacts of these changes and how they varied by province or territory.
Definitions and concepts
This report uses established termsNote 13 to describe response changes:
“Indigenous leavers” refers to those shifting from an Indigenous to a non-Indigenous identity.
“Indigenous joiners” refers to those shifting from a non-Indigenous to an Indigenous identity.
“Stayers” refers to those with consistent responses.
The same concepts also apply to specific Indigenous identities.Note 14 For example, someone identifying as Métis in 2016 and as non-Indigenous in 2021 is both a Métis leaver and a non-Indigenous joiner. Switching between Indigenous groups qualifies as an Indigenous stayer.
These categories reflect self-reported census responses and may not match official registries.
The majority of the Indigenous population in 2016 responded as Indigenous in 2021
Around four-fifths (81.9%, or 1,233,350 people) of the 2016 Indigenous population also responded as Indigenous in 2021 (i.e., they were stayers), while the remaining one-fifth (18.1%, or 272,300 people) responded as non-Indigenous in 2021 (i.e., they were leavers). Consistent with prior research, response mobility was more prevalent among First Nations people without Registered or Treaty Indian status (referred to as “non-Status First Nations people” henceforth) and Métis than First Nations people with Registered or Treaty Indian status (referred to as “Status First Nations people” henceforth) and Inuit.Note 15 Most Indigenous leavers who responded as non-Indigenous in 2021 responded as either Métis (149,150 people) or non-Status First Nations people (91,100 people) in 2016. These two groups comprised 88.2% (240,250 people) of all Indigenous leavers who joined the non-Indigenous population in 2021 (Table 1).
| Identity group, 2016 Census of Population | Identity group, 2021 Census of Population | |||||||
|---|---|---|---|---|---|---|---|---|
| First Nations people with Registered or Treaty Indian status | First Nations people without Registered or Treaty Indian status | Métis | Inuit | Multiple and other Indigenous identities | Non-Indigenous | Outflow (leavers) | Total (excluding leavers) | |
| number | ||||||||
| Notes: Percentages were rounded based on unweighted denominators. For smaller unweighted denominators (4,999 or less), only whole percentages can be published. All counts were rounded to the nearest 50. Counts and percentages may not add up to totals because of rounding.
Sources: Statistics Canada, 2016 Census of Population and 2021 Census of Population integration. |
||||||||
| First Nations people with Registered or Treaty Indian status | 584,150 | 15,200 | 9,050 | 900 | 10,900 | 11,800 | 47,850 | 632,000 |
| First Nations people without Registered or Treaty Indian status | 25,550 | 77,650 | 18,300 | 350 | 3,850 | 91,100 | 139,150 | 216,800 |
| Métis | 16,700 | 23,800 | 355,900 | 1,550 | 10,300 | 149,150 | 201,500 | 557,400 |
| Inuit | 500 | 550 | 600 | 52,800 | 850 | 3,650 | 6,100 | 58,950 |
| Multiple and other Indigenous identities | 7,250 | 3,500 | 7,550 | 250 | 5,400 | 16,550 | 35,150 | 40,550 |
| Non-Indigenous | 20,200 | 134,600 | 187,600 | 4,700 | 25,400 | 30,866,850 | 372,450 | 31,239,300 |
| percent | ||||||||
| First Nations people with Registered or Treaty Indian status | 92.4 | 2.4 | 1.4 | 0.1 | 1.7 | 1.9 | 7.6 | 100 |
| First Nations people without Registered or Treaty Indian status | 11.8 | 35.8 | 8.4 | 0.2 | 1.8 | 42.0 | 64.2 | 100 |
| Métis | 3.0 | 4.3 | 63.9 | 0.3 | 1.8 | 26.8 | 36.1 | 100 |
| Inuit | 0.8 | 0.9 | 1.0 | 89.6 | 1.4 | 6.2 | 10.4 | 100 |
| Multiple and other Indigenous identities | 18 | 9 | 19 | 1 | 13 | 41 | 87 | 100 |
| Non-Indigenous | 0.1 | 0.4 | 0.6 | 0.0 | 0.1 | 98.8 | 1.2 | 100 |
Leavers made up different proportions of each Indigenous identity group in 2016. While almost two-thirds (64.2%) of those who responded as non-Status First Nations people in 2016 left this population in 2021, the proportion was lower among Métis (36.1%) and notably lower among Inuit (10.4%) and Status First Nations people (7.6%).
When considering leavers of specific Indigenous identities, the largest group of leavers joined the non-Indigenous population (Figure 1). However, for Status First Nations people, most leavers went on to join another Indigenous identity group, with the largest proportion joining non-Status First Nations people.
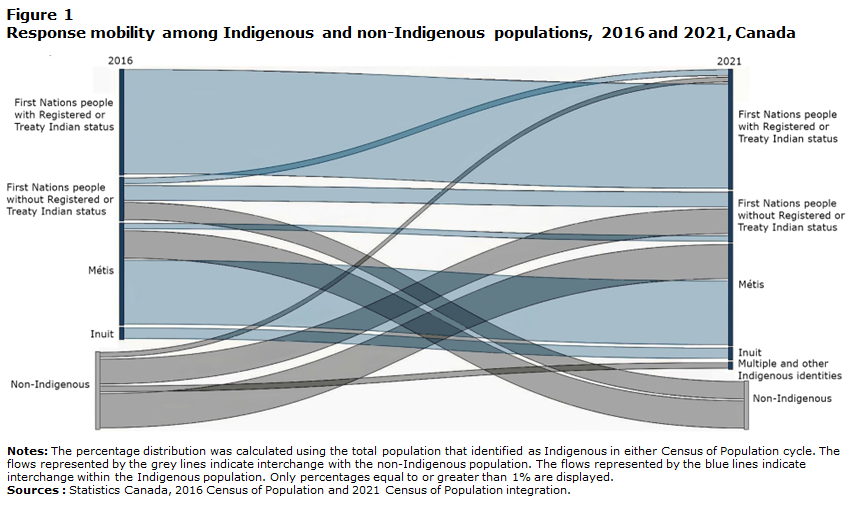
Description for Figure 1
| 2016 | 2021 | |||||||||||
|---|---|---|---|---|---|---|---|---|---|---|---|---|
| First Nations people with Registered or Treaty Indian status | First Nations people with Registered or Treaty Indian status | Métis | Inuit | Multiple and other Indigenous identities | Non-Indigenous | |||||||
| number | percent | number | percent | number | percent | number | percent | number | percent | number | percent | |
Sources: Statistics Canada, 2016 Census of Population and 2021 Census of Population integration. |
||||||||||||
| First Nations people with Registered or Treaty Indian status | 584,150 | 31.1 | 15,200 | 0.8 | 9,050 | 0.5 | 900 | 0.0 | 10,900 | 0.6 | 11,800 | 0.6 |
| First Nations people without Registered or Treaty Indian status | 25,550 | 1.4 | 77,650 | 4.1 | 18,300 | 1.0 | 350 | 0.0 | 3,850 | 0.2 | 91,100 | 4.9 |
| Métis | 16,700 | 0.9 | 23,800 | 1.3 | 355,900 | 19.0 | 1,550 | 0.1 | 10,300 | 0.5 | 149,150 | 7.9 |
| Inuit | 500 | 0.0 | 550 | 0.0 | 600 | 0.0 | 52,800 | 2.8 | 850 | 0.0 | 3,650 | 0.2 |
| Multiple and other Indigenous identities | 7,250 | 0.4 | 3,500 | 0.2 | 7,550 | 0.4 | 250 | 0.0 | 5,400 | 0.3 | 16,550 | 0.9 |
| Non-Indigenous | 20,200 | 1.1 | 134,600 | 7.2 | 187,600 | 10.0 | 4,700 | 0.3 | 25,400 | 1.4 | ... not applicable | ... not applicable |
Compared with those who left the Indigenous population in 2021, a greater number of individuals joined
Of the Indigenous population in 2021, about three-quarters (76.8%, or 1,233,350 people) were stayers, having also responded as Indigenous in 2016. Almost one-quarter of the 2021 Indigenous population (23.2%, or 372,450 people) were joiners who had responded as non-Indigenous in 2016. Indigenous joiners primarily joined the Métis and non-Status First Nations populations. Together, these two groups of joiners accounted for 86.5% of Indigenous joiners, or 322,200 people (Table 2).
| Identity group, 2021 Census of Population | Identity group, 2016 Census of Population | |||||||
|---|---|---|---|---|---|---|---|---|
| First Nations people with Registered or Treaty Indian status | First Nations people without Registered or Treaty Indian status | Métis | Inuit | Multiple and other Indigenous identities | Non-Indigenous | Inflow (joiners) | Total (excluding joiners) | |
| number | ||||||||
| Notes: Percentages were rounded based on unweighted denominators. For smaller unweighted denominators (4,999 or less), only whole percentages can be published. All counts were rounded to the nearest 50. Counts and percentages may not add up to totals because of rounding.
Sources: Statistics Canada, 2016 Census of Population and 2021 Census of Population integration. |
||||||||
| First Nations people with Registered or Treaty Indian status | 584,150 | 25,550 | 16,700 | 500 | 7,250 | 20,200 | 70,150 | 654,300 |
| First Nations people without Registered or Treaty Indian status | 15,200 | 77,650 | 23,800 | 550 | 3,500 | 134,600 | 177,600 | 255,250 |
| Métis | 9,050 | 18,300 | 355,900 | 600 | 7,550 | 187,600 | 223,100 | 579,000 |
| Inuit | 900 | 350 | 1,550 | 52,800 | 250 | 4,700 | 7,700 | 60,500 |
| Multiple and other Indigenous identities | 10,900 | 3,850 | 10,300 | 850 | 5,400 | 25,400 | 51,300 | 56,700 |
| Non-Indigenous | 11,800 | 91,100 | 149,150 | 3,650 | 16,550 | 30,866,850 | 272,300 | 31,139,150 |
| percent | ||||||||
| First Nations people with Registered or Treaty Indian status | 89.3 | 3.9 | 2.6 | 0.1 | 1.1 | 3.1 | 10.7 | 100 |
| First Nations people without Registered or Treaty Indian status | 5.9 | 30.4 | 9.3 | 0.2 | 1.4 | 52.7 | 69.6 | 100 |
| Métis | 1.6 | 3.2 | 61.5 | 0.1 | 1.3 | 32.4 | 38.5 | 100 |
| Inuit | 1.5 | 0.5 | 2.5 | 87.3 | 0.4 | 7.7 | 12.7 | 100 |
| Multiple and other Indigenous identities | 19.2 | 6.8 | 18.2 | 1.5 | 9.5 | 44.8 | 90.5 | 100 |
| Non-Indigenous | 0.0 | 0.3 | 0.5 | 0.0 | 0.1 | 99.1 | 0.9 | 100 |
When looking at specific Indigenous identity groups, the group from which the largest proportion joined was the non-Indigenous population in 2016. The exception was for Status First Nations people, where the largest proportion came from non-Status First Nations people (Figure 1).
Response mobility contributed to the growth of the Indigenous population from 2016 to 2021
There were more Indigenous joiners than leavers from 2016 to 2021, so response mobility resulted in an increase in the Indigenous population of about 100,150 people (+6.7%) (Table 3). The estimated growth of the Indigenous population based on the 2016 and 2021 Census of Population cycles was 154,900 people (+9.4%). Thus, response mobility represented approximately two-thirds (64.7%) of the increase in the Indigenous population from 2016 to 2021.
| Province or territory | First Nations people with Registered or Treaty Indian status | First Nations people without Registered or Treaty Indian status | Métis | Inuit | Multiple and other Indigenous identities | Total |
|---|---|---|---|---|---|---|
| number | ||||||
|
X suppressed to meet the confidentiality requirements of the Statistics Act Notes: Percentages were rounded based on unweighted denominators. For smaller unweighted denominators (4,999 or less), only whole percentages can be published. All counts were rounded to the nearest 50. Counts and percentages may not add up to totals because of rounding. Sources: Statistics Canada, 2016 Census of Population and 2021 Census of Population integration. |
||||||
| Newfoundland and Labrador | 2,500 | -1,800 | -250 | 750 | 200 | 1,400 |
| Prince Edward Island | X | 150 | 50 | X | X | 250 |
| Nova Scotia | -500 | 1,300 | -3,100 | 50 | 900 | -1,300 |
| New Brunswick | 300 | 1,900 | -1,150 | X | 300 | 1,400 |
| Quebec | 300 | 24,800 | -9,150 | 500 | 3,250 | 19,700 |
| Ontario | 7,200 | 8,300 | 11,250 | 650 | 3,000 | 30,400 |
| Manitoba | 1,450 | 250 | 5,850 | X | 1,750 | 9,350 |
| Saskatchewan | 2,950 | -250 | 3,150 | X | 900 | 6,700 |
| Alberta | 4,300 | 1,800 | 11,500 | -400 | 2,450 | 19,600 |
| British Columbia | 4,050 | 1,950 | 3,550 | 250 | 2,750 | 12,550 |
| Yukon | -50 | X | 100 | X | 50 | 150 |
| Northwest Territories | -100 | 50 | -250 | 50 | 400 | 150 |
| Nunavut | X | 50 | 0 | -300 | 100 | -200 |
| Canada | 22,350 | 38,450 | 21,650 | 1,600 | 16,150 | 100,150 |
| percent | ||||||
| Newfoundland and Labrador | 15 | -16 | -4 | 12 | 7 | 3.2 |
| Prince Edward Island | X | 19 | 8 | X | X | 10 |
| Nova Scotia | -3.4 | 12 | -14 | 6 | 60 | -2.7 |
| New Brunswick | 2 | 39 | -11 | X | 22 | 4.9 |
| Quebec | 0.5 | 94 | -14 | 3.8 | 51 | 11.9 |
| Ontario | 5.5 | 11 | 9.6 | 19 | 25 | 8.9 |
| Manitoba | 1.4 | 3 | 7 | X | 67 | 4.8 |
| Saskatchewan | 3.4 | -4 | 6 | X | 44 | 4.5 |
| Alberta | 4.6 | 8 | 10.8 | -16 | 54 | 8.5 |
| British Columbia | 3.8 | 4 | 4 | 24 | 40 | 5.1 |
| Yukon | -1 | X | 9 | X | 33 | 2 |
| Northwest Territories | -0.8 | 7 | -9 | 1 | 267 | 1 |
| Nunavut | X | 100 | 0 | -1.1 | 200 | -1 |
| Canada | 3.5 | 17.7 | 3.9 | 2.7 | 40 | 6.7 |
The non-Status First Nations population increased the most because of response mobility (+38,450 people), followed by the Status First Nations (+22,350) and Métis (+21,650) populations. Previous studies of response mobility reported the greatest population growth among Métis.Note 16 While Métis had the highest number of joiners from the non-Indigenous population from 2016 to 2021, there was also a similarly high number of Métis leavers. As a result, response mobility contributed to less population increase among Métis than among non-Status First Nations people and Status First Nations people.
In Quebec, Nova Scotia and New Brunswick, response mobility notably reduced the size of the Métis population and increased the size of the non-Status First Nations population
On the whole, there were greater proportions of both Indigenous joiners and leavers in eastern Canada, compared with western Canada. For instance, the proportion of leavers from the 2016 Indigenous population ranged from 22.0% in Newfoundland and Labrador to 36.5% in Quebec, and from 6.5% in Saskatchewan to 14.7% in British Columbia. At the same time, the proportion of joiners to the 2021 Indigenous population ranged from 24.4% in Newfoundland and Labrador to 43.1% in Quebec, and from 10.6% in Saskatchewan to 20.9% in Alberta.
The impacts of response mobility varied across the provinces and territories (Table 3). The largest numeric Indigenous population increases attributable to response mobility occurred in Ontario, Quebec and Alberta, with Quebec recording the largest proportional growth. Quebec also had the largest single population increase for non-Status First Nations people. Response mobility contributed to increased Métis populations in Ontario and the western provinces, but notably led to smaller Métis populations in Quebec, New Brunswick and Nova Scotia. These findings are contrary to previous studies,Note 17 which showed that response mobility contributed to much of the increase of Métis populations in Quebec and Atlantic Canada during earlier periods. It is possible that declines among Métis and the growth of the non-Status First Nations population from 2016 to 2021 in these areas are related to a changing understanding of the term Métis—moving away from simply meaning individuals of mixed ancestry—but more research is needed on this topic.
Response mobility continues to have small but meaningful impacts on estimates of demographic and socioeconomic characteristics
Response mobility inevitably impacts demographic and socioeconomic estimates and trends across census cycles, but these impacts were generally small when considering the total Indigenous population from 2016 to 2021.
For instance, small increases in educational attainment estimates were the result of response mobility. More specifically, the proportion of Indigenous people aged 15 and older with no certificate, diploma or degree declined 1.7 percentage points from 2016 to 2021. However, when considering only Indigenous stayers, the decline was 1.0 percentage point. This suggests that the change was attributable not wholly to Indigenous people obtaining a certificate, diploma or degree from 2016 to 2021, but also partly to people with a certificate, diploma or degree changing their responses from non-Indigenous to Indigenous. Thus, the overall impact of response mobility represented around one-third of the total change from 2016 to 2021.
Response mobility also impacted the proportion of Indigenous people with an Indigenous language as their mother tongue. From 2016 to 2021, there was a decline of 1.1 percentage points in the proportion of the total Indigenous population with an Indigenous language as their mother tongue, but the decrease was 0.5 percentage points when only considering Indigenous stayers. Regarding specific Indigenous identities, there were some even more notable changes in mother tongue from 2016 to 2021. For instance, the proportion of non-Status First Nations people who reported French as their sole mother tongue increased 7.5 percentage points from 2016 to 2021, compared with a decline of 0.6 percentage points among non-Status First Nations stayers. This could be partly attributable to the large population increases as a result of response mobility recorded in Quebec and New Brunswick.
Response mobility also has implications for understanding trends in physical mobility. Results show that there was a 3.8 percentage point decline in the proportion of Inuit living in Inuit Nunangat, the homeland of Inuit in Canada, from 2016 to 2021. However, this decrease was largely not attributable to Inuit leaving Inuit Nunangat, because the proportion of Inuit in Inuit Nunangat was relatively unchanged (0.9 percentage point decline) over the same period among Inuit stayers. This highlights the importance of considering response mobility when examining migration trends, because a simple examination of proportions over time could lead to an overestimation of the migration of Indigenous people from their communities.
Overall, response mobility has real impacts on the demographic and socioeconomic trends of Indigenous Peoples, and while generally small, these impacts are important for understanding progress and change in Indigenous populations.
Conclusion
This study examined and updated estimates of response mobility by Indigenous identity group. It showed that response mobility accounted for most of the growth in Indigenous population estimates, despite the slower relative population growth from 2016 to 2021 compared with previous census cycles. While the largest flows of response mobility were to and from the Métis population, overall increases were greater among non-Status First Nations people and Status First Nations people.
There were distinct regional trends, with response mobility leading to decreasing population estimates for Métis in Quebec, New Brunswick and Nova Scotia—the opposite of what was observed in previous studies.
Further, this study showed that response mobility is an important consideration when examining socioeconomic and demographic trends such as physical migration, because it may impact trends in educational attainment, Indigenous languages and the proportion of Inuit living in Inuit Nunangat.
It is difficult to know whether current transition trends to and from the Indigenous population indicate that they will continue. When reporting results, care must be taken to not overgeneralize the phenomenon, particularly regarding how response mobility will influence Indigenous population projections into the future.
Data sources, methods and limitations
This study used an integrated dataset of the 2016 and 2021 long-form census questionnaires. It includes only individuals who were enumerated in both questionnaires. Thus, those who were not yet born in 2016, those who had died before 2021, those who were out of the country in either year and those who lived in reserve census subdivisions that were incompletely enumerated in 2016 or 2021 are absent from this dataset. Additionally, only those in private households received the long-form census questionnaire. Those in collective dwellings, such as long-term care homes and correctional facilities, and those who were unhoused at the time of census collection are not included.
This analysis incorporates survey weights optimized to the Indigenous population, which were specifically created to study Indigenous populations and populations residing on reserve. While using these weights limits comparability to previous studies, they should yield more accurate estimates for Indigenous populations overall and people living on reserve.
To analyze response changes, cross-tabulations by Indigenous group were created for the census period from 2016 to 2021. Net response mobility was calculated by subtracting the estimated number of leavers from that of joiners. This was turned into a net response mobility rate by expressing it as a percentage of the 2016 Indigenous population in the integrated dataset.
All published counts were rounded to the nearest 50. Percentages were calculated using unrounded and weighted counts where denominators were 500 or more and rounded and weighted counts otherwise. Percentages were rounded based on unweighted denominators. For smaller unweighted denominators (4,999 or less), only whole percentages were publishable.
References
Australian Bureau of Statistics. 2018. “Census of Population and Housing: Understanding the Increase in Aboriginal and Torres Strait Islander Counts.” Australian Bureau of Statistics. Catalogue no. 2077.0.
Australian Bureau of Statistics. 2021. “Understanding change in counts of Aboriginal and Torres Strait Islander Australians: Census.” Australian Bureau of Statistics website, accessed June 30, 2023.
Boyd, Monica and Doug Norris. 2001. “Who are the ‘Canadians’? Changing census responses, 1986-1996.” Canadian Ethnic Studies Journal. Vol. 33, no. 1, pp. 1-27.
Canada Research Coordinating Committee. 2024. “What We Heard: A Report from the Three Federal Research Funding Agencies’ Ad Hoc Working Group on Indigenous Citizenship and Membership.” Catalogue no. CR22-126/2024E-PDF.
Caron-Malenfant, Éric, Simon Coulombe, Eric Guimond, Chantal Grondin and André Lebel. 2014. “Ethnic Mobility of Aboriginal Peoples in Canada Between the 2001 and 2006 Censuses.” Population. Vol. 69, no. 1, pp. 29-54.
First Nations University of Canada and National Indigenous University Senior Leaders’ Association. 2022. Indigenous Voices on Indigenous Identity: What Was Heard Report.
Guimond, Éric. 1999. “Ethnic Mobility and the Demographic Growth of Canada’s Aboriginal Populations from 1986 to 1996.” Report on the Demographic Situation in Canada 1998-1999. Statistics Canada Catalogue no. 91-209-XIE.
Leroux, D. 2019. Distorted descent: White claims to Indigenous identity. University of Manitoba Press.
Liebler, Carolyn A. and Timothy Ortyl. 2014. “More Than One Million New American Indians in 2000: Who Are They?” Demography. Vol. 51, no. 3, pp. 1101-1130.
Liebler, Carolyn A., Renuka Bhaskar and Sonya R. Porter. 2016. “Joining, leaving, and staying in the American Indian/Alaska Native race category between 2000 and 2010.” Demography. Vol. 53, no. 2, pp. 507-540.
O’Donnell, Vivian and Russell LaPointe. 2019. “Response mobility and the growth of the Aboriginal identity population, 2006-2011 and 2011-2016.” National Household Survey: Aboriginal Peoples. Statistics Canada Catalogue no. 99-011-X.
Shalley, Fiona, Kalinda Griffiths and Tom Wilson. 2023. “No Longer Indigenous.” Population Research and Policy Review. Vol. 42, p. 53.
Smith, Trevor and Scott McLeish. 2019. “Technical report on changes in response related to the census ethnic origin question: Focus on Jewish origins, 2016 Census integrated with 2011 National Household Survey.” Ethnicity, Language and Immigration Thematic Series. Statistics Canada Catalogue no. 89-657-X2019009.
Statistics Canada. 2021. “Projections of the Indigenous populations and households in Canada, 2016 to 2041: Overview of data sources, methods, assumptions and scenarios.” Demosim: Reports and Analytical Studies. Statistics Canada Catalogue no. 17-20-0001.
Statistics Canada. 2022 (September 22). “Indigenous population continues to grow and is much younger than the non-Indigenous population, although the pace of growth has slowed.” The Daily.
Statistics New Zealand. 2024. “Māori population estimates: At 30 June 2024.” Stats NZ Information Releases. ISSN 2382-2295.
- Date modified: