
Ethnicity, Language and Immigration Thematic Series
Technical report on changes in response related to the census ethnic origin question: Focus on Jewish origins, 2016 Census integrated with 2011 National Household Survey

Archived Content
Information identified as archived is provided for reference, research or recordkeeping purposes. It is not subject to the Government of Canada Web Standards and has not been altered or updated since it was archived. Please "contact us" to request a format other than those available.
by Trevor Smith and Scott McLeish
Skip to text
Text begins
Start of text boxExecutive Summary
Responses to the ethnic origin question on the census are a reflection of respondents’ perceptions of their background. As such, many factors can influence changes in response over time, including the contemporary social environment, the respondent’s knowledge of family history as well as their understanding of and views on the topic.
According to the 2016 Census, 143,665 individuals living in Canada reported Jewish as an ethnic origin (single and multiple responses combined). This number was 53.6% lower than the 309,650 persons reporting Jewish ethnic origins on the 2011 National Household Survey (NHS). This followed a steady, but previously less precipitous, decline in those reporting Jewish origins since the 1991 Census.
By examining changes in individuals’ responses over time, this study demonstrates that this overall decline was not the result of demographic changes but instead due to respondents being less likely to report Jewish origins from census to census, especially between 2011 and 2016.
This study finds evidence that examples on the questionnaire can influence results by providing a boost to those origins which are included among the examples, compared with those which are not. Since the 1996 Census, the methodology for selecting examples of ethnic origins has been based on using categories that are among the most frequent responses to the previous census. Following the same methodology, “Jewish” was removed from the list of examples because it was no longer among the most frequent responses in 2011. This removal was a leading factor in this shift in respondent behaviour in reporting Jewish as an origin in 2016. This report will demonstrate that, in general, examples and changes to examples, influence responses. This pattern, although more pronounced for Jewish origins results, is not unique to the Jewish example. Adding ‘Canadian’ as an example in 1996 had a larger effect on Canadian origins responses.
It is of course difficult to determine a high-quality estimate of Jewish origins had the examples remained the same in 2016. However, assuming past response behavioural patterns, leaving the example included in 2016 could have led to a total Jewish ethnic origin estimate in the range of 270,000 to 298,000. It should be noted, however, that the 2016 Census estimate of 143,665 is accurate based on the information provided by respondents.
Understanding that the presence or exclusion of a subset of examples can influence responses, an ideal questionnaire would either have no examples or would have an exhaustive list of all possible origins. However, limitations of space on paper questionnaires has restricted the number of examples that could be used in the past, which is why a methodology for example selection was established.
Looking forward, Statistics Canada is working closely with stakeholders to explore alternative approaches to the collection of data on ethnic origin, leveraging the increasing use of electronic collection.
Acknowledgements
Following the release of the 2016 Census results, Statistics Canada established an expert group to provide input and insights on the ethnic origin results related to Jewish origins. To that end, we would like to thank Robert Brym (University of Toronto), Gustave Goldmann (University of Ottawa), Steve McDonald (Centre for Israel and Jewish Affairs), Charles Shahar (Jewish Community Foundation of Montreal), and Morton Weinfeld (McGill University) for participating in discussions and providing input which helped to guide the content of the report.
We would also like to mention the special contribution of the following people: Jarod Dobson and Henri Amyotte of the Social and Aboriginal Statistics Division (SASD) who contributed to data analysis and editing the report; and Heather Dryburgh (Census Subject Matter, Social and Demographic Statistics Branch), Eric Caron-Malenfant (SASD), Dominic Grenier (Social Survey Methods Division), and Laurent Martel (Demography Division) for reviewing the report.
1. Introduction
According to the 2016 Census, 143,665 individuals living in Canada reported Jewish as an ethnic origin (single and multiple responses combined). This number was 53.6% lower than the 309,650 persons reporting Jewish ethnic origins on the 2011 National Household Survey (NHS).
The decrease in the total number of Jewish responses had been a persistent pattern since 1991, although smaller in magnitude than the decrease from 2011 to 2016. As can be seen in Chart 1, while total responses of Jewish have been decreasing since the 1996 Census, observed decreases between cycles prior to the 2016 Census never exceeded 10%. In addition, multiple responses had been steadily increasing until a decline in 2016.
The factors accounting for the larger decrease in Jewish responses between 2011 and 2016 were analyzed during the certification of the census data, prior to the release of the 2016 Census. In particular, this decrease was determined to be largely driven by people changing their response(s) to the ethnic origin question from the 2011 NHS to the 2016 Census.
Changing answers from census to census is expected for the ethnic origin question for a number of reasons. Responses to the ethnic origin question are a reflection of the respondent’s perception of their ancestor’s ethnicity at the time of the census, and are therefore subject to changes in the social environment, changes in individuals’ understanding of the concept, and changes in awareness of family history. In addition, changes in the question wording, format, examples, instructions and data processing can also have an impact on responses over time.
As a result of declining responses relative to other ethnic origins, and in keeping with a longstanding methodology, “Jewish” was no longer among the ethnic origin examples on the 2016 Census questionnaire, while it had been on the list of examples on the 2011 NHS. The report finds evidence that removing “Jewish” as an example listed on the 2016 questionnaire could have influenced the decrease in reporting “Jewish” as an ethnic origin in 2016. It also shows that other changes to the list of examples have affected changes in response to the ethnic origin question over time.
However, total responses of “Jewish” were already decreasing in each census since 1996. While the absence of “Jewish” from the list of examples in 2016 exacerbated an existing trend, it did not introduce an entirely new phenomenon.
This paper explores the various factors affecting the comparability of census ethnic origin results over time with a specific focus on the decrease in reporting of Jewish ethnic origins between 2011 and 2016. Changes in respondent behaviour are analyzed in more detail including the effects of changes in ethnic origin examples over time. This analysis is based on a data integration between the 2011 NHS and the 2016 Census.

Data table for Chart 1
| 1996 Census | 2001 Census | 2006 Census | 2011 NHS | 2016 Census | |
|---|---|---|---|---|---|
| number | |||||
| Total responses of "Jewish" | 351,705 | 348,605 | 315,120 | 309,650 | 143,665 |
| Single responses of "Jewish" | 195,810 | 186,475 | 134,045 | 115,640 | 39,715 |
| Multiple responses of "Jewish" | 155,900 | 162,135 | 181,075 | 194,010 | 103,950 |
| Sources: Statistics Canada, censuses of population 1996, 2001, 2006 and 2016; 2011 National Household Survey. | |||||
Concepts
- Ethnic origin is a complex concept and, in the context of the Census of Population, refers to the ethnic or cultural origins of the person’s ancestors. Responses to the ethnic origin question on the census are a reflection of respondents’ perceptions of their background. As such, many factors can influence changes in response over time, including the contemporary social environment, the respondent’s knowledge of family history as well as their understanding of and views on the topic. On the 2016 Census questionnaire, an “ancestor” is defined as usually more distant than a grandparent. Ethnic origin refers to a person’s “roots” and should not be confused with citizenship, nationality, language, religion or place of birth.Note
- Some ethnic origins may have the same name as other variables, but represent different concepts. For example, the ethnic origin category “French” refers to people who reported having French ethnic or cultural origins; such people may or may not have French citizenship or speak French. In the case of “Jewish,” the ethnic origin concept refers to the ethnic or cultural origins of the respondent’s ancestors and is not the same as the Jewish religion. Therefore, someone can be ethnically or culturally Jewish but not of the Jewish religion, and someone can have Jewish as a religion without their ancestors being ethnically or culturally Jewish.
- Respondents are allowed to write-in up to six different responses to the ethnic origin question. ‘Single responses’ occur when a respondent provides one ethnic origin only. ‘Multiple responses’ occur when a respondent provides two or more ethnic origins. ‘Total responses’ indicate the number of persons who reported a specific ethnic origin, either as their only ethnic origin or in addition to one or more other ethnic origin(s). Due to multiple responses, the total counts of ethnic origins is greater than the total population of Canada.
- Over time, there have been differences in the question wording, format, examples and instructions for the ethnic origin question used in the census. The historical comparability of ethnic origin data has thus been affected by these factors, as well as by changes in data processing, proxy responses, and the social environment at the time of the census.Note
- On the census questionnaire, it is not feasible to include examples for all possible ethnic or cultural origins. Therefore, a smaller list of 28 examples was provided on the 2016 Census questionnaire to guide respondents as to how to answer the question. The list of examples was based on Statistics Canada's long- established methodology (see section 2.1).
- The issue of limited space for examples and instructions is especially true for paper questionnaires. However, with the increasing prevalence of electronic collection, Statistics Canada is investigating new options to assist respondents in reporting their diverse ethnic or cultural origins ahead of the 2021 Census of Population.
1.1 Demographic factors
One possible explanation for the decrease in Jewish ethnic origin in 2016 is that it could have been the result of demographic factors. Demographic factors of growth include new births, new migrants, and movement to the in-scope population (e.g., persons moving from collective to private dwellings between censuses). Factors of decline include deaths, out-migration and movement to the out-of-scope population (e.g., persons moving from private to collective dwellings between censuses).
In 2016, there were 9,385 people aged 0 to 4 and an additional 7,110 new migrants who reported Jewish as an ethnic origin. If only demographic factors were at play—and given this total of 16,495 new births and new migrants between 2011 and 2016—to arrive at the 143,660 who reported Jewish in 2016 would have required a loss of 182,480 due to demographic factors such as deaths, out-migration, and movement to the out-of-scope population - a 58.9% decrease from 2011.
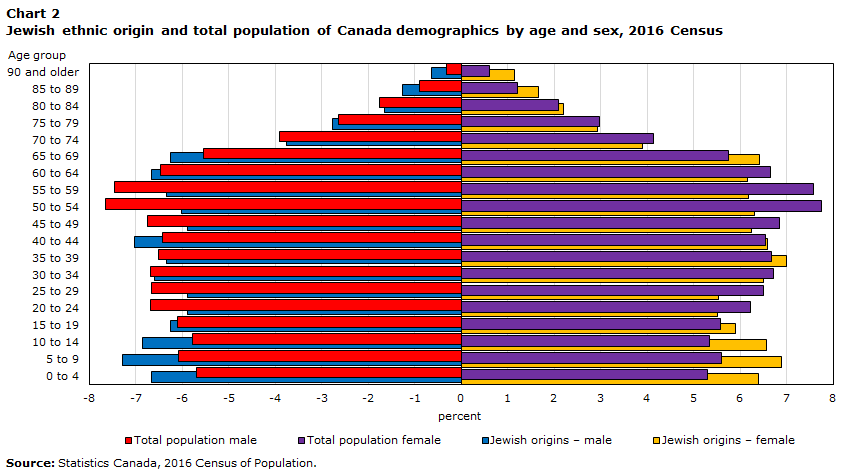
Perhaps if the Jewish population was disproportionately older than the general population, then higher death rates and movement to the out-of-scope population (such as retirement residences) could have been a contributing factor to the decline in the Jewish population. However, as Chart 2 demonstrates, the Jewish population is not disproportionately older than the general population. In addition, there is no evidence that over half the Jewish population left the country between 2011 and 2016. For these reasons, the decrease in the Jewish ethnic origin population in 2016 cannot be explained by observed demographic changes alone.
Data table for Chart 2
| Age group | Total population | Jewish origins | ||
|---|---|---|---|---|
| male | female | male | female | |
| percent | ||||
| 90 and older | -0.3 | 0.6 | -0.6 | 1.2 |
| 85 to 89 | -0.9 | 1.2 | -1.3 | 1.7 |
| 80 to 84 | -1.8 | 2.1 | -1.7 | 2.2 |
| 75 to 79 | -2.6 | 3.0 | -2.8 | 2.9 |
| 70 to 74 | -3.9 | 4.1 | -3.8 | 3.9 |
| 65 to 69 | -5.5 | 5.7 | -6.3 | 6.4 |
| 60 to 64 | -6.5 | 6.7 | -6.7 | 6.1 |
| 55 to 59 | -7.5 | 7.6 | -6.3 | 6.2 |
| 50 to 54 | -7.7 | 7.7 | -6.0 | 6.3 |
| 45 to 49 | -6.7 | 6.8 | -5.9 | 6.2 |
| 40 to 44 | -6.4 | 6.6 | -7.0 | 6.6 |
| 35 to 39 | -6.5 | 6.7 | -6.3 | 7.0 |
| 30 to 34 | -6.7 | 6.7 | -6.6 | 6.5 |
| 25 to 29 | -6.7 | 6.5 | -5.9 | 5.5 |
| 20 to 24 | -6.7 | 6.2 | -5.9 | 5.5 |
| 15 to 19 | -6.1 | 5.6 | -6.2 | 5.9 |
| 10 to 14 | -5.8 | 5.3 | -6.8 | 6.6 |
| 5 to 9 | -6.1 | 5.6 | -7.3 | 6.9 |
| 0 to 4 | -5.7 | 5.3 | -6.7 | 6.4 |
| Source: Statistics Canada, 2016 Census of Population. | ||||
1.2 Data quality in the 2016 Census
With a change of this magnitude in responses, Statistics Canada investigated whether this was a result of data or collection errors in either the 2016 Census or the 2011 NHS. However, no evidence of any collection or processing errors was discovered. All responses of “Jewish” (in addition to other responses typically coded as “Jewish,” such as “Ashkenazi”, “Yiddish”, etc.) were reviewed in detail to ensure that they had been coded correctly. Furthermore, the decline in the Jewish ethnic origin was observed across various geographies and collection factors, so there was no evidence that the decline in Jewish responses was the result of specific collection or processing errors.
The 2011 NHS did employ a different methodology than was used for the 2016 Census, the 2006 Census and prior censuses. These differences could have affected comparability between 2016 Census and 2011 National Household Survey estimates for the ethnic origin variable.Note However, there was no evidence that the observed decline in Jewish responses was a result of this difference in methodology.
1.3 Changing answers to the ethnic origin question
Another potential explanation for the decrease in Jewish ethnic origin in 2016 is that people changed their answer to the ethnic origin question between 2011 and 2016. Given that ethnic origin responses can be influenced by changing individual and societal perceptions of the topic, some degree of shifting responses is always expected.Note However, for a decrease of the magnitude observed for the Jewish ethnic origin, there would likely need to be some important factor affecting a change in response.
This factor may have been the change that was made to the list of examples for the 2016 ethnic origin question. As outlined in section 2.1, it is known that examples to a question can influence response patterns. As indicated previously, as a result of a long-established methodology used to choose the examples of ethnic and cultural origins on the questionnaire, “Jewish” did not appear as an example on the 2016 Census questionnaire (see section 2.1 for a description of the methodology and Appendix 1 for screenshots of the ethnic origin question in 2011 and 2016). In 2011 (and in censuses prior to 2011), respondents may have been more likely to include “Jewish” in their ethnic origin response after seeing it in the list of examples, so its removal in 2016 may have affected respondent behaviour leading to fewer Jewish responses.
Start of text boxMethodology
- To determine whether people changed their answers, data from the 2016 Census and the 2011 NHS were integrated. This resulted in a new data source that allowed individuals to be followed across cycles to discover how their responses might have changed from one census to another.
- In this report, the term “response mobility” refers to the effect of individuals changing their answers between 2011 and 2016. Net response mobility is estimated by subtracting the number of individuals who no longer reported a response provided in the previous census from the number of those who began reporting a response not provided in the previous census. A positive net mobility indicates that more people began reporting a response than stopped reporting it, indicating that the population of interest is growing at least partly because of changes in responses.
- Of those who provided answers to both the 2016 long-form Census and the 2011 NHS, 86.9% are included in this integrated dataset.Note
- The resulting integrated dataset contains a total of 1,389,748 records. Each record is assigned a weight to provide estimates for changes in the total in-scope population.
- Included in the dataset are people who lived in private dwellings in both 2011 and 2016 and who completed the 2011 NHS and the 2016 long-form Census. Excluded from the dataset are those who were younger than the age of 5 in 2016 (who would not have been born when the 2011 NHS was conducted), individuals who migrated to Canada between cycles, individuals who died or left Canada between cycles, and individuals who lived in a collective dwelling for the reference date in either 2011 or 2016.
- Limitations to the dataset include the fact that not everyone who answered both the 2011 NHS and the 2016 Census could be integrated. A second limitation is the possibility that two different people may have been incorrectly connected as part of the integration process. This can lead to the appearance of a change in response that did not actually occur. Any coverage or data quality issues with either cycle would also impact the integrated dataset.
- All analysis is performed using percentages rather than frequencies. The weights for the integrated dataset were generated only for comparison and growth calculations, and not for frequencies.
2. Why were people less likely to respond “Jewish” to the ethnic origin question in 2016?
Comparing the same person’s response in 2011 with their response in 2016 demonstrates how response mobility was a major factor in the decrease in Jewish responses to the ethnic origin question in 2016. The data show how many people added a Jewish response in 2016 among those who did not respond “Jewish” in 2011, and how many people who reported Jewish in 2011 did not do so in 2016. The result of people who did not report Jewish in 2011, but did so in 2016 was an upward pressure of 15.5% to the 2011 totals for the Jewish ethnic origin. At the same time, however, 70.7% of people who reported Jewish in 2011 did not do so in 2016. Combining these two numbers results in a net response mobility of -55.3% for the Jewish ethnic origin.
Changing answers from census to census is expected for the ethnic origin question for a number of reasons. First, the question allows multiple responses, and therefore someone may choose, for example, to report four ethnic origins one census but only three the next. This would seem to be a minor change to the respondent, but it is still a different response. Second, the ethnic origin question is a reflection of the respondent’s perception of their ancestors’ ethnicity at the time of the census, and is therefore subject to changes in the social environment, changes in individual understanding of the concept and changes in awareness of family history.Note Generally these changes in responses from cycle to cycle cancel each other out and do not have a major impact on overall trends. For example, from 2011 to 2016, the English ethnic origin had 34.5% more people adding English in 2016 and 35.2% removing English in 2016. This resulted in a small net mobility of -0.7% for English.
As was seen in Chart 1, total responses for the Jewish ethnic origin have been declining since 1996. If the larger decline in 2016 was mostly a result of people changing their answers and not a result of demographic changes, then it must be asked whether the declines across previous cycles were also a result of people changing their answers. While response mobility was higher in the 2011-2016 period, Chart 3 shows that, since 2001, the Jewish ethnic origin population experienced net losses because of response mobility. Based on the data available, however, it is not clear why respondents have become less likely to include “Jewish” as an ethnic origin over time.

Data table for Chart 3
| 2011-2016 | 2006-2011 | 2001-2006Data table Note 1 | |
|---|---|---|---|
| percent | |||
| Net mobility | -55.3 | -7.2 | -15.9 |
Sources: Statistics Canada, 2001 Census–2006 Census, 2006 Census–2011 National Household Survey, 2011 National Household Survey–2016 Census integrations. |
|||
2.1 Changes to the list of example ethnic origins
Even though net response mobility for Jewish has been negative since at least 2001, the estimated response mobility in the 2011-2016 period is still larger and requires further explanation. As noted earlier, a major factor in the increased net negative response mobility for Jewish was likely driven by the fact that “Jewish” did not appear on the list of 28 example ethnic origins on the 2016 Census questionnaire while it was present as an example on the 2011 NHS questionnaire (see Appendix 1).
As indicated previously, it is known that providing examples tends to influence how people respond. For example, in the 2016 Census, the number of people who immigrated to Canada in 1974 was overestimated because “1974” was used as an example of a year of immigration on the questionnaire.Note Therefore, the general preference is to avoid examples, if possible, since examples can prompt responses or cause a confusion of concepts. For example, someone may see “English” listed as an example for the ethnic origin question and assume the question is about language, or see a list of countries and assume the question is about place of birth.
Since the 1996 Census, the methodology for selecting and ordering the list of ethnic origin examples has been based on the top single-origin frequencies from the previous cycle. The top 19 origins are chosen as examples and ordered by frequency, beginning with the most frequent single response. For example, the top three single responses on the 2011 NHS were “Canadian,” “English” and “Chinese,” so those three ethnic origins were listed as the first three examples of ethnic origins on the 2016 Census.
In addition to the 19 examples chosen by frequency, five examples are included to represent First Nations, Métis and Inuit, with their placement in the list based on the total frequency of First Nations responses from the previous cycle. The first three examples are chosen to provide First Nations examples from Eastern (“Mi’kmaq”), Central (“Cree”) and Western (“Salish”) Canada. “Métis” and “Inuit” follow the three First Nations examples.
The final four examples in the list are included to provide coverage for world regions not already covered by the 19 most frequently-reported origins, ensuring that recently arrived groups in Canada, who might not be the most numerous, are represented. For 2016, “Lebanese,” “Mexican,” “Somali” and “Colombian” were included in the list of examples to provide coverage for the Middle East, Central America, sub-Saharan Africa and South America. The example origins for each region are determined based on the highest single response frequency within each regional grouping. As response frequencies have changed from cycle to cycle, these regional coverage examples have changed as well. For example, in 2016, “Mexican” replaced “Salvadorean” because counts of “Mexican” surpassed “Salvadorean” on the 2011 NHS.
Since “Jewish” was no longer among the most frequent single responses to the ethnic origin question according to the 2011 NHS, it was not selected for the list of examples for the 2016 Census. In 2011, single response frequencies for “Jewish” were surpassed by other responses, specifically Iranian and Québécois. As a result of the pre-established methodology, Iranian was added to the list of examples, and Jewish was removed.
2.2 Why have a list of example ethnic origins?
If changing the list of ethnic origin examples is likely to have had such an impact on responses, then one might ask why a list of example ethnic origins is provided at all. Ethnic origin is an open-ended concept that could yield a variety of responses. Examples are provided to help respondents provide an answer. The risk is that, if there were no examples, a respondent might not know what level of detail to provide. For example, if the respondent’s ancestors were from Somalia, the respondent may simply put “African,” but seeing “Somali” as an example could help guide them to provide a different level of detail. However, as was seen with “Jewish” in 2016, the presence or absence of an origin on the list of examples creates the risk of large shifts in responses.
2.3 How have past changes to the list of examples affected responses?
Since 1996, changes to the list of examples have been associated, at least in part, with changes in response frequencies for the origin affected. A few examples include:
- In 2006, “Salvadorean” was added to the list of examples for the ethnic origin question in order to ensure geographic coverage of Central America. Counts for “Salvadorean” increased by 121% from 2001 to 2006.
- For the 2011 NHS, “Colombian” replaced “Chilean” as the regional coverage example for South America. Responses of “Colombian” grew by 73.7% from 2006 to 2011. Conversely, counts for “Chilean” decreased by 11.1% during the same period.
- In 2016, “Salvadorean” was replaced with “Mexican” as the coverage example for Central America. Ethnic origin responses of “Mexican” increased by 33.8%, while total responses of “Salvadorean” increased by 3.5% from 2011 to 2016 (compared to an 8.2% increase from 2006 to 2011).
- “Iranian” replaced “Jewish” on the list of examples for 2016 and saw an increase of 28.9% from 2011 to 2016.
Most of the examples for ethnic origin are demonyms for countries, but Jewish is not. It is possible that removing “Jewish” from the list of examples had a larger impact than past changes to the list because there are no similar responses to Jewish in the list of examples. Someone who is Czech, for example, will see a list of other country-based origins and will likely be able to deduce that “Czech” is an acceptable response, even if it is not included in the list. In the case of “Jewish,” the example list may not provide an adequate equivalent concept to a non-country-based origin.
A similar situation occurred with the addition of “Canadian” to the list of example ethnic origins in 1996. Until 1951, enumerators were instructed not to accept “Canadian” as a valid response to the ethnic and cultural origin question.Note Partly influenced by a media campaign advocating for people to answer “Canadian” to the ethnic origin question in 1991, the single response frequencies increased enough to place “Canadian” fifth in the list of example ethnic origins for the 1996 Census.Note Responses of “Canadian” increased from approximately 1 million in 1991 to 8.8 million in 1996 (see Chart 4), likely as a result of adding “Canadian” to the list of examples.

Data table for Chart 4
| 1981 | 1986 | 1991 | 1996 | 2001 | 2006 | 2011 | 2016 | |
|---|---|---|---|---|---|---|---|---|
| number | ||||||||
| Canadian count | 76,395 | 115,375 | 1,033,030 | 8,806,275 | 11,682,680 | 10,066,290 | 10,563,805 | 11,135,965 |
| Sources: Statistics Canada, censuses of population 1981, 1986, 1991, 1996, 2001, 2006 and 2016; 2011 National Household Survey. | ||||||||
The effect of the inclusion of “Canadian” on the list of ethnic origin examples in 1996 is potentially instructive for the effect of the removal of “Jewish” from the list of examples in 2016. Both responses of “Jewish” and “Canadian” are likely disproportionately affected by being included or excluded from the list of examples. Without seeing “Canadian” on the list of examples, people may not have realized that this was a possible response to the ethnic origin question since the examples listed were common countries from which people’s ancestors had immigrated. Given that “Jewish” is not a country-based origin like most of the other examples, it may follow a similar pattern in that people may not realize it is a valid response without seeing it as an example. The result would be that ethnic origin response totals for “Jewish,” like “Canadian,” are influenced by whether or not the origin is included in the list of examples.
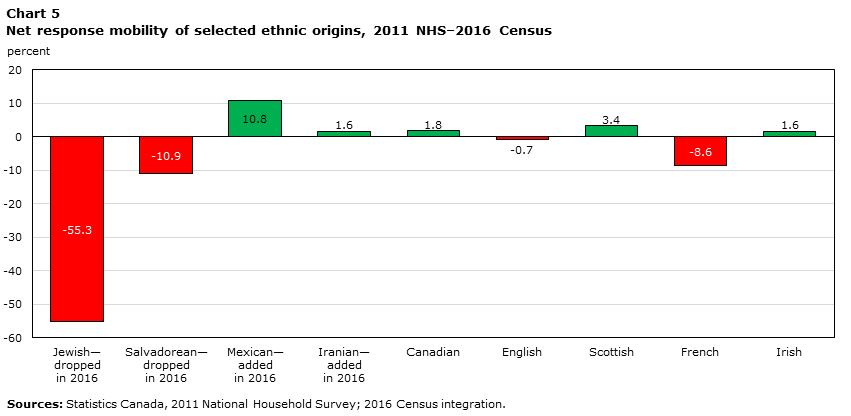
As mentioned earlier, the removal of “Jewish” from the list of ethnic origin examples was not the only change made to the questionnaire in 2016. “Salvadorean” was also removed in favour of “Mexican” as the regional example for Central America. The overall total for “Salvadorean” increased by 3.5%, making it seem like the removal of “Salvadorean” as an example did not negatively impact total counts. However, by estimating response mobility from the 2011 NHS–2016 Census integration, we see that “Salvadorean” experienced a net negative response mobility of 10.9%—meaning that, overall, people were 10.9% less likely to answer “Salvadorean” in 2016 than in 2011 (see Chart 5). “Mexican,” which was added to the list of examples in place of “Salvadorean,” showed a positive net mobility of 10.8%.
For comparison purposes, the top five total responses to the ethnic origin question are included in Chart 5, along with the origins that were added to or removed from the list of examples. Chart 5 demonstrates that, while there is quite a bit of response mobility from cycle to cycle (even for origins that remain on the list of examples), for the most part, the gains and losses cancel out and result in net response mobility for these origins of less than 10 percentage points between 2011 and 2016. In contrast, three of the four origins that were either removed or added for the 2016 Census experienced net response mobility of more than 10 percentage points.
Data table for Chart 5
| Jewish—dropped in 2016 | Salvadorean—dropped in 2016 | Mexican—added in 2016 | Iranian—added in 2016 | Canadian | English | Scottish | French | Irish | |
|---|---|---|---|---|---|---|---|---|---|
| percent | |||||||||
| Net mobility | -55.3 | -10.9 | 10.8 | 1.6 | 1.8 | -0.7 | 3.4 | -8.6 | 1.6 |
| Sources: Statistics Canada, 2011 National Household Survey; 2016 Census integration. | |||||||||
3. How are people who responded “Jewish” in 2011 changing their ethnic origin responses?
3.1 Which origins were reported by people who no longer reported “Jewish” without replacing it?
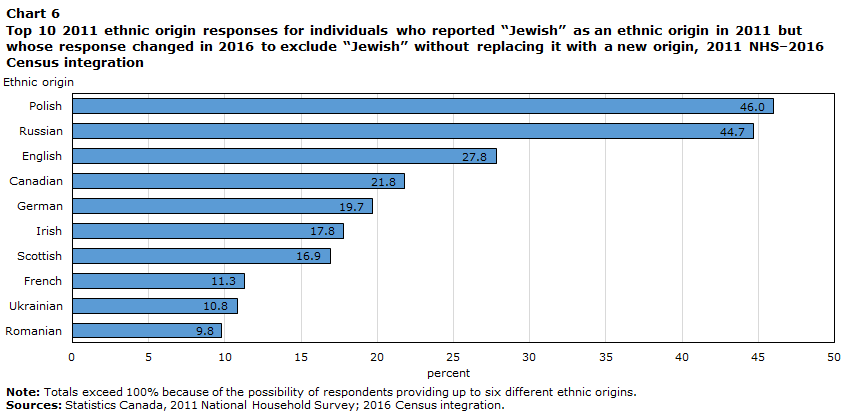
The population who responded “Jewish” in 2011 but did not do so in 2016 can be divided into two groups. The first group contains people who did not add any new origins in 2016, but simply no longer reported “Jewish” in their ethnic origin response. For example, this group would include those who, in 2011, responded “Jewish, Russian and Polish,” but in 2016 removed “Jewish” and responded with just “Russian and Polish.” Of those who reported Jewish ethnic origins in 2011 but not 2016, 25.7% of people fell into this first group. Chart 6 shows the most frequent ethnic origin responses for those who reported Jewish ethnic origins in 2011 but changed their answer to exclude “Jewish” in 2016 without adding a new origin.
Data table for Chart 6
| Ethnic origin | Percent |
|---|---|
| Polish | 46.0 |
| Russian | 44.7 |
| English | 27.8 |
| Canadian | 21.8 |
| German | 19.7 |
| Irish | 17.8 |
| Scottish | 16.9 |
| French | 11.3 |
| Ukrainian | 10.8 |
| Romanian | 9.8 |
|
Note: Totals exceed 100% because of the possibility of respondents providing up to six different ethnic origins. Sources: Statistics Canada, 2011 National Household Survey; 2016 Census integration. |
|
3.2 Which origins directly replaced “Jewish” in 2016?
The second group who no longer reported “Jewish” in 2016 are those who replaced it with another ethnic origin. For 2016, this second group consisted of 74.3% of the total responses that removed “Jewish” from 2011 to 2016. This means that most respondents actively sought to add a new ethnic origin to replace “Jewish,” rather than passively removing it and otherwise keeping their 2011 response the same. For example, if someone responded “Jewish and Russian” in 2011, but in 2016 responded “Russian, Ukrainian and Romanian,” then “Ukrainian and Romanian” would have replaced “Jewish.”
Chart 7 provides the top 10 ethnic origins added in 2016 for those who no longer reported “Jewish” in 2016. These are the origins that were added as a direct replacement for “Jewish.”
Chart 7 shows that “Russian,” “Polish” and “Canadian” were the top responses given to directly replace “Jewish.” Notably, the Israeli ethnic origin experienced an overall positive net response mobility of 53.4% from 2011 to 2016. While most of the response mobility away from “Jewish” was distributed among ethnic origins with large populations such as Russian and Polish, causing little overall impact to their growth in 2016, “Israeli” had a relatively small total in 2011. Therefore, increased mobility from “Jewish” to “Israeli” had a noticeable impact on totals for the Israeli origin. The fact that a country-based origin such as “Israeli” benefited from respondents changing answers from “Jewish” could be interpreted as lending support to the idea that respondents may not have understood that “Jewish” was a valid response after seeing a list of primarily geographic origin examples.

Data table for Chart 7
| Ethnic origin | Percent |
|---|---|
| Russian | 18.3 |
| Polish | 17.6 |
| Canadian | 16.3 |
| English | 6.9 |
| Romanian | 5.0 |
| Ukrainian | 4.7 |
| Israeli | 4.7 |
| German | 4.3 |
| Scottish | 4.1 |
| Lithuanian | 3.5 |
| Sources: Statistics Canada, 2011 National Household Survey; 2016 Census integration. | |
4. Characteristics of the population who changed responses
The preceding section focused on examining how people who responded “Jewish” in 2011 changed their answers for the 2016 Census. This section will look at the characteristics of the population who changed their answers, with a focus on religion, geography and demographics. By examining the characteristics of the population who changed responses, it can be determined whether other subgroups or factors may have contributed to the decline in people who reported Jewish ethnic origins in 2016.
4.1 Response mobility by geography and sociodemographic characteristics
Response mobility can be isolated based on geographic and sociodemographic factors to further understand the characteristics of the population who changed answers from cycle to cycle. Beginning with geography, estimated response mobility by province did not reveal a clear pattern since all provinces had high levels of net negative mobility. The same was true at the census metropolitan area level, with respondents in all major cities being less likely to report Jewish origins in 2016. In terms of sociodemographic characteristics, response mobility patterns were remarkably consistent for sex, marital status and the presence of children in a census family (see Table 1).
The categories that did display a different pattern were immigrant status and generation status. Immigrants and, accordingly, those in the first generation were less likely to no longer report “Jewish” as a response for 2016, although their overall net mobility was still strongly negative. This pattern could be expected for many ethnic origins, as the further removed a respondent is from a place of origin, the more likely they are to possibly change answers. For comparison, the Salvadorean ethnic origin (also removed from the list of examples in 2016) had an estimated net response mobility of -21.5% for the third generation, compared with -14.2% for the first generation. Given that “Jewish” is not a place of origin, one might expect this generation effect to be softened. However, this was not the case, as “Jewish” showed a similar response-mobility generation effect to the country-based origin of “Salvadorean.”
| Demographic characteristic | Net response mobility: Jewish ethnic origin |
|---|---|
| percent | |
| Sex: male | -54.4 |
| Sex: female | -56.1 |
| Marital status: single | -53.0 |
| Marital status: married | -57.6 |
| Marital status: common law | -56.6 |
| Census family: with children | -54.0 |
| Census family: without children | -59.7 |
| Immigrant status: immigrant | -45.2 |
| Immigrant status: non-immigrant | -59.8 |
| Generation status: first generation | -45.0 |
| Generation status: second generation | -59.5 |
| Generation status: third generation | -60.4 |
| Sources: Statistics Canada, 2011 National Household Survey; 2016 Census of Pupulation. | |
Analyzing response mobility based on age groups shows a small variation between groups. Estimated net response mobility is lowest for those in their 30s (-50.4%) and 40s (-50.2%), but is higher for older age cohorts (-61.7% for those in their 70s and -60.7% for those in their 80s).
4.2 Religion
Although “Jewish” is a valid response to the ethnic origin question, since Judaism is a religion, one might expect a strong relationship between those who responded “Jewish” to the religion question and those who responded “Jewish” to the ethnic origin question. However, as Chart 8 demonstrates, those who reported Judaism as their religion in 2011 had the highest net negative response mobility for reporting “Jewish” as an ethnic origin in 2016.

Data table for Chart 8
| Judaism religion | Religion other than Judaism | No religion | |
|---|---|---|---|
| percent | |||
| Net mobility | -65.3 | -31.4 | -39.6 |
| Sources: Statistics Canada, 2011 National Household Survey; 2016 Census integration. | |||
Chart 9 also shows that, among the population who removed “Jewish” as an ethnic origin in 2016, the majority listed “Jewish” as their religion in 2011 (66.3%), while 17.5% listed no religion in 2011.

Data table for Chart 9
| Religion | 2011 NHS Jewish ethnic origin | 2011-2016 Integrated data – Jewish ethnic origin | Kept Jewish | Added Jewish | Removed Jewish |
|---|---|---|---|---|---|
| percent | |||||
| Jewish religion | 66.7 | 65.9 | 64.8 | 25.2 | 66.3 |
| No religion | 18.0 | 18.7 | 21.5 | 32.4 | 17.5 |
| Christian | 14.2 | 14.3 | 12.5 | 41.2 | 15.0 |
| Other religions | 1.0 | 1.2 | 1.2 | 1.3 | 1.2 |
| Sources: Statistics Canada, 2011 National Household Survey; 2016 Census integration. | |||||
5. How many people in Canada had Jewish origins in 2016?
According to the 2016 Census, 143,665 people reported Jewish origins. This is based on the responses provided by people living in Canada to the 2016 Census question on ethnic origin.
However, as shown throughout this report, there is evidence that since “Jewish” was no longer an example on the questionnaire in 2016, fewer respondents included it in their answer than before. This suggests that if the examples had not changed and if “Jewish” had remained an example on the questionnaire, the estimate in 2016 would have been higher than 143,665. Given the overall trend of decline for Jewish origins since 1991, the estimate likely would still have been lower than the 309,650 estimated according to the 2011 NHS. Ultimately, it is not possible to know what the specific estimate would have been in 2016 if the examples had remained unchanged.
It is possible to derive a range of estimates of “Jewish” origins based on certain assumptions. As shown in section 2, net response mobility between 2011 and 2016 was estimated as -55.3%. This implies that if there were no other factors affecting growth (e.g., births, deaths, migration), the number of people reporting Jewish origins would have declined by 55.3%.
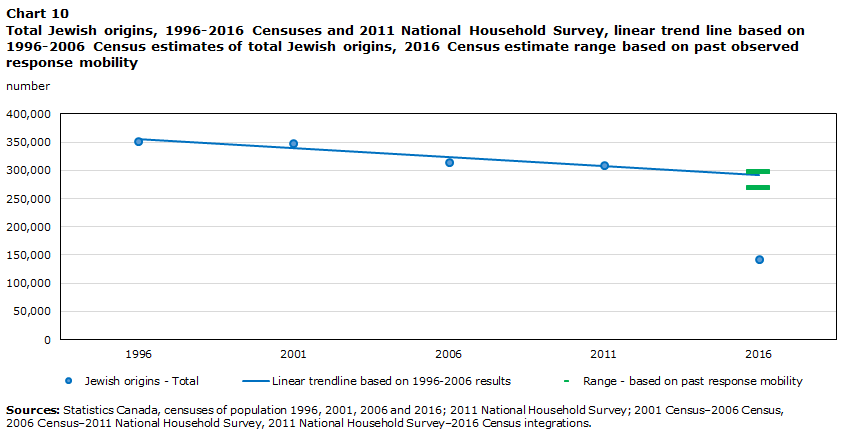
In contrast, observed net response mobility was lower between 2001 and 2011. The net response mobility between 2001 and 2006 was estimated as -15.9%, while the net response mobility between 2006 and 2011 was estimated as -7.2%. Assuming that response mobility between 2011 and 2016 would have been similar to these previous rates if the Jewish example had remained on the questionnaire in 2016, the number of people who would have reported Jewish origins would have been between 270,000 (based on -15.9% response mobility) and 298,000 (based on -7.2% response mobility)Note .
As illustrated in Chart 10, looking at a basic linear trend line based on the previous three censuses (1996, 2001, and 2006), the 2016 value for that trend line would have fallen within this predicted range of estimates, while the 2016 result is lower than what the historical trend would suggest.
Data table for Chart 10
| 1996 | 2001 | 2006 | 2011 | 2016 | |
|---|---|---|---|---|---|
| number | |||||
| Jewish origins - Total | 351,705 | 348,605 | 315,120 | 309,650 | 143,665 |
| Linear trendline based on 1996-2006 results | 355,217.50 | 339,252.50 | 323,287.50 | 307,322.50 | 291,357.50 |
| Range - based on 2001-2006 response mobility | ... | ... | ... | ... | 270,000.00 |
| Range - based on 2006-2011 response mobility | ... | ... | ... | ... | 298,000.00 |
|
... not applicable Sources: Statistics Canada, censuses of population 1996, 2001, 2006 and 2016; 2011 National Household Survey; 2001 Census–2006 Census, 2006 Census–2011 National Household Survey, 2011 National Household Survey–2016 Census integrations. |
|||||
The ethnic origin question on the census allows respondents to identify the origins of their ancestors. The responses provided are thus affected by various factors, including the contemporary social environment, the respondent’s knowledge or views on the topic, and their awareness of family history. While many respondents provide multiple responses to the ethnic origin question, they may not necessarily provide a comprehensive list all of their ancestries.
Ideally, ethnic origin responses in the census would be unaffected by examples provided for the question and would only represent the respondent’s actual perception of their origins. As illustrated in section 2.3, especially the case of ‘Canadian’, examples can encourage respondents to provide specific answers which they might not have reported without being prompted. More specifically, respondents may not identify with certain ancestries as their ethnic or cultural origins without the prompt provided by the examples. This can imply that estimates for origins represented by examples are not comparable with origins not represented by examples. In addition, changes to this exclusive set of examples affect comparability for these origins over time.
In summary, it is possible to derive a range of what the Jewish ethnic origin estimate could have been in 2016 if the example remained on the questionnaire. However, this range of estimates may not reflect the population which would identify Jewish as an origin without a prompt provided by the examples.
The ethnic origin question on the census is intended to measure the diverse origins of people living in Canada. As a result, it is necessarily complex, multi-dimensional and relies on respondents to self-report those origins with which they identify their ancestors. Changes to these factors over time, including changes to the question itself, should always be taken into account when comparing ethnic origin results over time.
6. Conclusion
While the decrease in responses for “Jewish” as an ethnic origin in 2016 was likely driven by the fact that “Jewish” was no longer among the list of ethnic origin examples, response mobility involving the Jewish ethnic origin is part of a larger pattern that predates the 2016 Census. As has been shown, the Jewish ethnic origin has experienced negative response mobility since the 1996 Census. Therefore, removing “Jewish” from the list of examples exacerbated an existing trend; it did not introduce an entirely new phenomenon.
Most respondents replaced “Jewish” with a different response, while others simply removed it from a set of multiple responses. “Russian” and “Polish” were the most common responses that replaced “Jewish” among these respondents. Respondents who reported “Jewish” as their religion in 2011 experienced higher net negative response mobility compared with those who listed no religion or a religion other than Jewish. Second- and third-generation Canadians were also more likely than immigrants to no longer report “Jewish” as a response. In 2016, “Russian,” “Polish” and “Canadian” were the most common responses that respondents added to replace “Jewish.”
With changes to the list of examples likely having such a noticeable relationship with observed response patterns, the question of how to minimize this impact needs to be investigated. Ideally, the ethnic origin question would not include any examples, to avoid inflating and deflating responses based on what was included or excluded in the list of examples. However, as mentioned, removing the examples could lead to some respondents not understanding the question.
The current method of choosing examples may require further investigation to address some possible issues with how the examples are chosen. In 2016, the list of examples was dominated by country-based origins, with no examples of non-country or non-Indigenous cultural origins. As was seen with the spike in responses that shifted from “Jewish” to “Israeli,” respondents may have believed that the question was asking only for a country-based origin, to the exclusion of origins that are not associated with a specific country.
The list of examples may generate confusion since the examples include ethnic origins that can also be languages, and country-based origins that can also be citizenships, leading to a possible confusion of concepts. Someone may see “English” and “French” at the beginning of the list of examples and, regardless of their origin, may list one of these responses since it is the language they speak. Furthermore, the list of examples is currently quite long, with 28 examples. Respondents may perceive this long list as being exhaustive and feel that they must choose from one of the listed examples.
To address the concerns raised in this study, and leveraging increases in electronic collection, Statistics Canada is testing a new version of the ethnic origin question ahead of the 2021 Census of Population. This version will not include any examples on the questionnaire itself but will instead provide respondents with a brief description of different types of origins and offer a link to an extensive list of more than 400 origins if they still require further guidance. This approach would mitigate the prompt effects of specific examples as well as the effects on historical comparability associated with changes in examples from cycle to cycle. Origins would be treated equivalently instead of providing benefits to a selection used as examples at the expense of those not used as examples. This version is included in the 2019 Census Content Test where the results will be analyzed and compared with other versions of the question. Various factors including response burden and data quality will be assessed as part of this process. The results of the 2019 Census Content Test will feed into recommendations for the 2021 Census of Population.
Appendix 1: 2011 and 2016 ethnic origin questions
The 2011 ethnic origin question

Description for Figure 1
This question collects information on the ancestral origins of the population and provides information about the composition of Canada's diverse population.
17 What were the ethnic or cultural origins of this person's ancestors?
An ancestor is usually more distant than a grandparent.
For example, Canadian, English, French, Chinese, East Indian, Italian, German, Scottish, Irish, Cree Mi'kmaq, Salish, Métis, Inuit, Filipino, Dutch, Ukrainian, Polish, Portuguese, Greek, Korean, Vietnamese, Jamaican, Jewish, Lebanese, Salvadorean, Somali, Colombian, etc.
Specify as many origins as applicable using capital letters.
The 2016 ethnic origin question
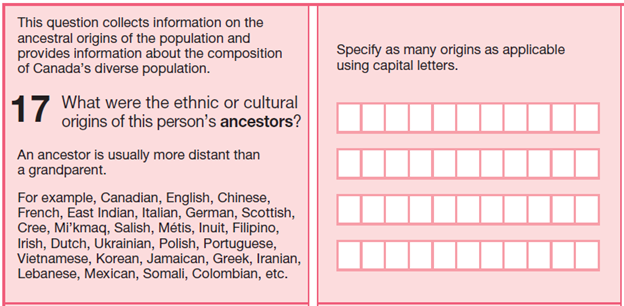
Description for Figure 2
This question collects information on the ancestral origins of the population and provides information about the composition of Canada's diverse population.
17 What were the ethnic or cultural origins of this person's ancestors?
An ancestor is usually more distant than a grandparent.
For example, Canadian, English, Chinese, French, East Indian, Italian, German, Scottish, Cree Mi'kmaq, Salish, Métis, Inuit, Filipino, Irish, Dutch, Ukrainian, Polish, Portuguese, Vietnamese, Korean, Jamaican, Greek, Iranian, Lebanese, Mexican, Somali, Colombian, etc.
Specify as many origins as applicable using capital letters.
Notes
- Date modified: