
Insights on Canadian Society
Trends in student debt of postsecondary graduates in Canada: Results from the National Graduates Survey, 2018

Archived Content
Information identified as archived is provided for reference, research or recordkeeping purposes. It is not subject to the Government of Canada Web Standards and has not been altered or updated since it was archived. Please "contact us" to request a format other than those available.
by Diane Galarneau and Laura Gibson

Skip to text
Text begins
Start of text box
Using data from the last four cycles of the National Graduates Survey (NGS), this study examines changes in the proportion of students with student debt over time, as well as the median amount of debt at graduation. Also, focussing on the 2015 cohort of graduates, the study examines the debt by field of study and by sources of financing, as well as the link between the characteristics of the students with student debt at graduation and the reduction of their debt three years after.
- Approximately half of graduates who graduated in 2015 reported that they had student debt when they completed their program. This proportion was lower among graduates with a doctorate degree (36%) and higher among graduates with a professional degree (i.e., bachelor’s degree or university certificate or diploma above a bachelor’s degree in law, medicine, dentistry, veterinary medicine, optometry or pharmacy) (85%).
- The proportion of graduates with student debt varied little between 2000 and 2015, and the median amount of student debt at graduation also remained relatively stable in real terms during this period. College graduates had the lowest amount ($11,500 in 2015) of median student debt and professional graduates the highest ($60,300 in 2015).
- Three in four students who graduated with student debt in 2015 had loans from only one source. Among those who graduated with student debt in 2015, most (74%) reported that they had government-sponsored student loans.
- Overall, 64% of the graduates in 2015 who graduated with student debt still had an outstanding debt after three years. This proportion was similar across levels of study.
- Having a smaller debt size at graduation, having a higher employment income, living in Ontario and being in a couple with no children was associated with faster student debt repayment. Factors associated with slower debt repayment included having a large amount of student debt at graduation, living in the Atlantic provinces or in Quebec, graduating at an older age, and having a disability.
End of text box
Introduction
Earning a postsecondary qualification brings many advantages to young Canadian graduates entering the labour market, and ensures a good return for each dollar spent on education.Note For example, postsecondary graduates often have access to higher-paying jobs, and are better protected from unemployment and underemployment.Note
Despite these advantages, student debt is a financial obligation for many graduates and, depending on the size of the debt, it may delay certain important life transitions, such as starting a family, building investments or purchasing a home.Note
Student debt has remained an important issue for postsecondary students during the COVID-19 pandemic as many students lost their jobs because of the pandemic.Note Statistics Canada conducted an online crowdsourcing survey and, according to the data collected,Note more than two-thirds of the participants reported being worried that they would use up their savings (68%), would have trouble paying for their current expenses or for next year’s tuition (51%), or would have to acquire additional student debt (54%).
Although no information has been collected yet on the evolution of student debt before and after the pandemic, the National Graduates Survey (NGS) has long collected information on the proportion of postsecondary students with debt (See Data sources, methods and definitions).
In this study, data from the last four cycles of the NGS are used to examine changes in the proportion of students with debt over time, and in the median amount of student debt at graduation. Additionally, using the most recent (2018) NGS cycle (based on a cohort of students who graduated in 2015), this study examines differences in student debt by field of study, and examines the sources of funding used by students (government-sponsored student loans, bank loans or lines of credit, or loans from family or friends). Finally, this study examines the characteristics of graduates who were most likely to have repaid their debt in full after three years.
One in two postsecondary graduates had student debt at graduation
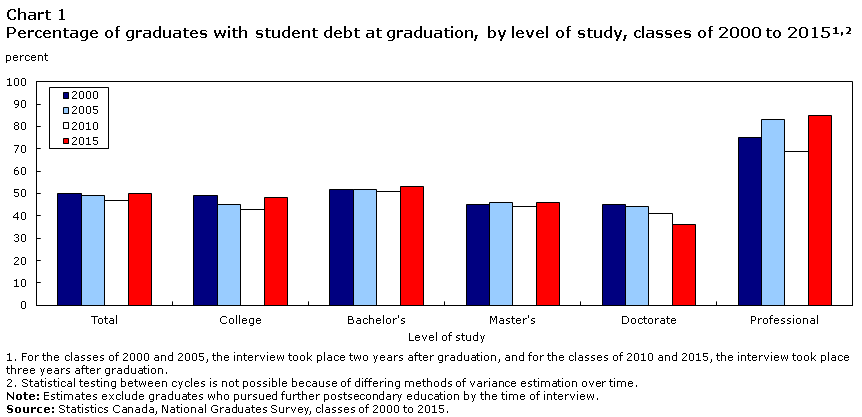
Overall, the proportion of postsecondary graduates with student debt at graduation remained relatively stable between 2000 and 2015, with approximately half of postsecondary graduates having accumulated student debt at the time of completing their program of study (Chart 1).
Data table for Chart 1
| Level of study | 2000 | 2005 | 2010 | 2015 |
|---|---|---|---|---|
| percent | ||||
| Total | 50 | 49 | 47 | 50 |
| College | 49 | 45 | 43 | 48 |
| Bachelor's | 52 | 52 | 51 | 53 |
| Master's | 45 | 46 | 44 | 46 |
| Doctorate | 45 | 44 | 41 | 36 |
| Professional | 75 | 83 | 69 | 85 |
Source: Statistics Canada, National Graduates Survey, classes of 2000 to 2015. |
||||
When level of study is examined, this proportion was relatively stable over the 15-year period for college graduates (between 43% and 49%), graduates with a bachelor’s degree (around 52%) and a master’s degree (around 45%). Together, graduates at these levels of study represented more than 95% of postsecondary graduates in each cohort. Doctorate (1.5%) and professional graduates (3.5%) accounted for the remaining 5%.
Even though graduates with a doctorate degree spend many years at school, they were among the least likely to have student debt at graduation. The proportion of doctorate degree holders with student debt also decreased steadily between 2000 and 2015, from 45% of those who graduated in 2000 to 36% of those who graduated in 2015. This relatively low proportion of graduates with student debt may be linked to the fact that many doctorate students receive funding through scholarships, fellowships, awards or prizes, or work as research or teaching assistants.Note The NGS data show that 83% of 2015 graduates with a doctorate degree reported that they funded their studies in part using scholarships or prizes, and 75% had a research or teaching assistantship.Note Furthermore, among graduates who reported the use of multiple sources of funding, doctorate graduates were the least likely to report employment earnings or savings as their main source of funding in 2015 (29%, compared to 50% and over among master's, bachelor’s and college graduates).
By contrast, most graduates with a professional degree (i.e., bachelor’s degree or university certificate or diploma above a bachelor’s degree in law, medicine, dentistry, veterinary medicine, optometry or pharmacy) graduate with student debt, and that proportion has increased—from 75% in 2000 to a high of 85% in 2015. The high prevalence of student debt among professional degree holders is related to the high costs of these programs. In the 2014/2015 academic year, tuition fees for Canadian students in professional programs were the highest of all undergraduate programs in Canada: $18,118 for dentistry, $12,987 for medicine, $11,273 for pharmacy and $10,563 for law, compared with $5,998 for the total of all fields of study.Note However, other costs—such as the cost of instruments or travel costs for medical electives—may also drive up student debt for professional degree holders.
Median debt remained stable between 2000 and 2015 for most levels of study
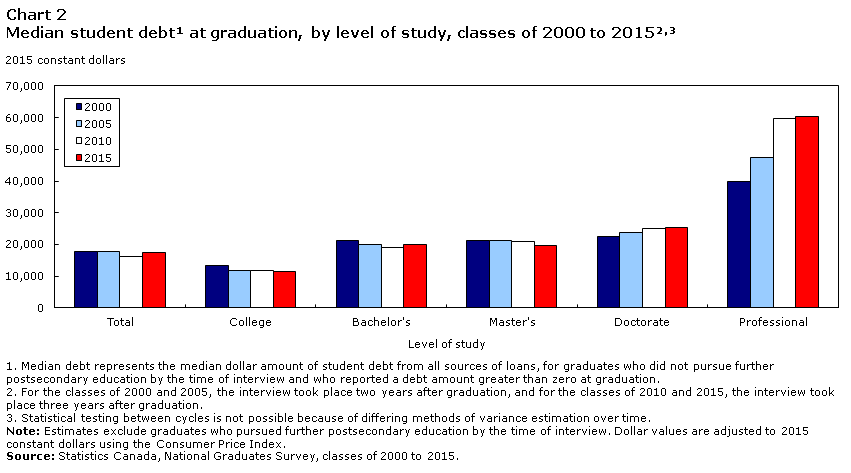
This section examines the amount of debt incurred by postsecondary graduates in each of the four NGS cycles, expressed in 2015 constant dollars. Graduates who did not have student debt at graduation were excluded from these estimates. From 2000 to 2015, the median student debt at graduationNote remained relatively stable in real termsNote for the majority of graduates (Chart 2). Students who graduated in 2015 had a median debt of $17,500 at graduation, which was comparable to the level of debt reported by those who graduated in 2000 ($17,900). This suggests that debt size has stabilized, after a period of growth in the 1980s and 1990s for college graduates and graduates with bachelor’s degrees.Note
Data table for Chart 2
| Level of study | 2000 | 2005 | 2010 | 2015 |
|---|---|---|---|---|
| 2015 constant dollars | ||||
| Total | 17,914 | 17,745 | 16,241 | 17,496 |
| College | 13,270 | 11,830 | 11,917 | 11,467 |
| Bachelor's | 21,232 | 20,111 | 19,164 | 20,004 |
| Master's | 21,232 | 21,294 | 20,832 | 19,735 |
| Doctorate | 22,559 | 23,660 | 24,951 | 25,401 |
| Professional | 39,810 | 47,320 | 59,687 | 60,287 |
Source: Statistics Canada, National Graduates Survey, classes of 2000 to 2015. |
||||
College graduates had the lowest median student debt (between $11,500 and $13,300). Bachelor’s degree holders and master’s degree holders had similar levels of debt (between $19,200 and $21,300). The median debt of doctorate degree holders increased slightly, from $22,600 to $25,400 over the period. Professional degree holders, by contrast,Note experienced a gradual increase in median student debt over the period, largely because of a 50% increase between 2000 and 2010.
Among university programs, graduates in professional programs had the highest median debt, at $60,300 in 2015. This was three times the amount reported by graduates with a bachelor’s degree ($20,000).
Graduates of health and related studies programs are among the most likely to have student debt at graduation
Student debt varied greatly by level of study and field of study. Overall, graduates of health and related studies programs were the most likely to have student debt at graduation, at 58% (Table 1). These graduates also had some of the highest median amounts of student debt for their respective levels of study: $26,700 for bachelor’s degree holders, $20,700 for master’s degree holders and $69,100 for professional degree holders.
| Field of study | Level of education | |||||||||||
|---|---|---|---|---|---|---|---|---|---|---|---|---|
| Total | College | Bachelor's | Master's | Doctorate | Professional | |||||||
| Debt at graduation | Debt amount at graduation | Debt at graduation | Debt amount at graduation | Debt at graduation | Debt amount at graduation | Debt at graduation | Debt amount at graduation | Debt at graduation | Debt amount at graduation | Debt at graduation | Debt amount at graduation | |
| percent | median | percent | median | percent | median | percent | median | percent | median | percent | median | |
| Education | 48 | 14,749 | 35 | 9,173 | 58 | 17,870 | 36 | 9,954 | 29 | 19,059 | Note ...: not applicable | Note ...: not applicable |
| Visual and performing arts, and communications technologies | 55 | 17,773 | 56 | 14,289 | 55 | 23,527 | 47 | 12,307 | 51 | 21,578 | Note ...: not applicable | Note ...: not applicable |
| Humanities | 52 | 17,878 | 53 | 13,326 | 54 | 19,597 | 43 | 11,368 | 51 | 25,431 | Note ...: not applicable | Note ...: not applicable |
| Social and behavioural sciences and law | 52 | 19,715 | 46 | 13,782 | 51 | 20,651 | 51 | 19,750 | 50 | 27,689 | 83 | 58,611 |
| Business, management and public administration | 45 | 15,987 | 44 | 10,606 | 45 | 19,482 | 46 | 19,776 | 25 | 24,587 | Note ...: not applicable | Note ...: not applicable |
| Physical and life sciences and technologies | 53 | 24,132 | 40 | 26,144 | 63 | 24,528 | 51 | 20,269 | 31 | 24,957 | Note ...: not applicable | Note ...: not applicable |
| Mathematics, computer and information sciences | 43 | 16,779 | 48 | 14,448 | 41 | 19,021 | 39 | 16,929 | 28 | 27,823 | Note ...: not applicable | Note ...: not applicable |
| Architecture, engineering and related technologies | 49 | 14,767 | 47 | 11,105 | 58 | 19,620 | 42 | 19,814 | 26 | 21,995 | Note ...: not applicable | Note ...: not applicable |
| Agriculture, natural resources and conservation | 56 | 18,916 | 61 | 17,458 | 59 | 21,314 | 48 | 18,939 | 24 | 12,109 | Note ...: not applicable | Note ...: not applicable |
| Health and related fields | 58 | 19,637 | 54 | 9,965 | 60 | 26,652 | 54 | 20,700 | 42 | 30,016 | 88 | 69,122 |
| Personal, protective and transportation services | 46 | 9,885 | 47 | 9,821 | 44 | 12,834 | 27 | 10,792 | Note F: too unreliable to be published | Note F: too unreliable to be published | Note ...: not applicable | Note ...: not applicable |
| Other | 53 | 12,744 | 67 | 6,573 | 42 | 15,465 | 51 | 13,087 | 39 | 42,038 | Note ...: not applicable | Note ...: not applicable |
|
... not applicable F too unreliable to be published. Note: Median debt amount is calculated for graduates who had debt at graduation only and does not include zero values for graduates who did not have debt. Source: Statistics Canada, National Graduates Survey, 2018. |
||||||||||||
The high prevalence of student debt and large debt among professional degree holders was not limited to graduates in health and related studies programs. Graduates with professional degrees in social and behavioural sciences and law were also among the most likely of all graduates to have student debt (83%), and had the second-highest debt ($58,600) at graduation.
At the other end of the spectrum, college graduates of education programs were among the least likely to have student debt (35%), and their median debt was the lowest ($9,200). College graduates of business, management and public administration programs were also among the least likely to graduate with debt (44%), and their median debt was also relatively low ($10,600).
For bachelor’s degree holders, graduates of mathematics, computer and information sciences, as well as those of business, management and public administration, were among the least likely to graduate with student debt (41% and 45%, respectively). These graduates also graduated with similar median debt (close to $20,000).
Education was the field in which master’s and doctorate degree holders were the least likely to graduate with student debt (36% and 29%, respectively). Education was also the field for which median debt was among the lowest for bachelor’s, master’s and doctorate degree holders (between $10,000 and $19,000).
Graduates depended largely on government-sponsored student loans
Three in four students had loans from only one source in 2015 (Table 2). Depending on the level of study, this proportion fluctuated between 82% for college graduates and 71% for graduates with master’s and doctorate degrees. Graduates with a professional degree were the exception, with 42% having only one source of student debt.
| Total | College | Bachelor's | Master's | Doctorate | Professional | |
|---|---|---|---|---|---|---|
| percent | ||||||
| Proportion of graduates with only one source of debt | 75 | 82 | 74 | 71 | 71 | 42 |
| Proportion of graduates by source of debtTable 2 Note 1 | ||||||
| Government-sponsored student loans | 74 | 69 | 80 | 69 | 73 | 86 |
| Bank loans or lines of credit | 30 | 24 | 28 | 41 | 42 | 55 |
| Loans from family or friends | 23 | 27 | 20 | 23 | 19 | 24 |
| Median debt by source | dollars | |||||
| Government-sponsored student loans | 14,992 | 10,963 | 19,980 | 14,942 | 20,735 | 25,596 |
| Bank loans or lines of credit | 12,806 | 9,821 | 13,796 | 15,655 | 19,185 | 59,994 |
| Loans from family or friends | 7,803 | 4,965 | 7,993 | 9,510 | 9,987 | 29,120 |
Source: Statistics Canada, National Graduates Survey, 2018. |
||||||
Government-sponsored student loans were the most common type of student debt; 74%Note of students who graduated with debt in 2015 had this type of debt. The prevalence of government-sponsored student loans varied somewhat by level of study, from 69% for college graduates and graduates with a master’s degree to 86% for graduates with a professional degree. One advantage of government-sponsored student loans is that they do not accrue interest while the student is in school.Note
Other types of loans were less common among students with debt. Bank loans or lines of credit (30%) were slightly more common than loans from family or friends (23%). These proportions varied slightly by level of study, graduates who obtained higher-level degrees being more likely to have a bank loan or line of credit (41% for master’s degree holders, 42% for doctorate degree holders and 55% for professional degree holders).
Graduates owed the most on their government-sponsored student loans, at $15,000 for all levels of study. This was followed by bank loans and lines of credit ($12,800 overall) and loans from family or friends ($7,800 overall). These values fluctuated by level of study, but were highest for graduates with a professional degree, whose amount owed for each of these loan sources could be up to three times higher than the amount owed by graduates in other levels of study.
Two-thirds of the class of 2015 had not fully repaid their debt by 2018
Overall, 64% of the 2015 graduates who graduated with student debt still had an outstanding debt after three years (in 2018). This proportion was similar by level of study, varying between 62% for graduates with a professional degree and 66% for college graduates (Table 3).
| Characteristics | All levels of study | College | Bachelor's degree holders | Master's, doctorate and professional degree holders | ||||
|---|---|---|---|---|---|---|---|---|
| Full debt repayment | Remaining debt | Full debt repayment | Remaining debt | Full debt repayment | Remaining debt | Full debt repayment | Remaining debt | |
| Proportion | 35.6 | 64.4 | 34.0 | 66.0 | 35.5 | 64.5 | 38.5 | 61.5 |
| Median debt at graduation ($) | 9,926 | 21,936 | 5,823 | 14,978 | 12,542 | 25,319 | 12,820 | 29,815 |
| Employment income categories (in 2018) | percent | |||||||
| No employment income | 11.7 | 15.5 | 10.3 | 14.3 | 11.5 | 15.7 | 14.3 | 17.2 |
| Less than $15,000 | 1.4 | 2.1 | 2.3 | 3.3 | 1.3 | 1.7 | 0.5 | 0.9 |
| $15,000 to $24,999 | 3.5 | 4.6 | 6.0 | 7.0 | 2.9 | 4.0 | 1.0 | 2.0 |
| $25,000 to $44,999 | 23.3 | 28.0 | 40.3 | 43.2 | 19.1 | 24.1 | 7.6 | 10.8 |
| $45,000 to $59,999 | 22.0 | 21.9 | 25.5 | 20.5 | 23.0 | 24.5 | 15.3 | 18.5 |
| $60,000 to $74,999 | 20.7 | 15.8 | 9.5 | 7.9 | 26.8 | 18.6 | 24.4 | 23.2 |
| $75,000 and more | 17.3 | 12.0 | 6.0 | 3.9 | 15.6 | 11.4 | 37.0 | 27.3 |
| Debt size | ||||||||
| Less than $5,000 | 24.8 | 4.4 | 38.4 | 7.6 | 19.0 | 2.9 | 16.9 | 2.6 |
| $5,000 to less than $10,000 | 20.4 | 12.5 | 24.3 | 21.3 | 17.8 | 7.6 | 20.0 | 8.7 |
| $10,000 to less than $25,000 | 34.7 | 37.5 | 31.0 | 44.2 | 37.3 | 34.9 | 34.4 | 31.8 |
| $25,000 or more | 20.2 | 45.5 | 6.3 | 27.0 | 25.8 | 54.6 | 28.7 | 56.9 |
| Family status | ||||||||
| Couple, with children | 16.3 | 18.6 | 16.9 | 18.6 | 12.1 | 14.8 | 23.9 | 27.4 |
| Couple, no children | 28.3 | 26.8 | 25.7 | 21.5 | 26.9 | 27.8 | 34.8 | 33.7 |
| Single, with children | 2.0 | 5.3 | 2.8 | 9.0 | 1.6 | 3.4 | 1.8 | 3.3 |
| Single, no children | 53.3 | 49.2 | 54.6 | 50.9 | 59.4 | 53.9 | 39.4 | 35.7 |
| Province of residence in 2018 | ||||||||
| Newfoundland | 0.7 | 0.9 | 0.3 | 0.4 | 0.8 | 1.2 | 1.0 | 1.2 |
| Prince Edward Island | 0.5 | 0.7 | 0.9 | 1.0 | 0.3 | 0.5 | 0.3 | 0.4 |
| Nova Scotia | 2.2 | 4.2 | 3.5 | 5.3 | 1.3 | 3.6 | 2.2 | 3.6 |
| New Brunswick | 1.8 | 2.8 | 2.3 | 3.8 | 1.7 | 2.3 | 1.2 | 2.0 |
| Quebec | 21.7 | 24.1 | 18.0 | 18.0 | 19.9 | 24.0 | 30.6 | 34.7 |
| Ontario | 44.7 | 39.6 | 41.0 | 43.5 | 47.7 | 38.5 | 44.2 | 35.4 |
| Manitoba | 2.5 | 2.9 | 3.4 | 2.5 | 2.3 | 3.3 | 1.6 | 2.5 |
| Saskatchewan | 2.2 | 3.1 | 1.6 | 3.1 | 3.0 | 3.5 | 1.6 | 2.3 |
| Alberta | 10.5 | 10.8 | 12.2 | 12.1 | 10.7 | 11.0 | 7.5 | 8.4 |
| British Columbia | 12.0 | 10.7 | 14.9 | 10.3 | 11.4 | 11.7 | 9.2 | 8.9 |
| Territories | 1.1 | 0.3 | 1.8 | 0.1 | 0.9 | 0.4 | 0.6 | 0.4 |
| Parents' level of educationTable 3 Note 1 | ||||||||
| Less than high school | 9.9 | 12.7 | 12.6 | 14.9 | 8.9 | 12.4 | 8.2 | 9.8 |
| High school | 20.8 | 25.7 | 25.5 | 30.0 | 20.8 | 24.6 | 14.2 | 20.8 |
| College or trades | 28.8 | 27.8 | 30.8 | 32.1 | 32.0 | 28.2 | 19.8 | 19.5 |
| University | 40.4 | 33.7 | 31.1 | 23.0 | 38.3 | 34.8 | 57.9 | 49.9 |
| Debt sourcesTable 3 Note 2 | ||||||||
| Government-sponsored loans | 63.4 | 81.0 | 48.6 | 79.1 | 72.0 | 84.3 | 67.3 | 76.8 |
| Loans from family or friends | 29.3 | 19.8 | 42.4 | 20.2 | 22.9 | 18.6 | 23.4 | 21.8 |
| Loans from bank or line of credit | 21.8 | 33.8 | 22.0 | 24.1 | 18.7 | 33.5 | 27.5 | 51.3 |
| Personal characteristics | ||||||||
| Female | 54.7 | 61.0 | 50.5 | 63.3 | 54.5 | 60.3 | 60.8 | 58.5 |
| Older than median age at graduation | 37.2 | 47.6 | 45.2 | 48.1 | 32.7 | 48.1 | 34.7 | 45.8 |
| Ever been a landed immigrant | 20.7 | 21.7 | 18.7 | 20.9 | 19.1 | 20.5 | 26.4 | 25.8 |
| Visible minority status | 30.6 | 30.9 | 27.4 | 30.8 | 32.2 | 31.4 | 31.9 | 30.1 |
| Aboriginal status | 2.2 | 2.4 | 2.9 | 2.5 | 2.5 | 2.7 | 0.5 | 1.5 |
| Has a disability | 22.0 | 28.4 | 25.4 | 30.8 | 21.8 | 28.1 | 17.7 | 25.3 |
|
||||||||
The median student debt at graduation for those who had not repaid their debt in 2018 was at least twice as high as for those who had repaid their debt in full in three years. Overall, the median debt at graduation for those who had not repaid their debt after three years was nearly $22,000, compared with almost $10,000 for those who had repaid their debt.
When characteristics of graduates who had repaid their debt after three years were compared with those of graduates who had not, some differences appear. For example, those who had outstanding debt after three years were less likely to be single, to reside in Ontario and to have a parent with a university credential. In addition, they were more likely to be older and to have a disability.
However, these numbers represent unadjusted proportions, which means that some of the gaps observed between the graduates who have and have not completely repaid their debt could be caused by a concentration of the graduates in certain subgroups. Consequently, a linear regression model has been estimated to take all these variables into account simultaneously, and to determine which variables are associated with faster or slower debt repayment. The results are presented in the next section.
Some factors are associated with faster student debt repayment
Although the 2018 NGS does not include information on graduates’ entire financial situation,Note it is possible to find correlations between the reduction of student debt and certain student characteristics—such as employment income, the size of debt at graduation, family situation, province of residence in 2018Note , parents’ level of educationNote and debt source (government-sponsored student loan, bank loan or line of credit, loan from family or friends)—and certain sociodemographic characteristics (such as sex, age, immigrant status, visible minority status, Indigenous identity and having a disability).
Master’s, doctorate and professional degree holders were grouped together. Separate models were estimated for the three following levels of study: college graduates, bachelor’s graduates, and master's, doctorate and professional graduates combined together. Only graduates who reported having student debt at graduation in 2015 were included in this analysis (Table 4).
| Factor affecting debt repayment | Model on percentage reduction of student debt | ||
|---|---|---|---|
| Level of study | |||
| College | Bachelor's | Master's, doctorate and professional | |
| percent | |||
| Employment income in 2018 (per $1,000) | 0.2Note ** | 0.2Note ** | 0.2Note ** |
| Size of student debt at graduation | |||
| Less than $5,000 | Note ...: not applicable | Note ...: not applicable | Note ...: not applicable |
| $5,000 to less than $10,000 | -19.2Note ** | -12.1Note ** | -13.8Note ** |
| $10,000 to less than $25,000 | -30.6Note ** | -27.9Note ** | -27.9Note ** |
| $25,000 or more | -45.7Note ** | -42.3Note ** | -41.1Note ** |
| Family situation | |||
| Couple, with children | -4.0 | -2.4 | -2.3 |
| Couple, no children | Note ...: not applicable | Note ...: not applicable | Note ...: not applicable |
| Single, with children | -15.6Note ** | -17.2Note ** | -4.3 |
| Single, no children | -2.5 | -2.1 | 1.7 |
| Province of residence three years after graduation | |||
| Newfoundland | -10.2Note *** | -11.1Note ** | -2.5 |
| Prince Edward Island | -9.6Note ** | -10.4Note ** | -8.3Note * |
| Nova Scotia | -7.8Note * | -15.3Note ** | -10.0Note ** |
| New Brunswick | -9.6Note ** | -6.9Note *** | -11.7Note ** |
| Quebec | -8.3Note ** | -11.4Note ** | -12.2Note ** |
| Ontario | Note ...: not applicable | Note ...: not applicable | Note ...: not applicable |
| Manitoba | -3.8 | -1.6 | -9.8Note ** |
| Saskatchewan | -5.6 | -4.7 | -13.2Note ** |
| Alberta | 1.3 | -4.1 | -4.7 |
| British Columbia | -9.9Note * | -3.7 | -3.0 |
| Territories | 28.6Note ** | 9.1 | -7.1 |
| Parents' level of educationTable 4 Note 1 | |||
| Less than high school | -2.1 | 1.9 | 1.6 |
| High school (ref.) | Note ...: not applicable | Note ...: not applicable | Note ...: not applicable |
| College or trades | -2.2 | 5.8Note * | 6.2Note * |
| University | 0.2 | 3.9 | 7.3Note ** |
| Source of debt | |||
| Percentage of student debt from loan from family or friends | 0.2Note ** | 0.1Note * | 0.1Note * |
| Percentage of student debt from bank loan or line of credit | 0.1Note ** | 0.0 | -0.1Note ** |
| Demographic characteristics | |||
| Female | -3.3 | -1.3 | 2.7 |
| Older than median age at graduation | -0.7 | -6.7Note ** | -6.6Note ** |
| Ever been a landed immigrant | 7.7Note *** | -1.1 | -3.1 |
| Visible minority status | -11.2Note ** | -1.0 | 1.5 |
| Aboriginal status | -5.3 | 1.7 | -1.1 |
| Has a disability | -6.6Note ** | -5.6Note * | -4.0Note * |
... not applicable
|
|||
Although some differences were observed across the three levels of study, the models show that factors—such as having a smaller debt size at graduation, a higher employment income, living in Ontario, being part of a couple with no children, and having student debt from a bank loan or line of credit, or a loan from family or friends—were all associated with relatively faster debt repayment after three years. In contrast, living in the Atlantic provinces or in Quebec,Note being a single parent, being a member of a visible minority group (college only), and having a disability all tended to be associated with slower student debt repayment.
As observed with the unadjusted data (Table 3), the amount of the debt at graduation was also an important factor. For example, three years after graduation, a bachelor’s degree holder with a debt of $25,000 or more at graduation would have repaid 42% less of their debt than their counterpart with a debt of less than $5,000 (Table 4). The debt reduction by debt size was similar across all levels of study.Note
In addition, results indicate that for every $1,000 of income earned, 0.2% of student debt was repaid. This means that if a bachelor’s degree holder earned $40,000 per year, 8% of their debt was repaid after three years (or 40 × 0.2%). The proportion repaid would be 16% for a bachelor’s degree holder who earned $80,000 per year (or 80 × 0.2%), assuming all other factors remain constant.
The impact of employment income on debt repayment was similar across all education levels. However, it is important to note that the effect measured only accounts for the annual employment income of the graduate at the time of the interview (in 2018), and does not account for breaks in employment in the three years following the graduation.
Parents’ level of education also made a difference for some categories of university graduates. Graduates with a parent that had a postsecondary credential generally repaid their debt faster. Graduates who owed money to family or friends, or to a bank or line of credit, also repaid a higher proportion of their debt, compared with graduates who owed money on a government-sponsored student loan.
Some factors were also associated with slower debt repayment. For example, being older than the median age of one’s graduating classNote was associated with a lower proportion of debt repayment at the bachelor’s level and at the master’s, doctorate and professional level. These graduates repaid almost 7% less of their student debt compared with their counterparts who were at or younger than the median age of their graduating class. It is possible that older graduates have other debt as a result of being at a later stage in life. This could be particularly true for graduates with master’s, doctorate and professional degrees, whose median ages were between 30 and 36 in 2018 (compared with 27 for college graduates and bachelor’s degree holders).
In addition, graduates at each level of study who lived in the Atlantic provinces and Quebec were more likely to have repaid a smaller proportion of their debt than those who lived in Ontario.Note
Reporting a disability was also associated with slower debt repayment. Being a landed immigrant or a member of a visible minority group resulted in slower debt repayment for college graduates only.
These results are those of the 2015 cohort, observed three years after graduation and may change depending on the cohort and the period that is being examined. Although it takes the majority of graduates more than three years to repay their student debt, a previous study showed that most graduates who defaulted on their student loans did so in the first three years after graduation.Note This suggests that the financial situation of graduates in the years immediately following graduation is important for debt repayment.
Conclusion
Between 2000 and 2015, one in two postsecondary graduates graduated with student debt. This proportion was similar for most levels of study throughout this 15-year period. The majority of graduates (95%) earned a credential at the college, bachelor’s or master’s level. The proportion of students who graduated with student debt tended to be lower among doctorate degree holders, at 36% in 2015, while 85% of professional degree holders graduated with student debt.
These results were based on the last four cycles of the National Graduates Survey, which also collects information on the amount of debt owed by graduates. For the majority of graduates, the median amount of student debt at graduation has remained relatively stable in real terms between 2000 and 2015, but tended to increase with the level of postsecondary education. College graduates had the lowest amount of student debt ($11,500 in 2015), followed by bachelor’s and master’s degree holders (around $20,000) and doctorate degree holders ($25,400). Given their higher tuition fees and many additional educational expenses, professional degree holders had the largest amount of student debt of all postsecondary graduates, at $60,300.
Field of study is also an important factor in the proportion of graduates with debt, and the level of student debt. The largest share of 2015 graduates who graduated with student debt were graduates of health and related studies programs. These graduates also had the largest amount of debt. This was the case for most levels of study within this field.
Government-sponsored student loans were the most common debt source among the 2015 graduates, with three in four graduates reporting this type of debt. Median debt at graduation was also highest for government-sponsored student loans, with a median of almost $15,000 in 2015. This might be partly explained by the fact that government-sponsored student loans have the advantage of not accumulating interest until after the student completes their education.
Of all 2015 postsecondary graduates who graduated with student debt, two-thirds had not fully repaid it by 2018. This proportion was similar across levels of study. Using a linear regression model on the repayment of the debt after three years, some factors were associated with faster and slower debt repayment. Despite some differences by level of study, factors such as a smaller debt size at graduation, higher employment income, living in Ontario and being part of a couple with no children were generally associated with a higher proportion of debt being repaid after three years. Conversely, higher levels of student debt, living in the Atlantic provinces or in Quebec, being a lone parent, graduating at a relatively older age and reporting a disability were associated with a lower proportion of debt being repaid after three years.
These results were collected between 2000 and 2018 and were therefore collected before the COVID-19 pandemic. Results from a Statistics Canada crowdsourcing initiative recently showed that, because of COVID-19, a majority of students were worried about their financial situation and their level of debt once they finished their studies. Future cycles of the NGS will be instrumental in shedding light on the impact of COVID-19 on the student debt of graduates.
Diane Galarneau and Laura Gibson are analysts at the Canadian Centre for Education Statistics at Statistics Canada.
Start of text box
Data source
The 2018 National Graduates Survey (NGS) collected information on individuals who graduated from a public postsecondary institution in Canada in 2015. The questions relate to educational pathways; the financing of postsecondary studies, including government-sponsored student loans; and the transition to the labour market. The target population for this survey is the 2015 postsecondary graduates who were residing in Canada at the time the survey was conducted in 2018.
This study focuses only on college and university graduates who did not pursue further education after graduation in 2015 (i.e., up to the time the NGS was conducted in 2018).
The NGS asks respondents whether they graduated their program with student debt and, if so, what the debt source was (i.e., government-sponsored student loan, bank loan or line of credit, or loan from family or friends that must be repaid). The NGS also asks how much of the debt to each source remained unpaid at the time of the interview, three years after graduation.
Limitations
The NGS is not appropriate for looking at Canadian and international students separately. The target population for the NGS corresponds to the graduates of the calendar year who were still living in Canada at the time of the interview (2 or 3 years after graduation depending on the cycle). Therefore, international students within the sample are not representative of international students as a proportion leaves the country after graduation.
Definitions
College level: Includes college and non-university certificates and diplomas, and diplomas or certificates from general and vocational colleges (CEGEPs).
Bachelor’s level: Includes bachelor’s degrees and university certificates and diplomas below the bachelor’s level.
Master’s level: Includes master’s degrees and university diplomas and certificates above the bachelor level, including MBAs.
Professional level: Includes bachelor’s degrees and university certificates or diplomas above the bachelor’s level in medicine, dentistry, veterinary medicine, optometry and pharmacy.
Employment income: Annual salary including tips and commissions, before taxes and all other deductions, for the job held during the week prior to the 2018 NGS, received by 2015 postsecondary graduates who did not pursue further education. When earnings are reported as an hourly rate, they are annualized using a standard weekly work schedule.
End of text box
- Date modified: