
Insights on Canadian Society
Work-integrated learning during postsecondary studies, 2015 graduates
by Diane Galarneau, Mark Kinack and George Marshall

Skip to text
Text begins
Start of text box
Based on data from the 2018 National Graduates Survey, this study examines the participation of 2015 postsecondary graduates in work-integrated learning (WIL), such as a co-op placement, internship, practicum or clinical placement. This study examines, among other things, whether there is a link between participation in WIL and the labour market outcomes of graduates, three years after graduation.
- Among the 2015 postsecondary graduates who did not pursue further education, one-half participated in WIL during their postsecondary studies (50%).
- College graduates were most likely to have participated in WIL (61%). The participation rate decreased to 49% for bachelor’s graduates, 37% for master’s graduates and 19% for doctoral graduates.
- Participating in WIL was not associated with a higher probability of being employed three years after graduation, although postsecondary graduates who had participated in WIL were more likely to have employment related to their field of study.
- Those who participated in WIL were less likely to be overqualified for the job they held three years after graduation. For example, among bachelor’s graduates, 32% of those who participated in WIL were overqualified for their job, compared with 49% among non-participants.
- Bachelor’s graduates who participated in WIL had higher employment earnings than those who did not participate in WIL. A difference in employment earnings of 7% was observed between these two groups among all employed bachelor’s graduates, as well as bachelor’s graduates who worked full time.
End of text box
Introduction
Work-integrated learning (WIL)—which can be a co-op or non-co-op work placement, internship, practicum or clinical placement during postsecondary studies—is part of an educational model that combines formal classroom instruction with labour market experience. By providing students with relevant work experience, participation in WIL could help new graduates find a good-quality job related to their studies after graduation. Employers who offer WIL opportunities would also appear to receive certain benefits, with access to skilled labour, often at a lower cost.Note These employers can also find good candidates to hire over the longer term. Recognizing the importance of WIL, the federal government has made ongoing investments in these programs since 2016.Note
Previously, in the National Graduates Survey (NGS), WIL was only associated with co-op placements—where students alternate between periods of in-class study and paid work placements. Some studies on WIL, based on data from previous NGS cycles, examined the participation of graduates in co-op placements (with a focus on the integration of graduates into the labour market).Note
Beginning with the 2018 NGS, the concept of WIL was expanded to also include internships, practicums, clinical placements and other types of work placements that offer field experience (for more information, see the 2018 NGS). Based on 2018 NGS data, graduates who participated in co-op placements accounted for about one-third of all participants in WIL, which is why it is important to consider the other forms.Note
Using 2018 NGS data, this study examines the participation of the 2015 postsecondary graduates in WIL during their studies, by various demographic characteristics. An attempt was also made to determine whether there is a link between the participation of graduates in WIL during their studies and their labour market outcomes three years after graduation.Note For the first time, the expanded NGS definition of WIL will be used for the analysis.
One in two 2015 postsecondary graduates participated in work-integrated learning during their studies
Of all the 2015 postsecondary graduates, 60% (or 250,000) did not pursue further education in the three years following graduation. Of these, 50% (126,000 graduates) reported having participated in WIL during their postsecondary studies.Note
College graduates were the most likely to have participated in WIL during their studies, with a participation rate of 61% (Table 1). Although they made up 37% of all postsecondary graduates who did not pursue further education after 2015, they accounted for 45% of graduates who participated in WIL.
| Education level | ||||
|---|---|---|---|---|
| College | Bachelor's | Master's | Doctorate | |
| percent | ||||
| Total | 60.7 | 48.7 | 36.7 | 18.6 |
| Men | 47.9Note * | 43.3Note * | 27.6Note * | 14.7Note * |
| Women (ref.) | 70.7 | 52.5 | 43.0 | 23.0 |
| Age group | ||||
| Younger than 25 years | 62.1 | 45.3 | 33.4 | Note x: suppressed to meet the confidentiality requirements of the Statistics Act |
| 25 to 29 years (ref.) | 62.3 | 50.5 | 47.0 | 33.7 |
| 30 to 39 years | 59.3 | 47.7 | 33.8Note * | 19.9Note * |
| 40 years and older | 57.0 | 40.0Note * | 25.2Note * | 14.4Note * |
| Field of study | ||||
| Education | 81.5 | 92.0Note * | 24.0Note * | 9.2Note * |
| Visual and performing arts, and communications technologies | 52.5Note * | 30.3Note * | 23.5Note * | 14.6 |
| Humanities | 38.2Note * | 18.7Note * | 32.4Note * | 9.3Note * |
| Social and behavioural sciences and law | 81.9Note * | 28.6Note * | 41.5Note * | 41.6Note * |
| Business, management and public administration | 50.4Note * | 29.7Note * | 34.2Note * | 7.6Note * |
| Physical and life sciences and technologies | 53.1Note * | 26.8Note * | 18.2Note * | 10.9Note * |
| Mathematics, computer and information sciences | 52.7Note * | 47.3Note * | 33.7Note * | 18.3 |
| Architecture, engineering and related technologies | 42.1Note * | 64.6Note * | 19.3Note * | 14.3Note * |
| Agriculture, natural resources and conservation | 46.6Note * | 41.8Note * | 41.3Note * | 14.0Note * |
| Health and related fields (ref.) | 88.2 | 84.3 | 74.4 | 18.1 |
| Personal, protective and transportation services | 51.9Note * | 50.8Note * | 28.0Note * | Note x: suppressed to meet the confidentiality requirements of the Statistics Act |
| Other fields | 29.4Note * | 21.3Note * | 47.4Note * | 29.2Note * |
| Province of study | ||||
| Newfoundland and Labrador | 58.5 | 59.2Note * | 21.9Note * | 17.3 |
| Prince Edward Island | 74.4Note * | 55.4Note * | 36.0 | Note x: suppressed to meet the confidentiality requirements of the Statistics Act |
| Nova Scotia | 89.3Note * | 49.4 | 39.6 | 20.3Note * |
| New Brunswick | 88.9Note * | 44.4 | 35.8 | 26.7Note * |
| Quebec | 66.6Note * | 49.6 | 33.8Note * | 26.0Note * |
| Ontario (ref.) | 57.2 | 45.3 | 41.0 | 15.0 |
| Manitoba | 65.3Note * | 53.6Note * | 38.6 | 13.3 |
| Saskatchewan | 64.7 | 55.3Note * | 30.4Note * | 14.7 |
| Alberta | 59.0 | 54.2Note * | 31.3Note * | 14.3 |
| British Columbia | 52.3 | 49.6 | 37.7 | 18.9Note * |
| Immigrant statusTable 1 Note 1 | ||||
| Yes (ref.) | 53.4 | 39.1 | 29.8 | 14.7 |
| No | 62.7Note * | 51.2Note * | 39.8Note * | 21.2Note * |
| Indigenous identityTable 1 Note 2 | ||||
| Yes (ref.) | 63.8 | 57.7 | 45.8 | 23.7 |
| No | 60.4 | 48.5 | 36.5 | 18.6 |
| Has a disability | ||||
| Yes (ref.) | 67.6 | 49.4 | 41.5 | 16.5 |
| No | 58.5Note * | 48.5 | 35.7Note * | 19.1Note * |
x suppressed to meet the confidentiality requirements of the Statistics Act
|
||||
WIL participation rates decreased as level of education increased: participation rates were 49% among bachelor’s graduates, 37% among master’s graduates and 19% among doctoral graduates. It should be noted that graduates who worked for a university professor as a research or teaching assistant were not deemed to have participated in WIL, despite the fact that both positions are considered work experience generally related to the program of study. The lower participation rates of master’s and doctoral graduates could be explained, in part, by the greater tendency of graduate students to have held this type of job during their studies.
Participation rates varied significantly across provinces. Nova Scotia and New Brunswick had particularly high participation rates—89% of college graduates from these provinces participated in WIL, compared with 57% of Ontario college graduates.
Women were overrepresented among participants in WIL. They accounted for 65% of graduates who participated in WIL programs (81,900 women), although they made up 58% of graduates who did not pursue further postsecondary studies. Higher participation rates for women were recorded for each level of postsecondary education. However, the largest gap was observed among college graduates: 71% of women with this level of education had participated in WIL, compared with 48% of men. These differences by sex were related, in part, to the concentration of women in certain fields of study, such as health and related fields and education, where work placements are often required for graduation.Note
The participation rate of postsecondary graduates in WIL varied greatly by field of study. At the college and bachelor’s levels, graduates in health and related fields and education programs stood out, with participation rates ranging from 82% to 92%. At the college level, graduates in the field of social and behavioural sciences and law also had a relatively high participation rate, at 82%.
At the bachelor’s level, graduates in the field of architecture, engineering and related technologies had a higher-than-average participation rate (65%, almost 16 percentage points higher than the 49% observed for all bachelor’s graduates). Humanities graduates had the lowest participation rate at the bachelor’s level (19%).
Among master’s graduates, those in health and related fields had participation rates that were significantly higher than the average (74%, double the proportion recorded for all master’s graduates). In contrast, graduates in the field of physical and life sciences and technologies had the lowest participation rate (18%).
Lastly, among doctoral graduates, those in the field of social and behavioural sciences and law were most likely to have participated in WIL during their studies (42%). In comparison, 8% of doctoral graduates in business, management and public administration participated in WIL.
In terms of sociodemographic characteristics, the WIL participation rate was generally lower among immigrants. However, the participation rate tended to be higher for persons with disabilities at the college and master’s levels.
Participants in work-integrated learning are more likely to find work related to their field of study
In the 2018 NGS, the majority (almost two-thirds) of postsecondary graduates who participated in WIL indicated that their placement helped them find a job after graduation.
The success of graduates in the labour market depends on a combination of factors that are not always observable. Characteristics such as sex, age, level of education, field of study and economic situation are relatively easy to determine and measure. However, the same cannot be said for talent, motivation, personal ambition, oral and written communication skills, mathematics skills, networking ability, and other characteristics that are unique to each person. While all of these characteristics may explain the relative success of graduates in the labour market, not all of them can be measured using existing surveys.Note
Nevertheless, it is possible to establish certain correlations and to measure their significance using statistical techniques. Regression models that simultaneously took into account multiple personal characteristics were used to produce seven indicators reflecting the labour market outcomes of 2015 postsecondary graduates (by WIL participation). For this analysis, graduates in health and related fields and education were excluded. In these two fields of study, participation in WIL is, for most students, required for graduation (the group “not participating in WIL” was therefore too small to be used for comparison purposes). Furthermore, master’s graduates and doctoral graduates were combined into one group for this analysis.
Labour market outcome indicators are observed three years after graduation, in 2018 (Table 2). These labour market outcome indicators are adjusted to account for differences in the observable characteristics of graduates. The analyses also take into account whether participants had paid employment or volunteered during their postsecondary studies (for a complete list of all factors, see the text box Data sources, methods and definitions).
| Education level | |||
|---|---|---|---|
| College | Bachelor's | Master's and doctorate | |
| percent | |||
| Employment rate | |||
| Participation in WIL | 87.4 | 92.4 | 93.8Note * |
| No participation in WIL (ref.) | 89.6 | 90.4 | 91.7 |
| Full-time employment rate | |||
| Participation in WIL | 79.5 | 86.9 | 86.7 |
| No participation in WIL (ref.) | 81.3 | 84.4 | 87.2 |
| Permanent employment | |||
| Participation in WIL | 72.0 | 76.5 | 71.0 |
| No participation in WIL (ref.) | 70.5 | 77.0 | 72.2 |
| Perception that job was somewhat or closely related to field of study | |||
| Participation in WIL | 78.1Note * | 88.4Note * | 92.1Note * |
| No participation in WIL (ref.) | 70.2 | 71.0 | 88.3 |
| Had a higher level of education than the level required by the job | |||
| Participation in WIL | 39.1Note * | 31.8Note * | 58.1Note * |
| No participation in WIL (ref.) | 47.9 | 48.9 | 70.5 |
| dollars | |||
| Employment income | |||
| Participation in WIL | 44,600 | 57,900Note * | 69,700Note * |
| No participation in WIL (ref.) | 45,400 | 54,100 | 73,000 |
| Full-time employment income | |||
| Participation in WIL | 46,600 | 59,900Note * | 72,300 |
| No participation in WIL (ref.) | 47,800 | 56,000 | 74,600 |
Source: National Graduates Survey, 2018. |
|||
The results revealed that participation in WIL was not associated with a higher probability of holding a job, having a full-time job or having permanent employment three years after graduation. The differences between the two groups were either small or insignificant, in terms of these indicators.
However, participation in WIL was associated with a higher probability of graduates working in a job related to their field of study. Furthermore, 2015 graduates who participated in WIL during their studies were less likely to be overqualified for their job in 2018. These results were found for the three levels of education examined, but differences among bachelor’s graduates were relatively more significant.
For example, 88% of bachelor’s graduates who participated in WIL reported finding a job that they felt was related to their field of study, compared with 71% of their counterparts who did not participate in WIL. Similarly, bachelor’s graduates who participated in WIL were less likely to be overqualified for their job (32%) than their counterparts who did not participate in WIL (49%).
However, the results varied by field of study. At the bachelor’s level, the overqualification rate for graduates in mathematics, computer and information sciences was 32 percentage points lower when graduates had participated in WIL (Chart 1).Note In contrast, the smallest gap between participants and non-participants was observed among graduates in visual and performing arts, and communications technologies (and the difference was not significant).
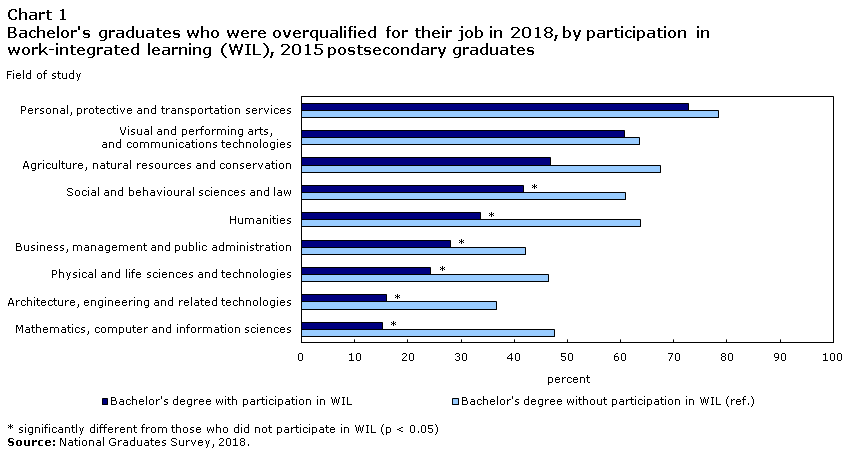
Data table for Chart 1
| Field of study | Bachelor's degree without participation in WIL (ref.) | Bachelor's degree with participation in WIL |
|---|---|---|
| percent | ||
| Personal, protective and transportation services | 78.5 | 72.8 |
| Visual and performing arts, and communications technologies | 63.6 | 60.8 |
| Agriculture, natural resources and conservation | 67.5 | 46.9 |
| Social and behavioural sciences and law | 60.9 | 41.8Note * |
| Humanities | 63.8 | 33.7Note * |
| Business, management and public administration | 42.1 | 28.0Note * |
| Physical and life sciences and technologies | 46.4 | 24.3Note * |
| Architecture, engineering and related technologies | 36.7 | 15.9Note * |
| Mathematics, computer and information sciences | 47.6 | 15.3Note * |
|
||
Similarly, in terms of the proportion of bachelor’s graduates who reported occupying a job related to their field of study, the gap between participants and non-participants was highest among humanities graduates (Chart 2) (54 percentage points). However, among graduates in business, management and public administration, participation in WIL was less strongly associated with the likelihood of occupying a job related to their field of study three years after graduation (gap of 7 percentage points between participants and non-participants).
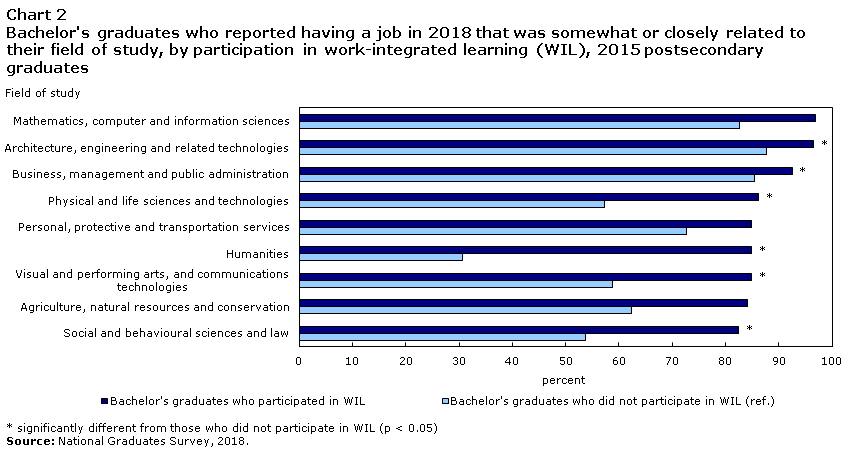
Data table for Chart 2
| Field of study | Bachelor's degree without participation in WIL | Bachelor's degree with participation in WIL |
|---|---|---|
| percent | ||
| Mathematics, computer and information sciences | 82.6 | 96.9 |
| Architecture, engineering and related technologies | 87.7 | 96.5Note * |
| Business, management and public administration | 85.5 | 92.5Note * |
| Physical and life sciences and technologies | 57.2 | 86.1Note * |
| Personal, protective and transportation services | 72.7 | 84.8 |
| Humanities | 30.6 | 84.8Note * |
| Visual and performing arts, and communications technologies | 58.7 | 84.8Note * |
| Agriculture, natural resources and conservation | 62.3 | 84.1 |
| Social and behavioural sciences and law | 53.8 | 82.4Note * |
|
||
Higher employment earnings among bachelor’s graduates who participated in work-integrated learning
Among college graduates, there was no salary gap between those who participated in WIL and those who did not, despite the fact a smaller percentage of participants in WIL were overqualified for their job.
In contrast, bachelor’s graduates who participated in WIL had higher annual salaries than those who did not. In fact, there was a difference of 7% among all employed bachelor’s graduates and those working full time.Note While participation in WIL may have a positive impact on employment earnings, results should be interpreted with caution. This result could also be attributed to unobserved skills. To participate in WIL, students must meet certain conditions, which often include maintaining an overall grade above a certain level.
Among master’s and doctoral graduates, the adjusted employment income of participants in WIL was lower than that of non-participants. For these levels, participation in WIL could capture negative selection effects. Unlike what is observed at the bachelor’s level, participation in WIL may be a less attractive option in general at the graduate levels. Similarly, since research or teaching assistant positions are not included in WIL, the effect of these jobs on the labour market outcomes of master’s and doctoral graduates could not be captured. At the master’s and doctoral levels, the best students are often highly coveted by professors. For students, holding a position as a research or teaching assistant can open the door to good jobs in their field of study after graduation.
Conclusion
Among the 2015 postsecondary graduates, 50% reported having participated in WIL as part of their program of study. WIL participation during postsecondary studies decreased as level of education increased—participation rates went from 61% among college graduates to 19% among doctoral graduates.
Women were overrepresented among participants, in part because of their concentration in certain fields of study—such as health and related fields and education—where placements are often required for graduation.
It is important to understand the links between participation in WIL and the labour market outcomes of graduates given the significant investments in time and money made by graduates, their families and society in general.
WIL participation is not associated with a higher probability of being employed three years after graduation, but is associated with some key job quality indicators. In particular, the 2015 postsecondary graduates who participated in WIL were more likely to feel that they were employed in their field of study, and less likely to be overqualified for their job. This was true at the college, bachelor’s, master’s and doctoral levels. However, the largest gaps were observed among bachelor’s graduates: 88% of participants in WIL reported having a job related to their field of study, compared with 71% among non-participants; nearly 32% of bachelor’s graduates who participated in WIL were overqualified in their jobs, compared with 49% of their non-participating counterparts.
There was also a gap in annual employment income among bachelor’s graduates, for all employees and for full-time employees. These results are consistent with those of similar studies. It should be noted, however, that the definition of WIL during postsecondary studies may have impacted the results. Furthermore, the results of this study are based on one cohort of graduates (in 2015), which has been observed three years after graduation (in 2018). More research will be needed to confirm if similar results are obtained with future cohorts of graduates.
Diane Galarneau and George Marshall are analysts at the Canadian Centre for Education Statistics and Mark Kinack is the manager of the National Graduates Survey in the same division.Start of text box
Data sources
The 2018 National Graduates Survey (NGS) collected information on individuals who graduated from a public postsecondary institution in Canada in 2015. The questions related to educational pathways, the financing of postsecondary studies, including government student loans, and the transition to the labour market. The target population for this survey was the 2015 postsecondary graduates who were still residing in Canada at the time the survey was conducted in 2018.
For the first time, the 2018 NGS included 12 new questions on work-integrated learning (WIL), in addition to the content on participation in co-op programs that was already part of the NGS from 1986 to 2013. The NGS questions on WIL focused specifically on work placements that were part of the graduate’s program such as co-op programs, internships, practicums, clinical placements, field experience, community service learning, and other work placements that were part of the graduate’s postsecondary program. The NGS definition of WIL excluded work placements or experiences that were not part of the graduate’s program, such as Federal Student Work Experience Program placements, research and teaching assistantships, and work related to master’s or doctoral theses. Although apprenticeships are typically also considered WIL, they were excluded from the 2018 NGS since graduates of apprenticeship programs were excluded from the survey’s target population.
This study focuses only on college and university graduates who did not pursue further education after graduation in 2015 (i.e., up to the time the NGS was conducted in 2018). It should be noted that the profile of graduates who participated in WIL was similar, regardless of whether graduates pursued further education. Graduates may have participated in more than one type of WIL, but only the work placement with the longest duration was included in the survey.
Definitions
College: Includes college and other non-university certificates and diplomas (including collège d'enseignement général et professionnel (CEGEP)).
Bachelor’s: Includes bachelor’s degrees, degrees in medicine, dentistry, veterinary medicine and optometry, university certificates and diplomas below bachelor’s degrees.
Master’s: Includes master’s degrees, university certificates and diplomas above bachelor’s degrees.
Employment rate: Proportion of 2015 postsecondary graduates who did not pursue further education and who were employed or had a business in the week prior to the 2018 NGS.
Full-time employment rate: Proportion of 2015 postsecondary graduates who did not pursue further education and who worked full time (at least 30 hours per week) in a job or business the week before the 2018 survey.
Permanent employment: Proportion of 2015 postsecondary graduates who did not pursue further education and were employed permanently in the week prior to the 2018 NGS.
Job somewhat or closely related to the 2015 field of study: Proportion of 2015 postsecondary graduates who did not pursue further education who reported being employed in the week preceding the 2018 NGS and who reported that this job was somewhat or closely related to their 2015 field of study.
Overqualification: Proportion of 2015 postsecondary graduates who did not pursue further education, who reported being employed in the week prior to the 2018 NGS and were overqualified for their job. Overqualified graduates are those whose level of education is above the level of qualification they believe was required to get their job.
Employment income: Annual salary including tips and commissions, before taxes and all other deductions, for the job held during the week prior to the 2018 NGS, received by 2015 postsecondary graduates who did not pursue further education. When earnings are reported as an hourly rate, they are annualized using a standard weekly work schedule.
Full-time employment income: Annual salary as defined above, for employees who reported working full time (at least 30 hours per week).
Regression analysis
Regression models were used to measure whether participation in WIL during postsecondary studies is associated with more favourable labour market indicators three years after graduation, compared with non-participation. Since most graduates from health and related fields and education must participate in some form of WIL to graduate, they were excluded from the analysis. Separate models were estimated for each level of education, and the master’s and doctoral levels were combined because of the low number of doctoral graduates. The following indicators were examined:
- The probability of being employed
- The probability of full-time employment
- The probability of permanent employment
- The probability of having a job which the graduate considers somewhat related or closely related to their 2015 postsecondary program
- The probability of having a job for which the graduate is overqualified
- The average level of employment earnings of employees
- The average level of employment earnings of full-time employees
For each of these models, in addition to the dichotomous variable on participation or non-participation in WIL, the following variables were taken into account: having a paid job during postsecondary studies, participating in volunteer activities during postsecondary studies, sex, age, immigration status, being part of a visible minority group, being part of an Indigenous group, having a disability, field of study, province of residence at the time the survey was conducted in 2018, and parents’ level of education.
End of text box
Start of text box
In addition to participating in WIL, a large proportion of students work at a paid job during their studies, or participate in volunteer activities on their own initiative. Paid work and volunteering are also likely to help graduates enter the labour market since they provide students with hands-on experience that is not formally integrated into their program.
A breakdown of the participation of graduates in these activities was examined (Table 3). A large proportion of 2015 postsecondary graduates (40%) combined participation in WIL with paid work or volunteering, while 10% participated only in WIL. Conversely, 42% of graduates did not participate in WIL, but had paid employment or volunteered, and 8% did not participate in any of these activities. Participation in these activities varied by level of education. However, for each level of education, a small proportion of graduates participated only in WIL or did not participate in any of these activities.
| Education level | |||||
|---|---|---|---|---|---|
| College | Bachelor's | Master's | Doctorate | Total | |
| percent | |||||
| Total | 100 | 100 | 100 | 100 | 100 |
| Participation in WIL only | 14.8 | 7.5 | 7.3 | 3.5 | 10.1 |
| Participation in WIL and paid work or volunteering | 45.9 | 41.2 | 29.4 | 15.1 | 40.3 |
| Paid work or volunteering, no participation in WIL | 29.2 | 46.1 | 53.4 | 64.5 | 41.5 |
| None of these activities | 10.1 | 5.3 | 9.9 | 16.9 | 8.1 |
| Source: National Graduates Survey, 2018. | |||||
End of text box
- Date modified: