
 StatCan COVID-19: Data to Insights for a Better Canada Impact of COVID-19 on food services and drinking places, first quarter of 2021

Archived Content
Information identified as archived is provided for reference, research or recordkeeping purposes. It is not subject to the Government of Canada Web Standards and has not been altered or updated since it was archived. Please "contact us" to request a format other than those available.
by Shivani Sood
Text begins
In March 2020—and continuing throughout the month of April—government interventions were put in place as a result of the COVID-19 pandemic, during which time provinces restricted access to and implemented closures of non-essential businesses. These measures severely impacted many businesses, particularly those in the food services and drinking places subsector which was one of the hardest hit by public safety measures. Since then, the industry has experienced constant challenges, exacerbated by the need to adapt in light of repeated re-openings and shutdowns as a result of fluctuations in the number of COVID-19 cases across the country.
By May 2020, employment in the subsector dropped 55.8% (-635,515) from pre-pandemic levels observed in February 2020 and remained one-third lower (-29.3%; -336,667) in December 2020 compared with February 2020.Note As of December 2020, food services and drinking places accounted for 5.6% of all employer businesses in Canada.Note
Real gross domestic product (GDP) of food services and drinking places fell 39.5% in March 2020 and by another 40.8% in April 2020Note as many of these businesses either closed completely or operated at a greatly reduced capacity, providing take-out or delivery services exclusively. In fact, more than half (56%) of food service and drinking place operators reported being closed at some point last April, while 41% reported being closed for the entire month.Note
By the end of April 2020, sales in the food services and drinking places subsector fell 61.3% from pre-pandemic levels observed in February 2020. Sales grew steadily as restrictions were eased through the spring and summer before dropping 18.3% from September to December 2020, as the resurgence of COVID-19 prompted the re-implementation of restrictions in several provinces.Note
By the end of 2020, the Canadian economy had endured nearly a full year of COVID-19 effects, and food services and drinking places were adapting to the new reality by operating at a greatly reduced capacity, shifting to take-out and delivery services, laying off staff, and applying for government funding among other things.
From mid-January to mid-February 2021, Statistics Canada conducted the Canadian Survey on Business Conditions to better understand the ongoing effects of the pandemic on businesses and business expectations moving forward. This article provides insights on those expectations, as well as on specific realities faced by food services and drinking places. Based on the results of this survey, the majority of food services and drinking places expect profitability to decline in the short term, are uncertain of how long they can continue operating before considering closure or bankruptcy, and are unable to take on more debt. A significant proportion of food services and drinking places experienced a decline of 40% or more in revenue in 2020 compared with 2019 and over three-quarters were approved for or received some form of funding because of the pandemic.
Food services and drinking places adapt to repeated re-openings and shutdowns
With restrictions placed on in-person dining coupled with a reluctance from consumers to dine-in, food services and drinking places have shifted to contactless delivery and take-out and made investments to expand their online sales capabilities. Over half (50.7%) of food services and drinking places reported they were likely or very likely to permanently adopt contactless delivery or pickup options. Over one-quarter (27.5%) of food services and drinking places have an online sales platform or plans to implement one. Notably, in 2020 nearly one-fifth (19.4%) of food services and drinking places made 30% or more of their total sales online, more than double the proportion that did in 2019 (9.1%).
Furthermore, food services and drinking places have adjusted their business operations keeping in line with government regulations and recommendations. These businesses have increased expenditures on personal protective equipment and on implementing measures to keep customers and employees safe. Almost all (96.0%) food services and drinking places have increased expenditures on sanitization and cleaning and 87.8% have increased expenditures on personal protective equipment and supplies.
Over 90% of food services and drinking places provide facemasks, gloves or other personal protective equipment to employees (93.0%), provide hand sanitizer to employees and customers (92.7%), and frequently clean high-touch areas or surfaces (91.2%). In addition, over 80% of food services and drinking places insist employees displaying any signs of illness stay home (84.6%) and restrict the number of people allowed into the space (80.9%).
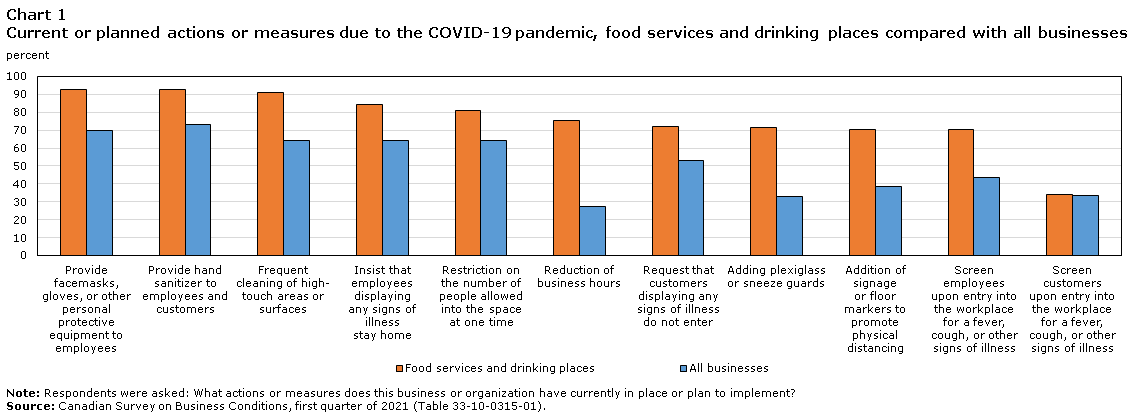
Data table for Chart 1
| All businesses | Food services and drinking places | |
|---|---|---|
| percent | ||
| Provide facemasks, gloves, or other personal protective equipment to employees | 70.1 | 93.0 |
| Provide hand sanitizer to employees and customers | 73.0 | 92.7 |
| Frequent cleaning of high-touch areas or surfaces | 64.1 | 91.2 |
| Insist that employees displaying any signs of illness stay home | 64.5 | 84.6 |
| Restriction on the number of people allowed into the space at one time | 64.5 | 80.9 |
| Reduction of business hours | 27.3 | 75.2 |
| Request that customers displaying any signs of illness do not enter | 53.0 | 72.3 |
| Adding plexiglass or sneeze guards | 33.2 | 71.3 |
| Addition of signage or floor markers to promote physical distancing | 38.5 | 70.6 |
| Screen employees upon entry into the workplace for a fever, cough, or other signs of illness | 43.4 | 70.4 |
| Screen customers upon entry into the workplace for a fever, cough, or other signs of illness | 33.7 | 34.1 |
|
Note: Respondents were asked: What actions or measures does this business or organization have currently in place or plan to implement? Source: Canadian Survey on Business Conditions, first quarter of 2021 (Table 33-10-0315-01). |
||
Overwhelming majority of food services and drinking places reported lower revenue in 2020 compared with 2019
Over four-fifths (86.5%) of food services and drinking places experienced a decrease in revenue in 2020 compared to three-fifths (60.5%) of all businesses. A decline in revenue of 40% or more in 2020 was a reality for over two-fifths (42.9%) of food services and drinking places, with those in Quebec (50.9%), Manitoba (47.9%) and Ontario (44.9%) most likely to see this level of loss. Relatively few proportions of food services and drinking places had unchanged revenues (5.5%) or saw their revenues increase (6.7%) in 2020 compared with 2019. In contrast, just under one-fifth (19.2%) of all businesses experienced a decline in revenue of 40% or more in 2020, over one-fifth (20.7%) saw revenues unchanged and nearly one-fifth (18.1%) saw revenues increase.
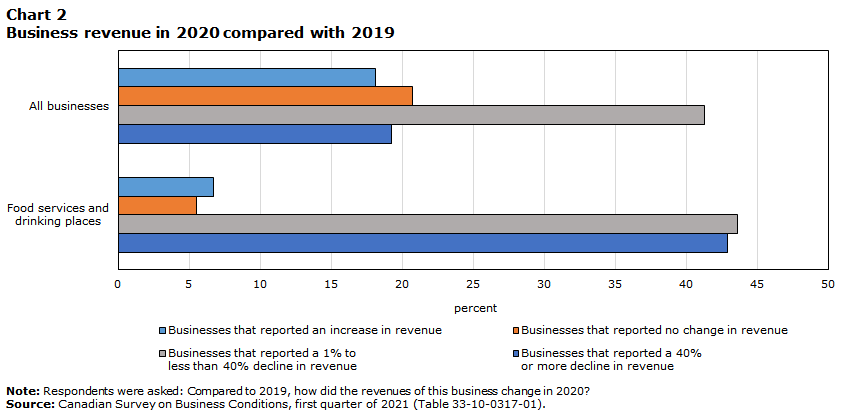
Data table for Chart 2
| All businesses | Food services and drinking places | |
|---|---|---|
| percent | ||
| Businesses that reported an increase in revenue | 18.1 | 6.7 |
| Businesses that reported no change in revenue | 20.7 | 5.5 |
| Businesses that reported a 1% to less than 40% decline in revenue | 41.3 | 43.6 |
| Businesses that reported a 40% or more decline in revenue | 19.2 | 42.9 |
|
Note: Respondents were asked: Compared to 2019, how did the revenues of this business change in 2020? Source: Canadian Survey on Business Conditions, first quarter of 2021 (Table 33-10-0317-01). |
||
Many food services and drinking places anticipate losses to continue into the near future
Nearly three-fifths (56.6%) of food services and drinking places expected their profitability would decrease over the next three monthsNote compared with just over two-fifths (41.8%) of all businesses. Nearly one-third (29.8%) of food services and drinking places expected profitability to remain the same, while 8.5% expected their profitability to increase.
Furthermore, approximately half (49.7%) of food services and drinking places expected lower sales over the three months that followed compared with nearly one-third (30.6%) of all businesses. Over one-third (35.3%) of food services and drinking places expected sales to stay about the same.
The decline in travel and its impact on the tourism industry, Note combined with reluctance from consumers to dine indoors and changing government restrictions have increased uncertainty for food services and drinking places. Approximately half of Canadians reported that they expected to spend less on eating at a restaurant compared to prior to the pandemic, while 31% expected to spend less on ordering take-out food. Note Around half of food services and drinking places expected insufficient demand (51.7%) and fluctuations in demand (46.8%) to be obstacles for their business over the next three months. In addition, government regulations were an obstacle expected for nearly two-fifths (38.0%) of food services and drinking places and over one-fifth (21.7%) expected travel restrictions to be an obstacle over the following three months.
Majority of food services and drinking places uncertain of business survival
At their current level of revenue and expenditures, over half (51.2%) of food services and drinking places do not know how long they can continue to operate before considering closure or bankruptcy. Over one-quarter (26.2%) reported that they can continue to operate for less than 12 months before considering closure or bankruptcy, compared with one-tenth (10.3%) of all businesses.
Nearly half (47.6%) of food services and drinking places do not know how long they can continue to operate at their current level of revenue and expenditures before considering laying off staff, similar to the proportion of all businesses (46.4%). Nearly two-fifths (36.6%) of food services and drinking places can continue to operate at their current level of revenue and expenditures for less than 12 months before considering laying off staff compared with just over one-fifth (21.3%) of all businesses.
In the short term, nearly one-third (29.9%) of food services and drinking places expected their number of employees to decrease over the next three months, compared with just over one-fifth (20.3%) that reported the same last cycle.Note In contrast, over one-tenth (11.7%) of all businesses expected their number of employees to decrease over the next three months. Nearly three-fifths (57.5%) of food services and drinking places expected to have the same number of employees over the next three months, compared with 70.6% of all businesses.
Majority of food services and drinking places cannot take on more debt
Over half (54.0%) of food services and drinking places reported that they did not have the ability to take on more debt, up from less than half (46.1%) of food services and drinking places last cycle. Note Maintaining sufficient cash flow or managing debt was an obstacle expected over the following three months by over two-fifths (43.0%) of food services and drinking places, whereas just under one-quarter (24.2%) of all businesses expected the same.
In response to the challenges experienced by businesses due the pandemic, various government programs focusing on funding or credit were made available to support businesses. Nearly all (92.1%) food services and drinking places were approved for or received some form of funding or credit because of the COVID-19 pandemic compared with under three-quarters (73.3%) of all businesses.
The Canada Emergency Business Account (CEBA) provides eligible small businesses and non-profit organizations with a loan of up to $40,000 and is designed to help cover operating costs. The Canada Emergency Wage Subsidy (CEWS) is a subsidy of 75% of employee wages for eligible businesses to re-hire staff they had laid off previously as a result of COVID-19 and prevent further job losses. The Temporary 10% Wage Subsidy for Employers is a three-month measure allowing eligible employers to reduce the amount of payroll deductions required to be remitted to the Canada Revenue Agency.
Almost four-fifths (78.5%) of food services and drinking places were approved for or received the CEBA compared with over half (54.3%) of all businesses. Just over three-fifths (60.5%) of food services and drinking places were approved for or received the CEWS, compared with over one-third (34.6%) of all businesses. Under one-third of food services and drinking places (29.3%) were approved for or received the Temporary 10% Wage Subsidy for Employers compared with just over one-fifth (20.4%) of all businesses.
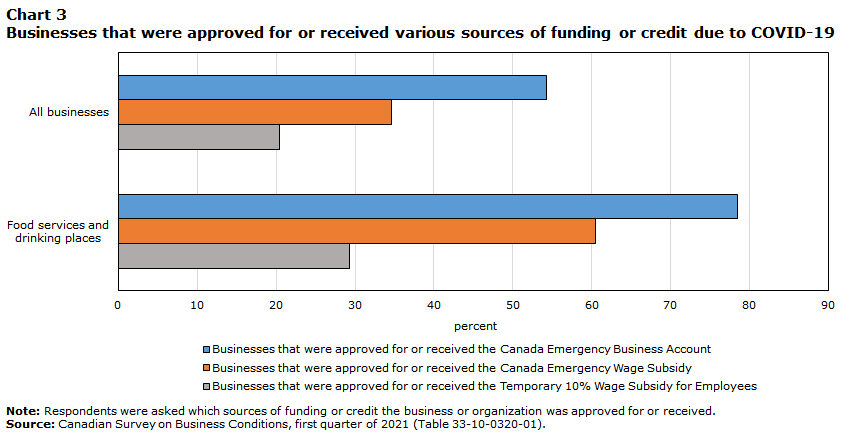
Data table for Chart 3
| All businesses | Food services and drinking places | |
|---|---|---|
| percent | ||
| Businesses that were approved for or received the Canada Emergency Business Account | 54.3 | 78.5 |
| Businesses that were approved for or received the Canada Emergency Wage Subsidy | 34.6 | 60.5 |
| Businesses that were approved for or received the Temporary 10% Wage Subsidy for Employees | 20.4 | 29.3 |
|
Note: Respondents were asked which sources of funding or credit the business or organization was approved for or received. Source: Canadian Survey on Business Conditions, first quarter of 2021 (Table 33-10-0320-01). |
||
Methodology
From January 11 to February 11, 2021, representatives from businesses across Canada were invited to take part in an online questionnaire about how COVID-19 is affecting their business and business expectations moving forward. The Canadian Survey on Business Conditions uses a stratified random sample of business establishments with employees classified by geography, industry sector, and size. An estimation of proportions is done using calibrated weights to calculate the population totals in the domains of interest. The total sample size for this iteration of the survey is 32,400 and results are based on responses from a total of 15,431 businesses, 795 of which were food services and drinking places.
References
Statistics Canada. (2021). “Canadian Survey on Business Conditions, first quarter of 2021” The Daily, March 5 2021. Catalogue no. 11-001-X. https://www150.statcan.gc.ca/n1/daily-quotidien/210305/dq210305b-eng.htm
- Date modified: