
Economic Insights
The Economic Impact of Travel Restrictions on the Canadian Economy due to the COVID-19 Pandemic

Archived Content
Information identified as archived is provided for reference, research or recordkeeping purposes. It is not subject to the Government of Canada Web Standards and has not been altered or updated since it was archived. Please "contact us" to request a format other than those available.
Skip to text
Text begins
This Economic Insights article presents a range of estimates, using different scenarios, of the impact on the Canadian economy of the travel restrictions imposed to contain the spread of COVID-19. These scenarios represent several possibilities based on when travel restrictions are lifted and the speed of recovery. Based on an impact analysis using input–output multipliers, the results suggest that the travel restrictions could have a significant impact on the Canadian economy. The longer it takes for restrictions to be lifted and the slower the recovery, the larger the likely impact. Under the scenarios considered, the travel restrictions could lead to a reduction in gross domestic product (GDP) for the tourism industry of almost 50% to 70% in 2020. The travel restrictions could also lead to significant losses in other industries. The overall impact could result in a 1.2% to 1.7% reduction in Canada’s GDP, and could impact one-third to half a million jobs.
Introduction
The objective of this article is to assess the impact on the Canadian economy of travel restrictions related to the COVID-19 pandemic. As the world faces this unprecedented health crisis, many countries, including Canada, have totally or partially closed their national borders to tourists and non-essential travellers to contain the spread of the virus. Within Canada, some provinces such as New Brunswick, Prince Edward Island, and Newfoundland and Labrador have also banned non-essential travel or all travel between provinces. Although other provinces, such as British Columbia and Ontario, have no travel restrictions, residents are still advised against non-essential travel (CBC News 2020).
The travel restrictions have likely had the biggest impact on the tourism industry. The tourism industry includes transportation, accommodation and food services, travel arrangement and reservation services, and recreation and entertainment (Statistics Canada 2017). In 2019, tourism activities accounted for about 2% of Canada’s GDP and generated about 750,000 jobs (Statistics Canada n.d.a and n.d.b).
The demand for tourism activities has been greatly affected by the travel restrictions and limitations. For example, in March 2020, the number of international arrivals to Canada from other countries fell by 54.2% from February 2020, the largest single monthly drop since 1972 (Statistics Canada 2020). Most hotels were empty: by the first week of April 2020, the hotel occupancy rate was below 20% across Canada (STR 2020).
Because of these declines, many businesses in the tourism industry have had to lay off workers or close temporarily or permanently. For businesses that remained open, some may have had to reduce their hours, and business capacity and performance were likely affected. According to the Labour Force Survey, total paid employment in the tourism industry for April and May 2020 declined by almost 60% from 2019 levels, more than double the declines observed in non-tourism industries (Chart 1).
The travel restrictions could also have a much broader impact on the Canadian economy because of the interdependency between the tourism industry and other industries. This analysis uses input–output multipliers to estimate the economy-wide impact of the travel restrictions by estimating the demand shock to the tourism industry and feeding that information into the input–output system. This type of analysis was used in a recent paper on the Yukon tourism industry (Wang 2020), which found that the decline in tourism activities because of COVID-19 could lead to a gross domestic product (GDP) drop of 6% to 9% in Yukon’s business sector.
The overall economic impact of the travel restrictions depends not only on what has happened over the past few months, but also on what the recovery could entail after the restrictions are lifted. As the spread of COVID-19 has slowed, many countries have started to lift travel restrictions and allow regional or domestic travel (Destination Canada 2020a). Many Canadian provinces have also started to lift restrictions gradually, including allowing accommodation, dine-in and outdoor recreational activities to resume (Destination Canada 2020b). However, there is still a great deal of uncertainty since Canada and many other countries are in the early stages of reopening. The recent resurgence of COVID-19 cases in a number of American states after those states began reopening further underscores the uncertainty that lies ahead. This article explores potential impacts across several possible scenarios that differ in the reopening of domestic and international travel and the duration of recovery.
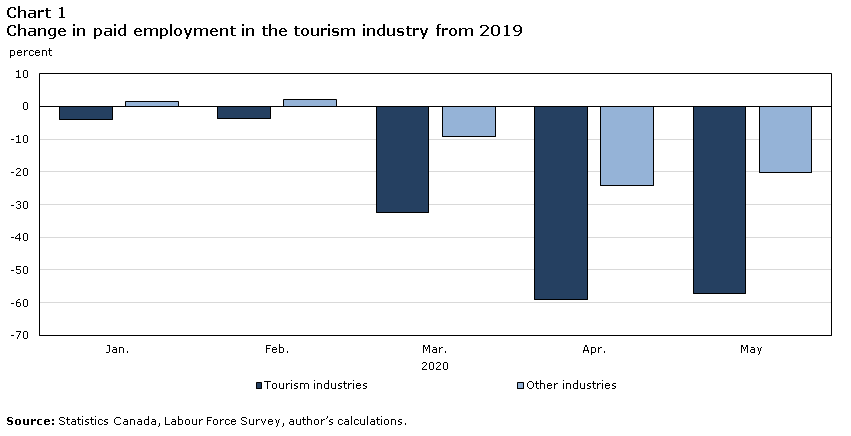
Data table for Chart 1
| Tourism industries | Other industries | |
|---|---|---|
| percent | ||
| Jan. | -4.06106 | 1.58059 |
| Feb. | -3.55684 | 2.12298 |
| Mar. | -32.46691 | -9.11500 |
| Apr. | -58.92453 | -24.29721 |
| May | -57.20094 | -20.21841 |
| Source: Statistics Canada, Labour Force Survey, author’s calculations. | ||
Methodology
The main analysis framework is based on the multipliers constructed from the 2016 input–output tables (Statistics Canada n.d.c). These multipliers are useful for estimating the economy-wide impact of initial changes in economic activities. Once an initial change in economic activity, such as final demand, is measured, its economy-wide impact can be estimated using the multipliers derived through interdependencies across industries. For example, because of the travel restrictions, the number of travellers has plummeted, which has caused a drop in demand for accommodation. Facing declining demand, the accommodation industry could reduce its demand for repair and renovation services, fuel and utilities, and food products. This, in turn, could affect other related industries, such as wholesale and retail trade, utilities, food manufacturing, and other service industries.
Of course, this type of analysis has limitations. For example, it assumes that inputs are used in production in fixed proportions without any substitution, that all firms within an industry are characterized by a common production function, that there is no price adjustment in response to supply or demand changes, and that the length of time it takes for the economy to reach its new equilibrium is unclear (Bess and Ambargis 2011).Note Therefore, this is a static analysis, not a forecast or general equilibrium analysis, because it does not take into account behavioural changes made by consumers, businesses and governments in response to shocks.
There is still a great deal of uncertainty about possible recovery paths as Canada and many other countries are still in the early stages of reopening. Therefore, this analysis considers several scenarios that assume different timelines for lifting domestic and international travel restrictions and for recovery. Domestic and international travel were considered separately for two reasons. First, domestic travel demand is expected to recover faster than international travel demand. According to a survey from a United Nations World Tourism Organization panel of experts, 70% of respondents expected that domestic tourism demand would start to recover by the second half of 2020, while 73% expected that international tourism demand would start to recover by the fourth quarter of 2020 or by 2021 (UNWTO 2020). Second, both domestic and international travel are important. Although tourism spending by domestic travellers is much larger, accounting for roughly 80% of total tourism spending in Canada in 2019, tourism spending by international travellers is still significant (Statistics Canada 2020).
Five scenarios are considered in this analysis: (1) lifting domestic travel restrictions in early July and international restrictions in early September, (2) lifting domestic travel restrictions in early July and international restrictions in early December, (3) lifting both domestic and international travel restrictions in early September, (4) lifting domestic travel restrictions in early September and international restrictions in early December, and (5) lifting both domestic travel and international restrictions in early December. Each scenario is also assumed to involve a different recovery path. For example, a later start date also involves a slower recovery. The recovery paths considered are plotted in charts A1 and A2 for domestic and international travel, respectively, based on analyses from Destination Canada (2020c) and UNWTO (2020) and the latest releases on GDP by industry and tourism spending (Statistics Canada n.d.d and n.d.e).
The input to the impact analysis is the loss of gross output to the tourism industry caused by the travel restrictions. It is calculated as the gross output under the normal case where there is no pandemic, multiplied by the percentage of loss under each scenario.Note The gross output under the normal case is calculated as follows. First, the monthly real GDP is imputed for 2020 using the monthly GDP data by industry and assuming the average year-over-year growth rate from 2016 to 2019 (Statistics Canada n.d.e). Second, it is re-benchmarked with 1.6%, the growth rate for 2020 forecasted by the Bank of Canada before the pandemic (Bank of Canada 2020). Finally, the gross output is backed out using the GDP/output ratios (Statistics Canada n.d.f). For each scenario, direct and indirect multipliers from the 2016 input–output table are used to estimate the impacts on the tourism industry and other industries, assuming the inter-industrial structures do not change significantly in 2020.
Results
The estimated economic impact of travel restrictions is significant and varies across different scenarios (Table 1). In the optimistic first scenario, where domestic travel restrictions are lifted in early July and international travel restrictions are lifted by early September, the travel restrictions could result in a GDP loss of $16.3 billion to the tourism industry and $9.6 billion to other industries, for a total of almost $26 billion, or 1.2% of total real GDP in 2019.Note When the timeline for lifting the travel restrictions is further delayed, the estimated economic impact gets larger. In the fifth scenario, the most pessimistic scenario considered, the total impact from the travel restrictions could reach $37 billion, about 1.7% of total real GDP in 2019.
The impact on employment is also significant. Depending on the scenario considered, the total number of jobs impacted by travel restrictions could range from about 383,000 to 549,000, or about 2.0% to 2.9% of total employment in 2019.
These estimates are largely in line with the findings of Destination Canada (2020d), whose worst-case-scenario estimates are within the range of the estimates from the five scenarios in this analysis.Note
| Scenario | Tourism industry (direct impact) |
Other industries (indirect impact) |
Total impact | Total impact as percent of 2019 total real GDP |
|---|---|---|---|---|
| Impact on gross domestic product (GDP) ($ billions) | percent | |||
| 1 (domestic July / international Sept.) | 16.3 | 9.6 | 25.9 | 1.2 |
| 2 (domestic July / international Dec.) | 17.6 | 10.3 | 27.9 | 1.3 |
| 3 (domestic Sept. / international Sept.) | 20.5 | 12.2 | 32.6 | 1.5 |
| 4 (domestic Sept. / international Dec.) | 21.7 | 12.9 | 34.6 | 1.6 |
| 5 (domestic Dec. / international Dec.) | 23.3 | 13.8 | 37.1 | 1.7 |
| Impact on jobs (x 1,000) | percent | |||
| 1 (domestic July / international Sept.) | 283.7 | 99.1 | 382.8 | 2.0 |
| 2 (domestic July / international Dec.) | 305.9 | 106.5 | 412.4 | 2.2 |
| 3 (domestic Sept. / international Sept.) | 356.7 | 125.5 | 482.1 | 2.5 |
| 4 (domestic Sept. / international Dec.) | 378.9 | 132.9 | 511.7 | 2.7 |
| 5 (domestic Dec. / international Dec.) | 405.9 | 142.6 | 548.5 | 2.9 |
| Source: Statistics Canada, author's calculations. | ||||
Travel restrictions could have much larger direct impacts on the travel industry compared with other industries. The direct loss to the tourism industry’s GDP accounts for about 63% of total impacts. The number of jobs directly impacted in the tourism industry ranges from 284,000 to 406,000, accounting for about 74% of total job loss. Travel restrictions could cause a significant drop in economic activity in the tourism industry for 2020 compared with 2019 (Chart 2)—a 45% to 65% drop in real GDP and a 48% to 69% drop in employment.
The pandemic will likely have a large impact on the Canadian economy. As forecasted by the International Monetary Fund and the Organisation for Economic Co-operation and Development, the Canadian economy could shrink by 8% to 9.4% in 2020 (IMF 2020; OECD 2020). As implied in Table 1, the travel restrictions alone could lead to a decline in GDP growth in 2020, ranging from 1.2 to 1.7 percentage points. Amid these latest forecasts, the travel restrictions could account for about 14% to 20% of the overall forecasted decline in GDP, much larger than the tourism industry’s share of GDP, which underscores the disproportionally adverse impact the pandemic has had on tourism.
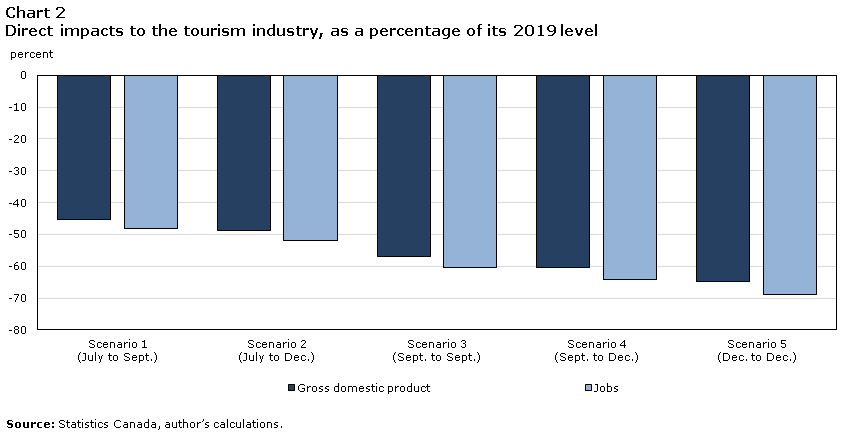
Data table for Chart 2
| Gross domestic product | Jobs | |
|---|---|---|
| percent | ||
| Scenario 1 (July to Sept.) |
-45.37 | -48.07 |
| Scenario 2 (July to Dec.) |
-48.93 | -51.84 |
| Scenario 3 (Sept. to Sept.) |
-57.00 | -60.44 |
| Scenario 4 (Sept. to Dec.) |
-60.56 | -64.21 |
| Scenario 5 (Dec. to Dec.) |
-64.86 | -68.78 |
| Source: Statistics Canada, author’s calculations. | ||
Conclusion
Since the beginning of 2020, the world has been fighting against an unprecedented pandemic. Not only does this pandemic pose a great risk to Canadian lives, but it will also likely have a major impact on the economy because of the measures imposed to contain the spread of the virus. This article presents estimates of the impact of travel restrictions related to COVID-19 on the Canadian economy. These estimates were determined through an impact analysis based on input–output multipliers and demand shocks to the tourism industry under various assumptions.
The estimates suggest that the travel restrictions could have a significant impact on the Canadian economy and that the impacts could vary depending on when travel restrictions are lifted and what type of recovery follows. The longer it takes for the travel restrictions to be lifted and for the recovery, the larger the possible impact is. Under the scenarios considered in this article, the travel restrictions could cause a large blow to the tourism industry, reducing its GDP in 2020 by almost 50% to 70% from 2019. The travel restrictions could also cause significant losses in other industries. The total impact for 2020 alone could result in a loss of real GDP of about 1.2% to 1.7%, which accounts for more than 10% of the projected overall decline in GDP growth.
As Canada is still in the early stages of reopening, a great deal of uncertainty about future recovery paths remains. The goal of this analysis is not to calculate a precise estimate of the true impact, but rather to highlight possible impacts under different scenarios. There are also a few caveats to keep in mind. This analysis is static and does not take into account changes in behaviours by consumers and businesses. Therefore, it should not be interpreted as a forecast or general equilibrium exercise. Furthermore, this analysis does not consider the massive government emergency response spending that could mitigate the actual impacts of the travel restrictions on the Canadian economy. The impact estimates could change if the parameters used in the analysis change. Recovery may take much longer than expected, and the impact could be long-lasting. For example, it took about 42 months to recover lost international arrivals after the attacks on September 11, 2001 (UNWTO 2020).
Appendix
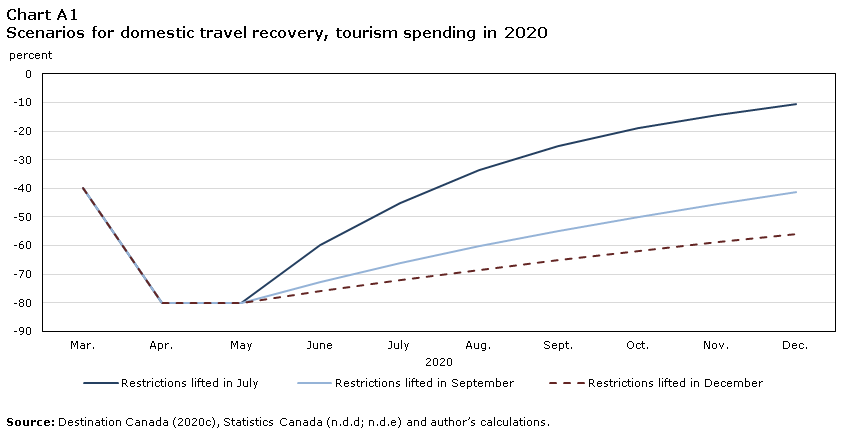
Data table for Chart A1
| Restrictions lifted in July | Restrictions lifted in September | Restrictions lifted in December | |
|---|---|---|---|
| percent | |||
| Mar. | -40.00 | -40.00 | -40.00 |
| Apr. | -80.00 | -80.00 | -80.00 |
| May | -80.00 | -80.00 | -80.00 |
| June | -60.00 | -72.80 | -76.00 |
| July | -45.00 | -66.25 | -72.20 |
| Aug. | -33.75 | -60.29 | -68.59 |
| Sept. | -25.31 | -54.86 | -65.16 |
| Oct. | -18.98 | -49.92 | -61.90 |
| Nov. | -14.24 | -45.43 | -58.81 |
| Dec. | -10.68 | -41.34 | -55.87 |
| Source: Destination Canada (2020c), Statistics Canada (n.d.d; n.d.e) and author’s calculations. | |||
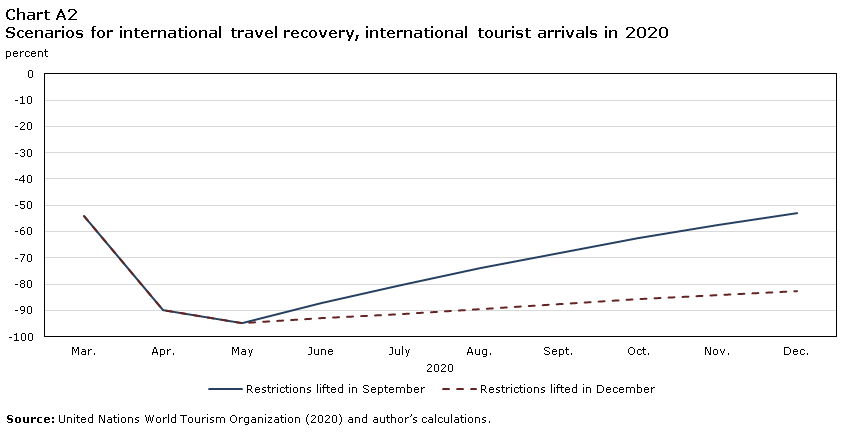
Data table for Chart A2
| Restrictions lifted in September | Restrictions lifted in December | |
|---|---|---|
| percent | ||
| Mar. | -54.00 | -54.00 |
| Apr. | -90.00 | -90.00 |
| May | -95.00 | -95.00 |
| June | -87.40 | -93.10 |
| July | -80.41 | -91.24 |
| Aug. | -73.98 | -89.41 |
| Sept. | -68.06 | -87.62 |
| Oct. | -62.61 | -85.87 |
| Nov. | -57.60 | -84.16 |
| Dec. | -53.00 | -82.47 |
| Source: United Nations World Tourism Organization (2020) and author’s calculations. | ||
References
Bank of Canada. 2020. Monetary Policy Report, January 2020. Available at: https://www.bankofcanada.ca/wp-content/uploads/2020/01/mpr-2020-01-22.pdf.
Bess, R., and Z. Ambargis. 2011. Input-Output Models for Impact Analysis: Suggestions for Practitioners using RIMS II Multipliers. Presented at the 50th Southern Regional Science Association Conference, New Orleans.
CBC News. 2020. “As provincial governments ease lockdowns, many travel restrictions remain.” CBC News, May 11, 2020. Available at: https://www.cbc.ca/news/canada/provinces-travel-restrictions-border-checkpoints-1.5561074.
Destination Canada. 2020a. COVID-19 Impact and Recovery Report: International Summary. Available at: https://www.destinationcanada.com/sites/default/files/archive/1042-COVID-19%20Impact%20and%20Recovery%20Report%20-%20International%20Summary%20-%20May%2026%2C%202020/COVID%20International%20Summary%20Infographic_May%2026_FINAL_EN.pdf.
Destination Canada. 2020b. COVID-19 Impact and Recovery Report: Resident Sentiment & Travel-related Measures. Available at: https://www.destinationcanada.com/sites/default/files/archive/1044-Canadian%20Resident%20Sentiment%20and%20Travel%20Related%20Measures%20-%20June%202%2C%202020/COVID-19%20Canada%20Resident%20Sentiment%20and%20Travel%20Related%20Measures_June%202_FINAL_EN.pdf.
Destination Canada, 2020c. COVID-19’s Impact on Canadian Tourism: Domestic Travel. Available at: https://www.destinationcanada.com/sites/default/files/archive/1006-Impacts%20of%20COVID-19%20on%20Domestic%20Travel/COVID-19%27s%20Impact%20on%20Canadian%20Tourism%20-%20Domestic%20Travel_EN_2020-04-20.pdf.
Destination Canada. 2020d. COVID-19’s Impact on Canada’s Tourism Industry. Available at: https://www.destinationcanada.com/sites/default/files/archive/1021-Impacts%20of%20COVID-19%20on%20Domestic%20and%20International%20Travel%20-%20April%2013%2C%202020/COVID-19%27s%20Impact%20on%20Canada%27s%20Tourism%20Industry__April%2013_EN.pdf.
IMF (International Monetary Fund). 2020. World Economic Outlook Update, June 2020.
OECD (Organisation for Economic Co-operation and Development). 2020. Economic Forecast Summary, June 2020.
Statistics Canada. 2017. Canadian Tourism Satellite Account, 2012. Income and Expenditure Accounts Technical Series. Statistics Canada Catalogue no. 13-604-M. Ottawa: Statistics Canada.
Statistics Canada. 2020. “National tourism indicators, third quarter 2019.” The Daily. January 1. Available at: https://www150.statcan.gc.ca/n1/daily-quotidien/200109/dq200109b-eng.htm?indid=3389-4&indgeo=0.
Statistics Canada. n.d.a. Table 36-10-0235-01 Tourism Share of Gross Domestic Product at Basic Prices.
Statistics Canada. n.d.b. Table 36-10-0232-01 Employment Generated by Tourism (x 1,000).
Statistics Canada. n.d.c. Table 36-10-0594-01 Input-output Multipliers, Detail Level.
Statistics Canada. n.d.d. Table 36-10-0230-01 Tourism Demand in Canada, Constant Prices (x 1,000,000).
Statistics Canada. n.d.e. Table 36-10-0434-01 Gross Domestic Product (GDP) at Basic Prices, by Industry, Monthly (x 1,000,000).
Statistics Canada. n.d.f. Table 36-10-0217-01 Multifactor Productivity, Gross Output, Value-added, Capital, Labour and Intermediate Inputs at a Detailed Industry Level.
Statistics Canada. n.d.g. Table 24-10-0042-01 Provincial and Territorial Gross Domestic Product (GDP) and Employment Generated by Tourism and Related Measures (x 1,000,000).
STR. 2020. “COVID-19 webinar summary: 5 key points on U.S. & Canada, 9 April.” Data Insights Blog. Released April 14, 2020. Available at: https://str.com/data-insights-blog/covid-19-webinar-summary-5-key-points-us-canada-9-april.
UNWTO (United Nations World Tourism Organization). 2020. World Tourism Barometer May 2020: Special Focus on the Impact of COVID-19. Available at: https://webunwto.s3.eu-west-1.amazonaws.com/s3fs-public/2020-05/Barometer_May2020_full.pdf.
Wang, W. 2020. Yukon in COVID-19 Pandemic: Decline in Tourism Activities and the Impact on the Economy. Economic Analysis, Statistics Canada. Prepared for the Yukon Bureau of Statistics. Available at: https://yukon.ca/sites/yukon.ca/files/covid-19_impact_yukon_tourism.pdf.
- Date modified: