
 StatCan COVID-19: Data to Insights for a Better Canada Expected changes in spending habits during the recovery period

Archived Content
Information identified as archived is provided for reference, research or recordkeeping purposes. It is not subject to the Government of Canada Web Standards and has not been altered or updated since it was archived. Please "contact us" to request a format other than those available.
by Farhana Khanam and Sharanjit Uppal
Text begins
Since COVID-19 began, households across Canada have faced drastic changes in many aspects of their lives.Note During the pandemic, governments mandated physical distancing practices and instructed the majority of stores selling non-essential goods and services to close. Travel was restricted, and many entertainment and sporting activities were cancelled.
As these restrictions are lifted, people will have more opportunity to re-adjust their spending habits. Whether they are able to return to their pre-COVID-19 habits may depend on several factors. Many might not be able to do so because of financial difficulties resulting from job loss, fear of infection, and fear of future adverse events.Note By contrast, others might increase their spending because of pent-up demand. Post-pandemic consumer activity will be a key to economic recovery.
This article examines the expected changes in spending habits after stores and businesses start reopening and how these changes are associated with various demographic characteristics. It uses data from the third iteration (June 15 to 21, 2020) of Statistics Canada’s new Canadian Perspectives Survey Series (CPSS). More than 4,000 Canadians from the 10 provinces responded to the survey. Respondents were asked whether they expected to spend more, less or about the same on selected items, compared with before the pandemic. The items included in the survey were eating at a restaurant, ordering take-out food, groceries, medicine, entertainment, housing, utilities, transportation, clothing or apparel, charity, recreation, education, child care, and saving and investing.
Canadians plan to reduce spending on discretionary items
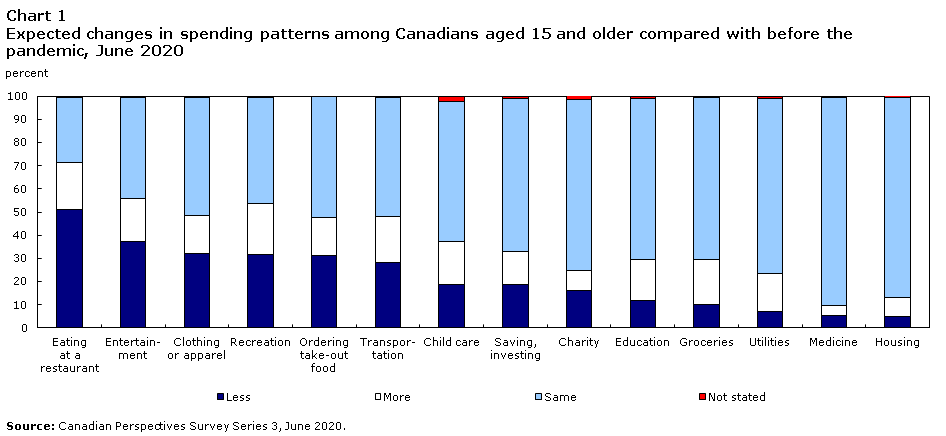
As the economy reopens, a significant proportion of Canadians expect to change the spending habits they had prior to the pandemic. Changes to expected spending depended on the item under consideration. In general, Canadians were less likely to signal a change to spending on more essential items (such as housing, medicine, utilities and groceries) than they were on more discretionary items (such as eating at a restaurant, entertainment or recreation). More often where there was an expected change in their spending, respondents said they would spend less than they did prior to the pandemic (Chart 1).
Data table for Chart 1
| Less | More | Same | Not stated | |
|---|---|---|---|---|
| percent | ||||
| Eating at a restaurant | 50.9 | 20.4 | 28.1 | 0.5 |
| Entertainment | 37.2 | 18.6 | 43.7 | 0.4 |
| Clothing or apparel | 32.2 | 16.2 | 51.1 | 0.5 |
| Recreation | 31.5 | 22.1 | 45.7 | 0.6 |
| Ordering take-out food | 31.3 | 16.3 | 52.1 | 0.4 |
| Transportation | 28.0 | 20.1 | 51.4 | 0.4 |
| Child care | 18.8 | 18.5 | 60.3 | 2.4 |
| Saving, investing | 18.6 | 14.4 | 65.9 | 1.0 |
| Charity | 16.1 | 8.8 | 73.8 | 1.4 |
| Education | 11.6 | 17.7 | 69.8 | 0.9 |
| Groceries | 10.2 | 19.3 | 70.0 | 0.5 |
| Utilities | 7.0 | 16.3 | 75.7 | 1.0 |
| Medicine | 5.4 | 4.3 | 89.8 | 0.5 |
| Housing | 5.0 | 8.0 | 86.6 | 0.5 |
| Source: Canadian Perspectives Survey Series 3, June 2020. | ||||
The largest proportions of Canadians who indicated that they wanted to reduce spending were often in areas related to discretionary spending. The category that had the highest proportion of Canadians stating that they expected to spend less compared to prior to the pandemic was eating at a restaurant, with 51% saying so. This was followed by entertainment (37%), clothing or apparel (32%), recreation (32%), and ordering take-out food (31%).
One spending category that had a higher proportion of people stating that they would be spending more rather than less was groceries. In this category, 19% of respondents reported that they would spend more, 10% said that they would spend less, and 7 in 10 stated that they would spend about the same. These results are not surprising, given that a significant proportion of respondents stated that they would spend less on eating at restaurants and ordering take-out food, thus increasing the demand for groceries. The most recent Consumer Price Index release also reported that the price of certain food items increased in recent months.
Other spending categories that had more people saying that they would be spending more rather than less were education (with 18% expecting to spend more and 12% expecting to spend less), utilities (16% vs. 7%), housing (8% vs. 5%), and medicine (5% vs. 4%).
Expected spending patterns of Canadians are related to financial difficulties
The fact that many Canadians expect to spend less on many items is likely a reflection of the fact that many people experienced job losses or reduced hours of work as a result of the pandemic or saw a reduction in earnings. In April, 29% of Canadians reported that the pandemic had had a major or moderate impact on their ability to meet their financial obligations, and one-third of Canadian workers reported that they were concerned about losing their job.Note Additionally, according to the Labour Force Survey, 5.5 million Canadians lost their jobs or worked fewer hours from February to April, and although many Canadians came back to work in June, the labour market has not fully recovered.
In the CPSS, respondents were asked if their household income was enough to meet their household’s needs for transportation, housing, food, clothing and other necessary expenses.Note Not surprisingly, a higher proportion of those who stated that their income was not enough expected to spend less on several items. Some of these included saving and investing (45% of those who stated that their income was not enough reported that they expected to reduce spending in that area, compared with 14% for the rest of the population), charity (40% vs. 12%), clothing or apparel (52% vs. 28%), ordering take-out food (45% vs. 28%), and recreation (46% vs. 29%).
At the same time, this group was also more likely to state that they would spend more on essential items such as housing (17% vs. 6% for other respondents), utilities (24% vs. 15%) and groceries (27% vs. 17%). This suggests that people struggling to meet their household needs with their current income plan to dedicate a larger portion of their spending to essential goods.
Health concerns also play a role in expected spending patterns
Health preoccupations also play an important role in some items, particularly discretionary items such as eating at a restaurant. With the CPSS, it is possible to examine the relationship between expected spending patterns and the extent to which respondents are concerned with the health risks associated with the resumption of certain activities.Note
Among those who reported that they were very concerned about the health risks of “going to restaurants and bars”, for instance, 67% said that they would spend less on eating at a restaurant, compared with 29% among those who reported that they were not at all concerned. Similarly, among those who reported that they were very concerned about the health risks of “attending shows, festivals, movies or sporting events”, 43% said that they would spend less on entertainment and 38% said that they would spend less on recreation. Among those who were not at all concerned, the same percentages were 19% and 17%, respectively.
Younger Canadians expect to spend more on several items
Certain groups may be more likely than others to see a change in spending habits. For instance, recent research has shown that the risk of experiencing job interruption during the pandemic varied disproportionately by gender, level of education and age.Note Health concerns can also vary across groups, and some groups may not face the same financial obligations as others. For instance, young people generally do not have the same spending obligations as people in older age categories, which often includes families with children.
Younger Canadians aged 15 to 34 were more likely to state that they expected to spend more on certain items, compared with 35- to 54-year-olds and people aged 55 and older. This was particularly true for spending on recreation, entertainment, saving and investing, and education (Table 1). More than 31% of Canadians aged 15 to 34 expected to spend more on recreation, compared with 18% of their older counterparts. Younger individuals were also more likely to state that they expected to spend more on entertainment (26% for 15- to 34-year-olds, compared with 16% or less for the other age groups) and saving and investing (24% vs. 13% or less).
The higher degree of anticipated spending among the youth may reflect the fact that they are generally less concerned than people in older age groups about the health risks of reopening the economy. For instance, 31% of youth aged 15 to 34 reported that they were very concerned about the health risks of going to restaurants and bars, compared with 43% among those aged 55 and older. Higher expected spending on recreation and entertainment among youth might also reflect a higher degree of pent-up demand in this age group and the expectation that the job market will improve with the reopening of the economy. Lastly, higher expected spending on saving and investing among the youth may reflect future uncertainties.
| 15 to 34 | 35 to 54 | 55 and older | |||||||
|---|---|---|---|---|---|---|---|---|---|
| More | Less | Same | More | Less | Same | More | Less | Same | |
| percent | |||||||||
| Groceries | 15.5 | 15.7 | 68.7 | 19.1 | 8.5 | 72.3 | 22.5 | 7.3 | 69.1 |
| Eating at a restaurant | 25.5 | 48.7 | 25.7 | 17.9 | 53.8 | 27.8 | 18.1 | 50.4 | 30.6 |
| Ordering take-out food | 21.0 | 32.0 | 46.9 | 15.1 | 31.0 | 53.8 | 13.0 | 30.9 | 55.3 |
| Medicine | 4.0 | 9.8 | 86.0 | 4.1 | 4.8 | 90.6 | 4.6 | 2.5 | 92.0 |
| Entertainment | 26.4 | 28.3 | 45.2 | 15.6 | 43.6 | 40.5 | 14.3 | 39.7 | 45.2 |
| Housing | 8.9 | 9.0 | 82.1 | 9.2 | 3.2 | 87.4 | 6.1 | 3.2 | 89.6 |
| Transportation | 22.2 | 29.1 | 48.6 | 20.7 | 28.7 | 50.4 | 17.8 | 26.6 | 54.8 |
| Utilities | 19.4 | 9.1 | 69.4 | 17.8 | 7.2 | 75.0 | 12.8 | 5.3 | 80.9 |
| Saving, investing | 24.1 | 19.7 | 54.2 | 13.3 | 19.1 | 67.6 | 7.5 | 17.4 | 74.1 |
| Charity | 11.2 | 16.4 | 69.6 | 8.7 | 17.7 | 73.6 | 7.0 | 14.6 | 77.0 |
| Clothing or apparel | 22.0 | 28.4 | 49.3 | 14.4 | 33.4 | 52.2 | 12.9 | 34.4 | 51.7 |
| Child care | 21.0 | 13.0 | 65.0 | 20.0 | 24.9 | 54.7 | 7.7 | 13.5 | 66.5 |
| Recreation | 31.3 | 27.0 | 41.1 | 18.0 | 36.8 | 45.1 | 18.0 | 30.7 | 50.0 |
| Education | 24.1 | 8.8 | 66.6 | 14.2 | 13.0 | 72.8 | 10.6 | 14.9 | 71.2 |
|
Note: The totals may not add up to 100.0 due to those who answered "Not stated". Source: Canadian Perspectives Survey Series 3, June 2020. |
|||||||||
For most spending categories, differences between men and women were not significant. However, a higher proportion of women expected to spend less on clothing or apparel (37% of women vs. 27% of men) and recreation (35% vs. 28%). In addition, a higher proportion of women expected to spend more on charity (11% vs. 6%). Greater spending on charity by women is consistent with the findings from other studies which indicate that women are more likely to donate to charities than men.Note
Immigrants’ spending habits are more likely to be affected by the pandemic
Immigrants were generally more likely than Canadian-born individuals to report that they would spend less (Table 2), and this reflects previous work indicating that immigrants were more likely to report that they had been financially affected by the pandemic.Note The expectation to spend less was especially true for eating at a restaurant (with 63% of immigrants indicating that they would spend less vs. 48% for Canadian-born individuals), transportation (39% vs. 25%), recreation (43% vs. 29%), saving and investing (29% vs. 15%), and clothing or apparel (42% vs. 30%).
| Canadian-born individuals | Immigrants | |||||
|---|---|---|---|---|---|---|
| More | Less | Same | More | Less | Same | |
| percent | ||||||
| Groceries | 17.9 | 9.3 | 72.3 | 24.4 | 13.5 | 61.8 |
| Eating at a restaurant | 20.9 | 47.7 | 31.0 | 18.2 | 62.5 | 18.3 |
| Ordering take-out food | 15.4 | 28.7 | 55.7 | 19.0 | 39.4 | 40.6 |
| Medicine | 4.4 | 5.4 | 90.0 | 3.9 | 5.3 | 89.7 |
| Entertainment | 18.8 | 35.1 | 45.8 | 18.3 | 45.4 | 35.5 |
| Housing | 7.3 | 4.5 | 87.7 | 9.7 | 6.2 | 83.4 |
| Transportation | 20.3 | 24.9 | 54.5 | 18.3 | 39.1 | 41.9 |
| Utilities | 14.9 | 7.1 | 76.9 | 20.5 | 6.6 | 72.1 |
| Saving, investing | 14.9 | 15.4 | 68.7 | 12.2 | 29.4 | 57.5 |
| Charity | 8.4 | 14.9 | 75.2 | 9.5 | 20.3 | 69.2 |
| Clothing or apparel | 16.5 | 29.7 | 53.5 | 15.4 | 41.6 | 42.2 |
| Child care | 17.1 | 18.0 | 63.2 | 20.2 | 21.8 | 53.7 |
| Recreation | 22.2 | 28.7 | 48.6 | 22.8 | 42.7 | 33.6 |
| Education | 16.9 | 11.3 | 71.4 | 20.8 | 12.3 | 64.7 |
|
Note: The totals may not add up to 100.0 due to those who answered "Not stated". Source: Canadian Perspectives Survey Series 3, June 2020. |
||||||
Quebec residents more likely to report that they plan to spend more
Regionally, Quebec stood out with a higher proportion of people stating that they expected to spend more for most items (Table 3). Quebec residents plan to spend more on education (32% for Quebec vs. 18% for Canada overall), clothing or apparel (26% vs. 16%), recreation (32% vs. 22%), entertainment (27% vs. 19%), and eating at a restaurant (28% vs. 20%).
| Canada | Atlantic | Quebec | Ontario | Prairies | British Columbia | |||||||
|---|---|---|---|---|---|---|---|---|---|---|---|---|
| More | Less | More | Less | More | Less | More | Less | More | Less | More | Less | |
| percent | ||||||||||||
| Groceries | 19.3 | 10.2 | 20.0 | 7.1 | 23.2 | 7.0 | 17.2 | 13.1 | 15.1 | 10.2 | 24.3 | 8.5 |
| Eating at a restaurant | 20.4 | 50.9 | 17.3 | 46.1 | 28.2 | 43.1 | 17.2 | 55.6 | 21.4 | 50.2 | 17.3 | 53.6 |
| Ordering take-out food | 16.3 | 31.3 | 15.4 | 28.4 | 15.3 | 24.4 | 17.2 | 34.8 | 14.1 | 30.5 | 18.4 | 33.9 |
| Medicine | 4.3 | 5.4 | 4.1 | 4.1 | 4.2 | 5.4 | 4.7 | 5.8 | 3.7 | 5.2 | 3.9 | 4.8 |
| Entertainment | 18.6 | 37.2 | 12.6 | 40.6 | 27.4 | 25.8 | 18.5 | 41.2 | 14.1 | 41.0 | 13.0 | 38.4 |
| Housing | 8.0 | 5.0 | 8.2 | 4.3 | 8.3 | 4.8 | 10.3 | 4.7 | 4.8 | 5.0 | 4.4 | 6.0 |
| Transportation | 20.1 | 28.0 | 20.4 | 23.4 | 22.2 | 22.5 | 19.7 | 31.2 | 21.5 | 29.2 | 16.0 | 28.5 |
| Utilities | 16.3 | 7.0 | 13.1 | 5.4 | 15.0 | 7.3 | 19.1 | 8.9 | 13.0 | 3.9 | 16.1 | 6.0 |
| Saving, investing | 14.4 | 18.7 | 11.2 | 14.7 | 10.0 | 18.8 | 16.7 | 18.3 | 13.6 | 20.2 | 17.5 | 19.2 |
| Charity | 8.8 | 16.1 | 6.4 | 15.3 | 7.1 | 15.4 | 9.2 | 14.8 | 7.3 | 19.6 | 12.9 | 16.2 |
| Clothing or apparel | 16.2 | 32.2 | 12.8 | 28.6 | 25.9 | 25.8 | 15.1 | 35.4 | 11.3 | 34.9 | 11.1 | 31.9 |
| Child care | 18.5 | 18.8 | 16.1 | 22.5 | 21.5 | 9.7 | 17.7 | 23.0 | 14.7 | 18.6 | 21.7 | 20.7 |
| Recreation | 22.1 | 31.5 | 17.0 | 29.9 | 31.6 | 24.1 | 21.0 | 34.1 | 19.3 | 36.3 | 15.6 | 30.8 |
| Education | 17.7 | 11.6 | 12.6 | 12.3 | 32.0 | 5.5 | 16.3 | 13.7 | 13.6 | 14.9 | 10.3 | 8.6 |
| Source: Canadian Perspectives Survey Series 3, June 2020. | ||||||||||||
Quebec also had fewer people who reported that they would spend less on several items. The items with the biggest differences in terms of spending less were entertainment (26% for Quebec vs. 37% for Canada overall), child care (10% vs. 19%), eating at a restaurant (43% vs. 51%), education (6% vs. 12%) and ordering take-out food (24% vs. 31%).
In comparison with the Canadian average, residents of Ontario were more likely to say that they expected to spend less on most of the items, including entertainment, eating at a restaurant, ordering take-out food, clothing or apparel, and child care. Residents of other regions were more in line with the Canadian average.
The above results demonstrate that although spending patterns may remain the same or even grow in some sectors, such as groceries for example, spending could go down in many other areas such as discretionary expenses. The results also show that changes in spending patterns not only depend on financial factors, but also on the degree of concern people have about the health risks associated with the reopening of the economy.
Over the next few weeks, Statistics Canada will continue to monitor the impacts of COVID-19 on Canadians, notably by conducting additional surveys and data collection initiatives via crowdsourcing and web panels.
Data source
Data in this release are from the third iteration (June 15 to 21, 2020) of Statistics Canada’s new Canadian Perspectives Survey Series (CPSS), for which a panel of Canadians has agreed to complete a number of short online surveys. The CPSS is a probabilistic panel based on the Labour Force Survey and is therefore representative of the general population.
References
Arim, R., Findlay, L., and Kohen, D. (2020). “The health and behavioural impacts of COVID-19 on youth: Results from the Canadian Perspectives Survey Series 1.” StatCan COVID-19: Data to Insights for a Better Canada. Statistics Canada Catalogue no. 45-28-0001.
Béland, L.-P., Brodeur, A., Mikola, D., and Wright, T. (2020). The Short-Term Economic Consequences of COVID-19: Occupation Tasks and Mental Health in Canada. IZA Discussion paper series no. 13254.
Chan, P., Morissette, R., and Qiu, H. (2020). “COVID-19 and job displacement: Thinking about the longer term.” StatCan COVID-19: Data to Insights for a Better Canada. Statistics Canada Catalogue no. 45-28-0001.
Deng, Z., Morissette, R., and Messacar, D. (2020). “Running the economy remotely: Potential for working from home during and after COVID-19.” StatCan COVID-19: Data to Insights for a Better Canada. Statistics Canada Catalogue no. 45-28-0001.
LaRochelle-Côté, S., and Uppal, S. (2020). “The social and economic concerns of immigrants during the COVID-19 pandemic.” StatCan COVID-19: Data to Insights for a Better Canada. Statistics Canada Catalogue no. 45-28-0001.
Messacar, D., Morissette, R., and Deng, Z. (2020). “Inequality in the feasibility of working from home during and after COVID-19.” StatCan COVID-19: Data to Insights for a Better Canada. Statistics Canada Catalogue no. 45-28-0001.
Statistics Canada, 2020. “Canadian Perspectives Survey Series 1: Impacts of COVID-19 on job security and personal finances, 2020.” The Daily, April 20, 2020.
Turcotte, M. (2012). “Charitable giving by Canadians.” Canadian Social Trends. Statistics Canada Catalogue no. 11-008-X.
- Date modified: