
 StatCan COVID-19: Data to Insights for a Better CanadaLabour market impacts of COVID-19 on Indigenous people: March to August 2020

Archived Content
Information identified as archived is provided for reference, research or recordkeeping purposes. It is not subject to the Government of Canada Web Standards and has not been altered or updated since it was archived. Please "contact us" to request a format other than those available.
by Amanda Bleakney, Huda Masoud and Henry Robertson
Text begins
The COVID-19 pandemic has had significant health and socio-economic impacts on First Nations people, Métis, Inuit and non-Indigenous populations, and has caused an unprecedented downturn in employment and hours worked across Canada.
Recent research based on crowdsourcing data collection initiatives has indicated disproportionate impacts of the COVID-19 pandemic on Indigenous participants, including on their mental health and on their ability to meet financial obligations or essential needs (Arriagada et al., 2020b, 2020c). Indigenous women, in particular, have reported stronger negative impacts. The disproportionate impacts of the pandemic on Indigenous people can be linked to pre-existing vulnerabilities, including long-lasting and persistent disparities in socio-economic conditions (Arriagada et al., 2020a).
Prior research further showed that labour market impacts of the 2008/2009 recession were greater for Indigenous people than for non-Indigenous people, with the downturn lasting longer and the recovery being slower (Moyser, 2017; Usalcas, 2011). In this context, the labour market impacts of the COVID-19 pandemic could be greater for Indigenous people as well.
This paper uses monthly data from the Labour Force Survey (LFS) to examine the labour market impacts of the COVID-19 pandemic on Indigenous people from March to August 2020. Trends in employment, unemployment and labour force participation are examined by Indigenous identity as well as by sex and age group.
To reduce sampling variability, data are averaged across separate three-month periods, starting with the three-month period ending in February 2020, before most measures to slow the spread of COVID-19 were implemented, and ending in the three-month period ending in August 2020, six months into the pandemic. Data are also compared on a year-over-year basis, as they are not seasonally adjusted.
The LFS provides the timeliest data available on labour market characteristics of Indigenous people in Canada. It should be noted, however, that the LFS is not conducted on reserve, uses a different methodology to survey the Territories and does not include some remote communities. Because of these limitations, data in this report refer to Indigenous people living off reserve in the provinces.
Because of sample size and coverage limitations, it was not possible to provide detailed analysis separately for First Nations people, Métis and Inuit. However, summary labour market indicators for First Nations people living off reserve and Métis are presented in the appendix.
Similar initial decreases in employment among Indigenous and non-Indigenous people, but more recent trends have differed
There were more than 60,000 fewer Indigenous people employed in the three months ending in May 2020, compared with the three months ending in February 2020 (Table 1). This lowered the employment rate among Indigenous people living off reserve in the provinces from 57.0% to 50.7%. Employment then partially rebounded in the three months ending in August 2020, with the employment rate reaching 51.9%, still well short of its pre-pandemic level.
Early employment losses among non-Indigenous people were of a similar scale, with the employment rate falling from 61.2% in the pre-pandemic period to 54.2% during the three months ending in May 2020, before partly rebounding to 58.0% in the three months ending in August 2020.
Thus, while employment among both Indigenous and non-Indigenous people initially declined by a similar share, employment among Indigenous people has been slower to recover. Year-over-year, the employment rate in June-August 2020 was down 6.9 points among Indigenous people and down 5.0 points among non-Indigenous people.
| Indigenous | Non-Indigenous | |||||||
|---|---|---|---|---|---|---|---|---|
| June to August 2019 | December 2019 to February 2020 | March to May 2020 | June to August 2020 | June to August 2019 | December 2019 to February 2020 | March to May 2020 | June to August 2020 | |
| 15 years and over, both sexes | ||||||||
| thousands | ||||||||
| Employment | 592.5 | 582.5 | 522.4 | 538.3 | 18,726.9 | 18,351.7 | 16,293.4 | 17,468.7 |
| Unemployment | 65.5 | 64.8 | 104.2 | 108.5 | 1,133.0 | 1,065.4 | 2,165.8 | 2,211.6 |
| percent | ||||||||
| Participation rate | 65.3 | 63.3 | 60.9 | 62.4 | 66.8 | 64.8 | 61.4 | 65.3 |
| Unemployment Rate | 10.0 | 10.0 | 16.6 | 16.8 | 5.7 | 5.5 | 11.7 | 11.2 |
| Employment Rate | 58.8 | 57.0 | 50.7 | 51.9 | 62.9 | 61.2 | 54.2 | 58.0 |
| 15 years and over, women | ||||||||
| thousands | ||||||||
| Employment | 289.9 | 291.8 | 263.5 | 257.8 | 8,811.5 | 8,772.2 | 7,620.7 | 8,120.7 |
| Unemployment | 29.9 | 22.8 | 41.4 | 52.2 | 541.0 | 451.8 | 1,013.0 | 1,100.6 |
| percent | ||||||||
| Participation rate | 61.8 | 59.9 | 57.7 | 58.2 | 62.1 | 60.8 | 56.7 | 60.5 |
| Unemployment Rate | 9.4 | 7.3 | 13.6 | 16.8 | 5.8 | 4.9 | 11.7 | 11.9 |
| Employment Rate | 56.0 | 55.6 | 49.9 | 48.4 | 58.5 | 57.8 | 50.1 | 53.2 |
| 15 years and over, men | ||||||||
| thousands | ||||||||
| Employment | 302.5 | 290.7 | 258.9 | 280.5 | 9,915.4 | 9,579.5 | 8,672.7 | 9,348.0 |
| Unemployment | 35.5 | 42.0 | 62.8 | 56.3 | 592.0 | 613.7 | 1,152.8 | 1,110.9 |
| percent | ||||||||
| Participation rate | 69.0 | 66.9 | 64.2 | 66.8 | 71.6 | 68.9 | 66.2 | 70.3 |
| Unemployment Rate | 10.5 | 12.6 | 19.5 | 16.7 | 5.6 | 6.0 | 11.7 | 10.6 |
| Employment Rate | 61.8 | 58.5 | 51.7 | 55.6 | 67.5 | 64.7 | 58.4 | 62.8 |
| Source: Statistics Canada, the Labour Force Survey. | ||||||||
Increases in unemployment among Indigenous people similar to that of non-Indigenous people, though starting from a higher base
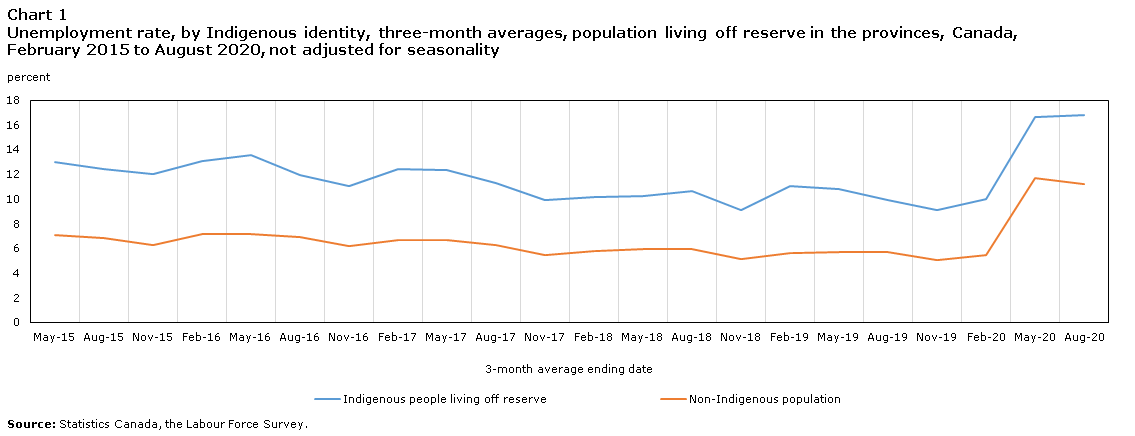
Prior to the pandemic, the unemployment rate among Indigenous people was 1.8 times the rate among non-Indigenous people, reflecting long-lasting disparities in labour market conditions. In the three months ending in May 2020, the unemployment rate increased sharply for both Indigenous and non-Indigenous people. It increased by 6.6 percentage points among Indigenous people living off reserve in the provinces, to 16.6%, and by 6.2 percentage points among non-Indigenous people, to 11.7% (Chart 1).
However, in the three months ending in August 2020, the unemployment rate decreased for non-Indigenous people to 11.2%, but was little changed among Indigenous people at 16.8%, further indicating that the recovery has been more challenging for Indigenous people.
Much of the increase in unemployment among Indigenous people was driven by workers being temporarily laid offNote 1. The share of unemployed who reported being temporarily laid off grew from 7% in the pre-pandemic period to 35% in March-May 2020. The share then declined to 17% in June-August, still much higher than typical levels. During the same period in 2019, temporary lay-offs accounted for only 3% of all unemployed. A similar trend was noted among non-Indigenous people.
Data table for Chart 1
| 3-month average end date | ||||||||||||||||||||||
|---|---|---|---|---|---|---|---|---|---|---|---|---|---|---|---|---|---|---|---|---|---|---|
| May-15 | Aug-15 | Nov-15 | Feb-16 | May-16 | Aug-16 | Nov-16 | Feb-17 | May-17 | Aug-17 | Nov-17 | Feb-18 | May-18 | Aug-18 | Nov-18 | Feb-19 | May-19 | Aug-19 | Nov-19 | Feb-20 | May-20 | Aug-20 | |
| percent | ||||||||||||||||||||||
| Indigenous people living off-reserve | 13.0 | 12.4 | 12.1 | 13.1 | 13.6 | 12.0 | 11.1 | 12.4 | 12.3 | 11.3 | 9.9 | 10.1 | 10.3 | 10.7 | 9.1 | 11.0 | 10.8 | 10.0 | 9.1 | 10.0 | 16.6 | 16.8 |
| Non-Indigenous population | 7.0 | 6.9 | 6.3 | 7.2 | 7.2 | 6.9 | 6.2 | 6.7 | 6.7 | 6.3 | 5.5 | 5.8 | 6.0 | 6.0 | 5.2 | 5.7 | 5.7 | 5.7 | 5.1 | 5.5 | 11.7 | 11.2 |
| Source: Statistics Canada, the Labour Force Survey. | ||||||||||||||||||||||
Indigenous men and women were similarly impacted in the early months of the pandemic, but labour market conditions have since been more challenging for Indigenous women
Despite similar labour market impacts among Indigenous women and men in the first three months after the start of the pandemic, employment and unemployment levels among Indigenous women have subsequently remained further from their pre-pandemic levels.
From the three-month period ending in February 2020 to the three-month period ending in May 2020, the employment rate declined from 58.5% to 51.7% for Indigenous men and from 55.6% to 49.9% for Indigenous women living off reserve in the provinces. Among Indigenous men, employment then rebounded in the three months ending in August to 55.6%, with the number of employed men reaching 96.5% of its pre-pandemic level (Chart 2).
By contrast, the employment rate for Indigenous women in the three months ending in August further decreased to 48.4%, with the number of employed Indigenous women falling to 88.4% of its pre-pandemic level. Year-over-year employment losses were also greater among women. Compared with the same period in 2019, the employment rate in the three months ending in August 2020 was 7.5 percentage points lower among women, and 6.2 percentage points lower among men.
Gender trends in employment during the pandemic can be driven by labour market conditions, as well as by the extent to which parents adjust their labour force participation as they balance work and family obligations. While the participation rate of Indigenous parents decreased for both men and women during the pandemic, the decline was greater for Indigenous mothers, in part because they are more likely to engage in unpaid work such as caring for children or family members.Note 2
Similarly, unemployment rates in the three months ending in May 2020 increased sharply and by a similar share for both sexes, rising by 6.9 percentage points to 19.5% among men, and by 6.3 percentage points to 13.6% among women. However, the unemployment rate for men decreased by 2.8 points to 16.7% in the following three months (June-August) but increased for women by an additional 3.2 points to 16.8%.
As these trends are not adjusted for seasonality, they may in part reflect differences in seasonal patterns in employment between Indigenous women and men. However, increases in unemployment were also higher for women on a year-over-year basis. Compared with the same period in 2019, the unemployment rate in the three months ending in August 2020 was up by 7.5 percentage points among Indigenous women and was up by 6.2 points among Indigenous men.
These trends are consistent with the socio-economic and labour market disparities between Indigenous men and women documented in previous studies. For example, studies based on the 2017 Aboriginal Peoples Survey (APS) showed that employed Métis women less often worked full-time than employed Métis men, and more often reported household income that was insufficient to cover necessary expenses (Hahmann et al., 2019). Similarly, First Nations employed women living off reserve were more likely than men to experience food insecurity, and more often worked part-time for involuntary reasons or to care for family members (Anderson, 2019).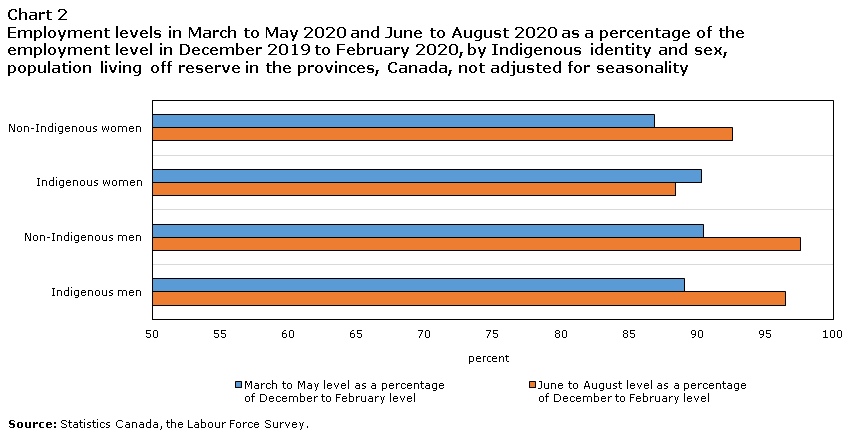
Data table for Chart 2
| Ratio of employment counts (2020) | ||
|---|---|---|
| March to May level as a percentage of December to February level | June to August level as a percentage of December to February level | |
| percent | ||
| Non-Indigenous women | 86.9 | 92.6 |
| Indigenous women | 90.3 | 88.4 |
| Non-Indigenous men | 90.5 | 97.6 |
| Indigenous men | 89.1 | 96.5 |
| Source: Statistics Canada, the Labour Force Survey. | ||
Sharp increase in unemployment among Indigenous youth reflects challenging summer job market
Youth aged 15 to 24 years are generally disproportionally impacted during economic downturns, with trends in employment and unemployment exhibiting more volatility compared with older workers (Bernard, 2013). For example, previous research has found that Indigenous youth aged 15 to 24 years have been more impacted by the 2008/2009 recession than Indigenous adults aged 25 years or older (Moyser, 2017). A similar finding is seen in the COVID-19 pandemic, highlighting the challenges faced by Indigenous and non-Indigenous youth in the summer job market in 2020.
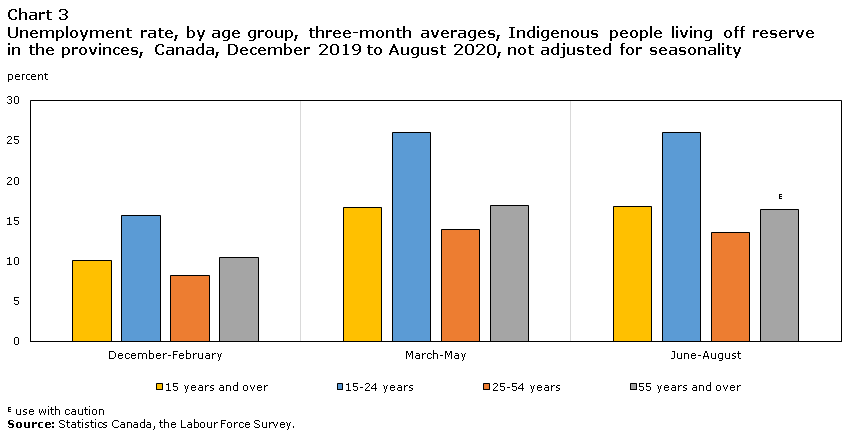
The unemployment rate among Indigenous youth living off reserve in the provinces was 26.0% in the three months ending in August 2020, up 11.3 percentage points compared with the corresponding period in 2019 (Chart 3). This was the largest increase among all age groups. A similar trend was observed among non-Indigenous youth.
Similarly, in the three months ending in August 2020, the employment rate for youth was 47.1%, 11 percentage points lower than during the same period in 2019. In comparison, the employment rate declined by 4.6 percentage points on a year-over-year basis among adults aged 25 to 54 years and by 4.4 percentage points among those aged 55 years and over.
Data table for Chart 3
| December-February | March-May | June-August | |
|---|---|---|---|
| percent | |||
| 15 years and over | 10.0 | 16.6 | 16.8 |
| 15-24 years | 15.7 | 26.0 | 26.0 |
| 25-54 years | 8.2 | 13.9 | 13.5 |
| 55 years and over | 10.4 | 16.9 | 16.4 |
| Source: Statistics Canada, the Labour Force Survey. | |||
Indigenous people are over-represented in occupations with larger employment declines during the pandemic
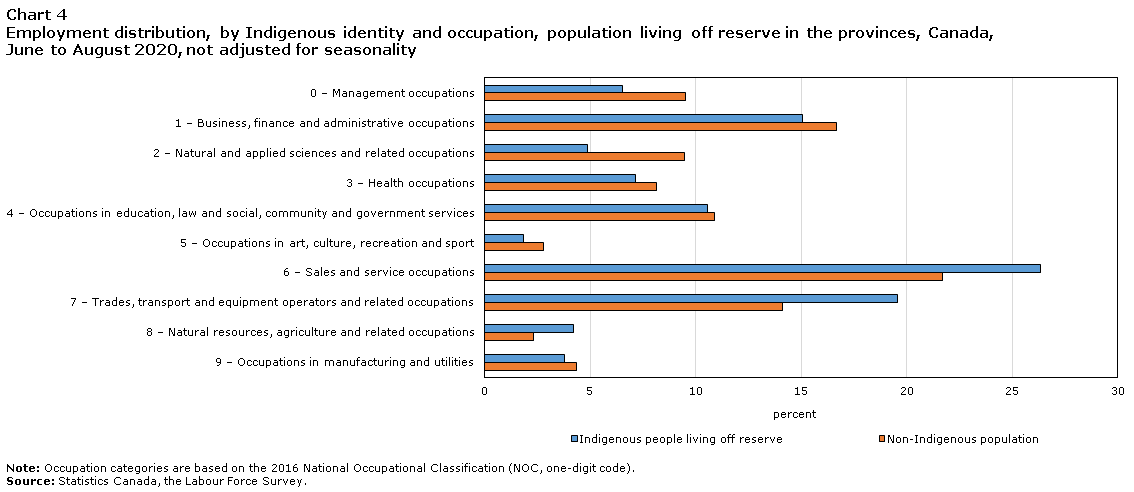
In comparison with the same period in 2019, employment among Indigenous people in the three months ending in August 2020 had declined the most among trades, transport and equipment operators and related occupations (-21,000 or -16%), sales and service occupations (-18,200 or -11%) and occupations in education, law and social, community and government services (-12,100 or -18%). These three occupation groups accounted for 82% of all year-over-year employment losses among Indigenous people.
Together, these occupation groups represented 57% of Indigenous workers and 47% of non-Indigenous workers in the three months ending in August 2020 (Chart 4). Employment declines in these occupations therefore partially explain why the downturn has been more severe among Indigenous people.
Data table for Chart 4
| National Occupation Code (NOC) | Indigenous people living off-reserve | Non-Indigenous population |
|---|---|---|
| percent | ||
| 0 Management occupations | 6.6 | 9.5 |
| 1 – Business, finance and administrative occupations | 15.0 | 16.7 |
| 2 – Natural and applied sciences and related occupations | 4.9 | 9.5 |
| 3 – Health occupations | 7.2 | 8.2 |
| 4 – Occupations in education, law and social, community and government services | 10.6 | 10.9 |
| 5 – Occupations in art, culture, recreation and sport | 1.8 | 2.8 |
| 6 – Sales and service occupations | 26.4 | 21.7 |
| 7 – Trades, transport and equipment operators and related occupations | 19.6 | 14.1 |
| 8 – Natural resources, agriculture and related occupations | 4.2 | 2.3 |
| 9 – Occupations in manufacturing and utilities | 3.8 | 4.4 |
|
Note: Occupation categories based on 2016 National Occupational Classification (One-digit NOC). Source: Statistics Canada, the Labour Force Survey. |
||
Summary
Using monthly data from the Labour Force Survey, this paper examined the labour market impacts of the COVID-19 pandemic on Indigenous people from March to August 2020.
Although labour market impacts among Indigenous and non-Indigenous people were similar early in the pandemic, recovery up to the three-month period ending in August 2020 has been slower among Indigenous people. Employment and unemployment levels among Indigenous women, in particular, remain further from their pre-pandemic levels compared with Indigenous men. Indigenous and non-Indigenous youth were more greatly impacted compared with older adults, highlighting challenges faced by youth across the country in the summer job market of 2020.
Part of the greater labour market impacts among Indigenous people can be explained by their overrepresentation in certain occupations, such as trades, transport and equipment operators, as well as sales and service occupations, which have accounted for much of the employment declines since the start of the pandemic.
This article is the sixth of a series of releases aimed to inform on the economic, social and health challenges facing Indigenous people during the COVID-19 pandemic. The first two releases examined health and social vulnerabilities among those living in rural, remote and northern communities as well as vulnerabilities to socioeconomic impacts among those living in urban areas. Three releases further examined the impacts of the pandemic among Indigenous participants to recent crowdsourcing data collection initiatives, with a focus on mental health, financial vulnerability as well as perceptions of safety, both at home and in public.
Data source
The Labour Force Survey (LFS) is a household survey carried out monthly by Statistics Canada. The objectives of the LFS are to divide the working-age population into three categories in relation to the labour market – employed, unemployed, and not in the labour force – and to allow for characteristics of each of these groups to be examined. Starting in 2004, questions on Indigenous identity have been asked in the territories. In January 2007, these questions were extended to the provinces. Labour market indicators for the Indigenous population have been publically available since the fall of 2008.
Definitions
Employed: Number of persons who, during the reference week, worked for pay or profit, or performed unpaid family work or had a job but were not at work due to own illness or disability, personal or family responsibilities, labour dispute, vacation, or other reason.
Unemployed: Number of persons who, during the reference week, were without work, had looked for work in the past four weeks, and were available for work. Those persons on layoff or who had a new job to start in four weeks or less are considered unemployed.
The participation rate is the number of labour force participants (employed and unemployed) expressed as a percentage of the population 15 years of age and over.
The unemployment rate is the number of unemployed persons expressed as a percentage of the labour force.
The employment rate is the number of persons employed expressed as a percentage of the population 15 years of age and over.
For more information on concepts and definitions, see the Guide to the Labour Force Survey (Statistics Canada, 2020).
Limitations
As Indigenous people comprise 4.9% of the population (Census, 2016), multiple months of LFS data were combined to decrease sampling variability and to increase data quality. For this paper, three-month averages are used to produce estimates.
Although the LFS does produce data for the territories, a different methodology is used. As a result, estimates for the territories are not included in the national totals published monthly by Statistics Canada, and are not included in the estimates presented in this report.
Moreover, Inuit have a relatively small population of 65,025 (Census, 2016) and as of 2016, over half (52.6%) reside in Nunavut or the Northwest Territories. As such, a large proportion of them are not covered in this analysis and Inuit-specific employment statistics cannot be published from the data used here.
Furthermore, the LFS is not conducted on reserve. As such, estimates in this paper are limited to First Nations people living off reserve, Métis and Inuit living in the provinces. Finally, a number of remote and very rural areas in the provinces are not included in the LFS sample. These represent less than 1% of the Canadian population (Guide to the Labour Force Survey, 2020).
References
Anderson, T. (2019). “Employment of First Nations men and women living off reserve”. Aboriginal Peoples Survey. Statistics Canada Catalogue no. 89-653-X. https://www150.statcan.gc.ca/n1/pub/89-653-x/89-653-x2019004-eng.htm.
Arriagada, P., Hahmann, T. & O’Donnell, V. (2020a). “Indigenous people living in urban areas: Vulnerabilities to the socio-economic impacts of COVID-19”. StatCan COVID-19: Data to Insights for a Better Canada. Statistics Canada Catalogue no. 45-28-0001. https://www150.statcan.gc.ca/n1/pub/45-28-0001/2020001/article/00023-eng.htm.
Arriagada, P., Hahmann, T. & O’Donnell, V. (2020b). “Indigenous people and mental health during the COVID-19 pandemic”. StatCan COVID-19: Data to Insights for a Better Canada. Statistics Canada Catalogue no. 45-28-0001. https://www150.statcan.gc.ca/n1/pub/45-28-0001/2020001/article/00035-eng.htm.
Arriagada, P., Frank, K., Hahmann, T. & Hou F. (2020c). “Economic impact of COVID-19 among Indigenous people”. StatCan COVID-19: Data to Insights for a Better Canada. Statistics Canada Catalogue no. 45-28-0001. https://www150.statcan.gc.ca/n1/pub/45-28-0001/2020001/article/00052-eng.htm.
Bernard, A. (2013). “Unemployment Dynamics among Canada’s Youth”. Economic Insights. Statistics Canada Catalogue no. 11-626-X. https://www150.statcan.gc.ca/n1/pub/11-626-x/11-626-x2013024-eng.htm.
Hahmann, T., Robertson, H. & Badets, N. (2019). “Employment characteristics of Métis women and men aged 25 to 54 in Canada”. Aboriginal Peoples Survey. Statistics Canada Catalogue no. 89-653-X. https://www150.statcan.gc.ca/n1/pub/89-653-x/89-653-x2019002-eng.htm.
Moyser, M. (2017). "Aboriginal People Living Off-Reserve and the Labour Market: Estimates from the Labour Force Survey, 2007-2015". The Aboriginal Labour Force Analysis Series. Statistics Canada Catalogue no. 71-588-X2017001. https://www150.statcan.gc.ca/n1/pub/71-588-x/71-588-x2017001-eng.htm.
Statistics Canada (2020). Guide to the Labour Force Survey, 2020. Statistics Canada, Catalogue no. 71-543-G. Ottawa, Ontario. https://www150.statcan.gc.ca/n1/pub/71-543-g/71-543-g2020001-eng.htm (accessed August 10, 2020).
Usalcas, J. (2011). "Aboriginal People and the Labour Market: Estimates from the Labour Force Survey, 2008-2010". The Aboriginal Labour Force Analysis Series. Statistics Canada Catalogue no. 71-588-X2011003. https://www150.statcan.gc.ca/n1/pub/71-588-x/71-588-x2011003-eng.htm.
Appendix
| June to August 2019 | December 2019 to February 2020 | March to May 2020 | June to August 2020 | |
|---|---|---|---|---|
| 15 years and over, First Nations | ||||
| thousands | ||||
| Employment | 277.6 | 279.6 | 257.1 | 262.5 |
| Unemployment | 37.6 | 33.7 | 51.1 | 58.9 |
| percent | ||||
| Participation rate | 62.1 | 60.8 | 59.6 | 61.2 |
| Unemployment Rate | 11.9 | 10.8 | 16.6 | 18.3 |
| Employment Rate | 54.7 | 54.3 | 49.7 | 50.0 |
| 15 years and over, Métis | ||||
| thousands | ||||
| Employment | 307.1 | 294.6 | 261.1 | 272.1 |
| Unemployment | 26.4 | 30.6 | 51.9 | 49.7 |
| percent | ||||
| Participation rate | 68.5 | 65.8 | 62.4 | 64.5 |
| Unemployment Rate | 7.9 | 9.4 | 16.6 | 15.4 |
| Employment Rate | 63.0 | 59.6 | 52.0 | 54.5 |
| 15 years and over, Non-Indigenous | ||||
| thousands | ||||
| Employment | 18,726.9 | 18,351.7 | 16,293.4 | 17,468.7 |
| Unemployment | 1,133.0 | 1,065.4 | 2,165.8 | 2,211.6 |
| percent | ||||
| Participation rate | 66.8 | 64.8 | 61.4 | 65.3 |
| Unemployment Rate | 5.7 | 5.5 | 11.7 | 11.2 |
| Employment Rate | 62.9 | 61.2 | 54.2 | 58.0 |
| Source: Statistics Canada, the Labour Force Survey. | ||||
| Indigenous | Non-Indigenous | |||||||
|---|---|---|---|---|---|---|---|---|
| June to August 2019 | December 2019 to February 2020 | March to May 2020 | June to August 2020 | June to August 2019 | December 2019 to February 2020 | March to May 2020 | June to August 2020 | |
| 15 to 24 years, both sexes | ||||||||
| thousands | ||||||||
| Employment (in thousands) | 129.9 | 105.5 | 84.3 | 104.8 | 2,670.9 | 2,294.4 | 1,695.6 | 2,244.1 |
| Unemployment (in thousands) | 22.4 | 19.6 | 29.6 | 36.8 | 338.6 | 247.9 | 586.6 | 731.6 |
| percent | ||||||||
| Participation rate | 68.1 | 56.0 | 51.3 | 63.7 | 72.4 | 60.9 | 54.6 | 71.2 |
| Unemployment Rate | 14.7 | 15.7 | 26.0 | 26.0 | 11.3 | 9.8 | 25.7 | 24.6 |
| Employment Rate | 58.1 | 47.2 | 38.0 | 47.1 | 64.2 | 54.9 | 40.6 | 53.7 |
| 25 to 54 years, both sexes | ||||||||
| thousands | ||||||||
| Employment (in thousands) | 362.9 | 374.3 | 345.9 | 333.9 | 12,005.0 | 11,983.7 | 10,914.4 | 11,428.2 |
| Unemployment (in thousands) | 34.6 | 33.3 | 55.9 | 52.2 | 599.2 | 599.9 | 1,184.6 | 1,125.2 |
| percent | ||||||||
| Participation rate | 78.3 | 78.8 | 77.0 | 77.4 | 87.8 | 87.2 | 83.7 | 86.7 |
| Unemployment Rate | 8.7 | 8.2 | 13.9 | 13.5 | 4.8 | 4.8 | 9.8 | 9.0 |
| Employment Rate | 71.5 | 72.3 | 66.3 | 66.9 | 83.6 | 83.1 | 75.5 | 78.9 |
| 55 years and over, both sexes | ||||||||
| thousands | ||||||||
| Employment (in thousands) | 99.6 | 102.7 | 92.2 | 99.7 | 4,051.0 | 4,073.6 | 3,683.4 | 3,796.4 |
| Unemployment (in thousands) | 8.5 | 11.9 | 18.7 | 19.5Note E: Use with caution | 195.2 | 217.6 | 394.6 | 354.7 |
| percent | ||||||||
| Participation rate | 39.1 | 40.7 | 38.8 | 37.8 | 37.8 | 37.7 | 35.7 | 36.2 |
| Unemployment Rate | 7.8 | 10.4 | 16.9 | 16.4Note E: Use with caution | 4.6 | 5.1 | 9.7 | 8.5 |
| Employment Rate | 36.0 | 36.5 | 32.3 | 31.6 | 36.1 | 35.8 | 32.2 | 33.1 |
|
E use with caution Source: Statistics Canada, the Labour Force Survey. |
||||||||
- Date modified: