
Aboriginal Peoples Survey
Employment of First Nations men and women living off reserve

Archived Content
Information identified as archived is provided for reference, research or recordkeeping purposes. It is not subject to the Government of Canada Web Standards and has not been altered or updated since it was archived. Please "contact us" to request a format other than those available.
by Thomas Anderson
Introduction
The First Nations population has grown quickly over the last decadeNote and is expected to continue to do so.Note This growth highlights a rising supply, and potential demand, for employment among First Nations men and women. And yet, despite gains in educational attainmentNote , First Nations people continue to be underrepresented in Canada’s labour market.Note
Beyond the underrepresentation of First Nations people as a whole, First Nations women have been further marginalized in the labour market. Yet the release on Labour from the 2016 Census of Population showed that the employment rate for core working-ageNote First Nations women living off reserve, while lower than men’s, did not change between 2006 and 2016. The employment rate for First Nations men, on the other hand, went down over the ten-year period.Note
This paper uses the 2017 Aboriginal Peoples Survey to assess the employment characteristics of First Nations men and women. The 2017 APS represents the fifth cycle of the survey and focuses on participation in the economy, including factors effecting economic participation, labour mobility, entrepreneurship, post-secondary education, targeted skills training, sources of income and financial well-being.
Labour market experiences are important to economic well-being, not only of individuals but also of families and communities. The purpose of this paper is to examine employment of First Nations men and women aged 25 to 54 years living off reserve. The characteristics of employed First Nations people are outlined, including occupation, industry and full-time/part-time employment. A number of other outcomes, influenced by these characteristics, are further explored, such as job satisfaction, skills, health, presence of disability, and measures of economic well‑being such as food security.
First Nations men more likely to be employed than women
In 2017, more than a quarter of a million First Nations people, between the ages of 25 and 54 years, lived off reserve. Within this group, the employment rate was 66.7%.Note
First Nations men were more likely to be employed than women (70.8% versus 63.4%). There are also age differences as men were significantly more likely to be employed than women in the 25 to 34 years and 35 to 44 years age groups (see Chart 1). However, the divide was not significant between men and women aged 45 to 54 years. This may be influenced by the fact that the labour force participation rate was just over ten percentage points lower among First Nations men aged 45 to 54 years compared with those in either of the two other ten‑year age groups; while labour force participation rates stayed roughly static for First Nations women across these age groups.Note
As the 2016 Census showed, for the total core working-age population in Canada, employment rates were lowest in the Atlantic provinces. However, the same pattern did not hold for First Nations people living off reserve. According to the 2017 Aboriginal Peoples Survey, employment rates were highest among First Nations people in the Atlantic provinces (71.8%). Employment was also higher in Ontario (68.4%), the Territories (68.3%) and British Columbia (68.0%). Employment was lowest for core working‑age First Nations people living in Saskatchewan (57.6%).
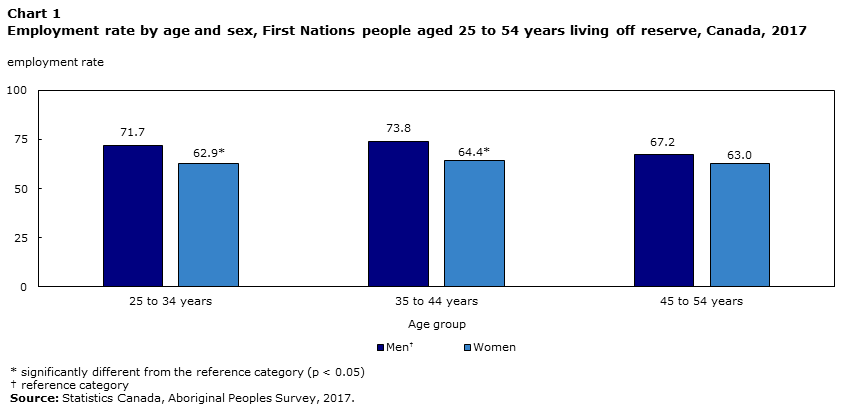
Data table for Chart 1
| 25 to 34 years | 35 to 44 years | 45 to 54 years | |
|---|---|---|---|
| employment rate | |||
| MenData table Note † | 71.7 | 73.8 | 67.2 |
| Women | 62.9Note * | 64.4Note * | 63.0 |
|
|||
First Nations women more likely to work part-time than men
Within the employed First Nations population, most people in the core working-age group worked full-time (86.4%).
First Nations women were more likely to work part-time than First Nations men. Among employed, core working-age First Nations women living off reserve, close to one in five (19.6%) were employed part-time. The figure for employed First Nations men was lower, at 6.7%.
Among those who were employed part-time, more than one third (36.9%) did so for what are called involuntary reasons; these may include business conditions or not being able to find work with 30 or more hours per week. This figure was roughly the same for men (34.2%Note E: Use with caution) and women (37.7%).
Another 15.2%Note E: Use with caution of First Nations people who worked part-time did so because they were caring for a family member. However, almost all of this group was comprised by women (98.0%). Attending school was cited by 13.1%Note E: Use with caution of part-time workers as their main reason for working part-time.
Most employed First Nations people worked at a job that was permanent (85.0%). The proportion was virtually the same for employed women (85.0%) and men (85.1%).
Among non-permanent employees, close to half (47.4%) had a temporary, term or contract job, 30.4% had a seasonal job and 19.9% had a casual job. Women were more likely than men to work in a job that was considered casual (26.9% versus 11.5%Note E: Use with caution), but there were no other significant differences between women and men.
The 2017 APS also asked respondents about their job satisfaction. Most employed First Nations people reported being satisfied with their job. The share who reported being either satisfied or very satisfied was roughly the same for First Nations men (89.6%) and women (90.7%).
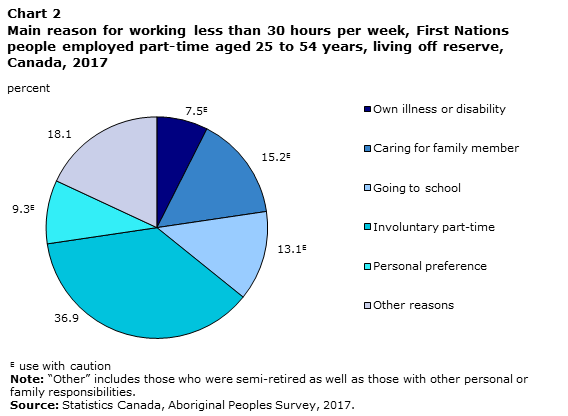
Data table for Chart 2
| Reason for working part-time | Percent |
|---|---|
| Own illness or disability | 7.5Note E: Use with caution |
| Caring for family member | 15.2Note E: Use with caution |
| Going to school | 13.1Note E: Use with caution |
| Involuntary part-time | 36.9 |
| Personal preference | 9.3Note E: Use with caution |
| Other reasons | 18.1 |
|
E use with caution Note: “Other” includes those who were semi-retired as well as those with other personal or family responsibilities. Source: Statistics Canada, Aboriginal Peoples Survey, 2017. |
|
First Nations women with lower educational attainment less likely to be employed than men
The connection between education and employment—particularly high-paying employment—is well established.Note ,Note Furthermore, past research has found that within the Aboriginal population as a whole the rate of return is greater for higher levels of education than for the non-Aboriginal population.Note
Within the core working-age First Nations population living off reserve, 84.4% had attained at least a high school certificate. The share of First Nations men with less than high school (17.2%) was not significantly different from that of women (14.3%).
Just over one third (36.9%) of First Nations people with less than high school were employed. However, First Nations men with less than high school were more than twice as likely to be employed as First Nations women who had not completed high school (50.4% versus 23.9%). The gap in employment between First Nations men and women narrowed with higher levels of education (see Chart 3).
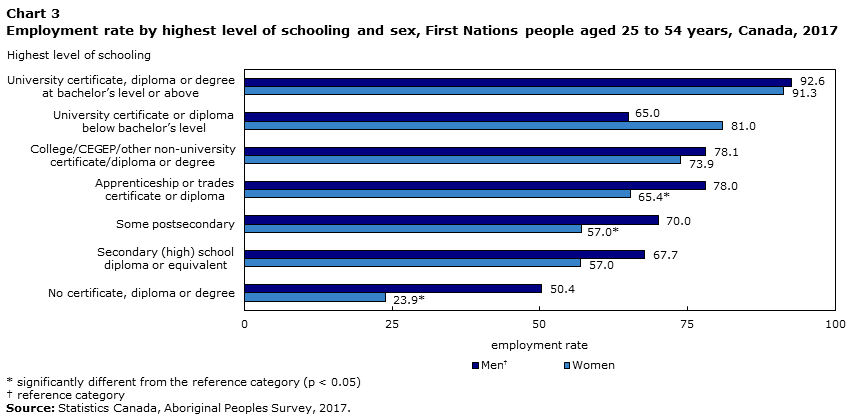
Data table for Chart 3
| Highest level of schooling | MenData table Note † | Women |
|---|---|---|
| employment rate | ||
| University certificate, diploma or degree at bachelor’s level or above | 92.6 | 91.3 |
| University certificate or diploma below bachelor’s level | 65.0 | 81.0 |
| College/CEGEP/other non-university certificate/diploma or degree | 78.1 | 73.9 |
| Apprenticeship or trades certificate or diploma | 78.0 | 65.4Note * |
| Some postsecondary | 70.0 | 57.0Note * |
| Secondary (high) school diploma or equivalent | 67.7 | 57.0 |
| No certificate, diploma or degree | 50.4 | 23.9Note * |
|
||
Research shows that it is not only education that is linked with labour market success, but that the acquisition of skills—such as computer and numeracy skills—plays a vital role.Note The Aboriginal Peoples Survey asked respondents a number of questions on whether or not they felt that their skills limited their job opportunities.Note
More than one third (35.7%) of First Nations people reported that their computer skills were either very limiting or somewhat limiting to future job prospects. A quarter (25.8%) stated that their ability to work with numbers was very limiting or somewhat limiting; while 19.8% reported being either very or somewhat limited by their writing ability and 15.6% reported the same thing about their reading ability.
There were some differences in these limitations between men and women. First Nations women were more likely than men to report that their ability to work with numbers was a limitation (29.0% versus 21.7%). However, women were less likely than men to say the same thing about their ability to write (17.4% versus 22.7%) or read (13.0% versus 18.9%). Roughly the same proportion of First Nations men (35.2%) and women (36.1%) stated that their computer skills were either somewhat or very limiting.
Overqualification has been found among employed Aboriginal people, particularly those with less than university-level educational attainment.Note There are multiple ways to measure whether or not an employee is qualified for their job; the 2017 APS asked respondents to self-assess whether or not they were overqualified, qualified or underqualified. Overall, 29.4% of employed First Nations people aged 25 to 54 years felt that they were overqualified for their current job. Another 5.9% felt that they were working in a job for which they were underqualified. There were no significant differences between men and women regarding either being overqualified or underqualified.
Industry profile differs between men and women
Among employed First Nations people, when looking at the kinds of industries in which women and men worked, notable differences emerged. More than one third of employed First Nations men in the 25 to 54 age group were working in one of three industriesNote in 2016: construction, public administration or manufacturing. Construction was the most commonly reported industry, with 17.1% of core working-age, First Nations men employed in this field. It was followed by public administration (9.1%) and manufacturing (8.8%).
However, these trends depended upon the place where First Nations men resided. While 25.1%Note E: Use with caution of First Nations men worked in construction in Saskatchewan and 23.8%Note E: Use with caution did so in Alberta, this industry was less common for First Nations men in Quebec and the Atlantic provinces. Public administration, on the other hand, was most common for First Nations men in the territories (30.2%), the Atlantic provinces (19.6%Note E: Use with caution) and Quebec (18.3%Note E: Use with caution); it was least common in Alberta and British Columbia.

Data table for Chart 4
| Industry | Percent |
|---|---|
| Construction | 17.1 |
| Public administration | 9.1 |
| Manufacturing | 8.8 |
| Retail trade | 7.7 |
| Transportation and warehousing | 7.7 |
| Source: Statistics Canada, Aboriginal Peoples Survey, 2017. | |
The kinds of industries employing core working-age First Nations women was different than that of men. Three industries—health care and social assistance, retail trade and educational services—employed 44.6% of First Nations women. Among employed First Nations women, 23.7% worked in health care and social assistance, 10.7% worked in retail trade and 10.2% worked in educational services.
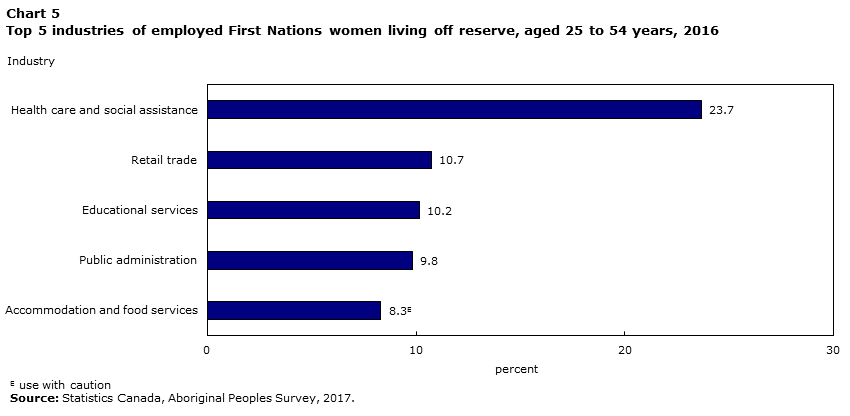
Data table for Chart 5
| Industry | Percent |
|---|---|
| Health care and social assistance | 23.7 |
| Retail trade | 10.7 |
| Educational services | 10.2 |
| Public administration | 9.8 |
| Accommodation and food services | 8.3Note E: Use with caution |
|
E use with caution Source: Statistics Canada, Aboriginal Peoples Survey, 2017. |
|
Among First Nations women, the top 5 most common industries employ a larger share of those working compared with men (62.7% versus 50.4%). This suggests that employed First Nations men are working in a wider range of industries compared with women.
Provincially, it was most common for employed First Nations women to work in the health care and social assistance industry in Manitoba; here, more than two in five (41.6%) employed, First Nations women worked in this industry. In other regions, such as British Columbia (17.9%Note E: Use with caution) and the territories (17.3%), it was less common for First Nations women to work in health care and social assistance. First Nations women were most likely to work in retail trade in the Atlantic provinces (20.7%Note E: Use with caution); and least likely to work in this industry in Quebec and the territories.
Many First Nations men employed in occupations related to trades, women in sales and services
Over half (52.5%) of employed First Nations men who were 25 to 54 years of age were part of one of two occupational groups.Note The largest was trades, transport and equipment operators and related occupations, which made up one third (33.4%) of this population; while the second largest was sales and service occupations (19.1%).
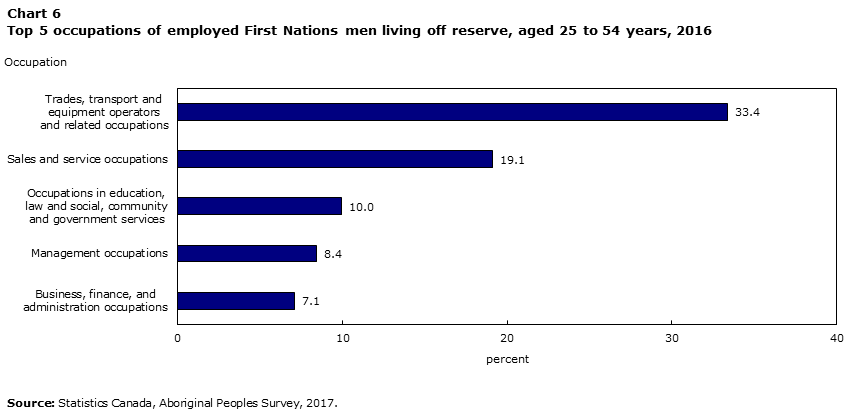
Data table for Chart 6
| Occupation | Percent |
|---|---|
| Trades, transport and equipment operators and related occupations | 33.4 |
| Sales and service occupations | 19.1 |
| Occupations in education, law and social, community and government services | 10.0 |
| Management occupations | 8.4 |
| Business, finance, and administration occupations | 7.1 |
| Source: Statistics Canada, Aboriginal Peoples Survey, 2017. | |
Education plays an important role in the types of jobs available to an individual. Among First Nations men, trades, transport and equipment operators and related occupations was either the largest or second largest occupational group for most First Nations men, no matter their level of education and was highest among those with an apprenticeship or trades certificate or diploma (65.1%). The lone exception was among First Nations men who had a university certificate, diploma or degree at the bachelor’s level or above; among this group, the most common occupations were in education, law and social, community and government services (34.6%) and business, finance, and administration occupations (15.3%Note E: Use with caution).
Like men, more than half (52.6%) of employed First Nations women in the 25 to 54 age group worked in one of two occupational groups. Sales and service occupations made up 30.6% of all occupations of First Nations women; while business, finance, and administration occupations made up 22.1%.
For First Nations women, sales and service was the most common occupational group for those whose highest level of education was a high school diploma or equivalent (51.8%), those who had some postsecondary educationNote (51.9%), those with an apprenticeship or trades certificate or diploma (41.9%) and those with no certificate, diploma or degree (47.3%).
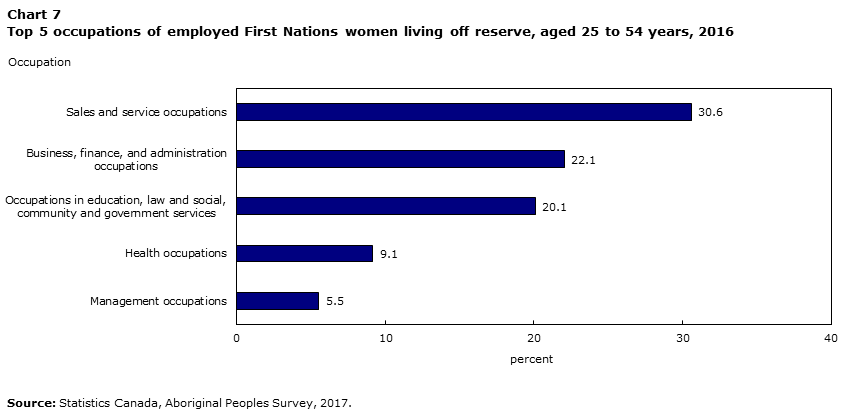
Data table for Chart 7
| Occupation | Percent |
|---|---|
| Sales and service occupations | 30.6 |
| Business, finance, and administration occupations | 22.1 |
| Occupations in education, law and social, community and government services | 20.1 |
| Health occupations | 9.1 |
| Management occupations | 5.5 |
| Source: Statistics Canada, Aboriginal Peoples Survey, 2017. | |
The most common occupational group was business, finance, and administration for First Nations women with a certificate or diploma from college, CEGEP or another non-university institution (30.3%). Among those who had attained a certificate, diploma or degree from a university, the largest occupational group was in education, law and social, community and government services.
Basic needs and food security
Along with considering the differing employment outcomes of First Nations men and women, it is important to consider the other outcomes of First Nations people that are affected by employment. For example, two different people may both be employed, but the employment of the first may be sufficient to cover basic household needs while the employment of the second is not.
Food security is defined as having "physical and economic access to sufficient, safe, and nutritious food to meet dietary needs and food preferences for an active and healthy life."Note Among First Nations people living off reserve, employment was correlated with households that were considered to be food secure.
Overall, 58.6% of off-reserve First Nations people between the ages of 25 and 54 years lived in a household that was defined as food secure. One quarter (26.1%) of the same group lived with moderate food insecurity and the remaining 15.3% were considered to live in a household with severe food insecurity.
Those who were employed were significantly more likely to live in a food secure household (68.8%) compared with those who were unemployed (35.0%) or out of the labour force (39.4%). Chart 8 shows the share of those who were in food secure households by labour force status, as well as the share whose household had enough money to meet basic needs and those that could cover an unexpected expense.

Data table for Chart 8
| Labour force status | Food secure | Household income enough or more than enough to meet household needs | Able to cover unexpected expense of $500 |
|---|---|---|---|
| percent | |||
| EmployedData table Note † | 68.8 | 80.2 | 67.9 |
| Unemployed | 35.0Note * | 50.9Note * | 31.4Note * |
| Not in the labour force | 39.4Note * | 49.5Note * | 30.4Note * |
|
|||
Despite the positive association between employment and food security, the benefit was not equally felt for women and men. First Nations women who were employed were less likely to live in a food secure household than were men (64.1% versus 74.0%).
When asked if their household income was sufficient to meet household needs, 75.8% of employed First Nations women reported that their income was enough or more than enough. This figure was significantly lower than that of First Nations men (85.0%).
The divide between men and women was also seen when respondents were asked if their household could cover an unexpected expense of $500. Close to two thirds of First Nations men (64.0%) stated that they would be able to cover such an expense; this figure was significantly lower for First Nations women (48.7%). This difference held true even for those who were employed, as 74.7% of employed men reported that they would be able to cover an expense of $500 compared with 62.0% of employed First Nations women.
Along with differences in earnings, industry and occupation, these outcomes may be related to the extra burden of care that women tend to carryNote or the increased likelihood of women being single parents.Note Past research has also found that women tend to experience greater declines in economic well-being following a divorce or dissolution of a common-law relationship, when compared with men.Note
Among various household types within the employed First Nations population, there were significant differences between men and women in the share of those who lived in a food secure household, the share whose household income was enough to meet basic needs and the share who would be able to cover an unexpected expense of $500.
Considering those living in a couple, either with children or without, there was little difference between First Nations men and women for any of the outcomes. However, within lone-parent households, employed First Nations women were less likely to be food secure than men (45.6% versus 63.0%). They were also less likely to report that their household income was enough or more than enough to meet household needs (59.6% versus 78.9%); and were less likely to be able to cover an unexpected expense of $500 (38.8% versus 63.8%).
| MenTable 1 Note † | Women | |
|---|---|---|
| percent | ||
| Food secure household | ||
| Couple with children | 75.7 | 74.3 |
| Couple without children | 81.1 | 78.1 |
| Lone-parent household | 63.0 | 45.6Note * |
| Other family household | 74.9 | 49.4Note E: Use with caution |
| Non-family household | 69.6 | 51.5Note * |
| Household income enough or more than enough to meet household needs | ||
| Couple with children | 84.9 | 85.7 |
| Couple without children | 86.8 | 84.9 |
| Lone-parent household | 78.9 | 59.6Note * |
| Other family household | 87.5 | 54.8Note E: Use with cautionNote * |
| Non-family household | 86.4 | 67.2Note * |
| Able to cover unexpected expense of $500 | ||
| Couple with children | 77.1 | 72.8 |
| Couple without children | 77.4 | 78.2 |
| Lone-parent household | 63.8 | 38.8Note * |
| Other family household | 85.2 | 41.0Note E: Use with cautionNote * |
| Non-family household | 69.4 | 52.7Note * |
E use with caution
|
||
Health and First Nations people with disabilities
In past research on First Nations people, employment has often been studied as a determinant of health.Note ,Note However, the relationship can also work in the opposite direction, as a person in poor health may be less likely to enter into the labour market.Note
The self-reported health question on the Aboriginal Peoples Survey asked respondents to rate their general well-being. Among those in the core working-age group living off reserve, First Nations women were less likely than First Nations men to report excellent or very good health (42.7% versus 50.0%). Furthermore, women were less likely to report excellent or very good mental health (46.6% versus 58.6%).
Employment rates of First Nations women were also correlated with health outcomes to a greater degree than those of men. Meaning that women who were less likely to rate their health as excellent or very good, were also less likely to be employed than First Nations men with the same level of self-reported health.
First Nations women with good, fair or poor self-rated health were less likely to be employed (54.5%) than First Nations men in the same category (60.9%). The divide was even greater when considering those with good, fair or poor self-rated mental health: the employment rate of First Nations women in this group was nearly ten percentage points lower than that of men (54.8% versus 63.7%).
The presence of a chronic conditionNote was also connected with lower employment rates among First Nations people. Those who reported being diagnosed with at least one chronic condition were less likely to be employed (59.6%) than those who were not (75.4%). However, unlike self-rated health and self-rated mental health, the employment rates for those with at least one chronic condition did not differ significantly between men (62.1%) and women (58.1%).
For the first time in 2017, the Aboriginal Peoples Survey used the Disability Screening Questions (DSQ) to identify persons with disabilities. These questions have been used on a number of surveys to allow comparisons between persons with and without disabilities. Using this measure, close to one third (32.7%) of off-reserve First Nations people aged 25 to 54 years had a disability. Women were more likely to have a disability than men (39.3% versus 24.5%).
First Nations people with disabilities were less likely to be employed (47.9%) than those without (75.8%). This gap is similar to that observed in the total population in Canada.Note There was no significant difference between the employment rates of First Nations women with a disability (49.2%) and men (45.3%).
Among those who were employed, First Nations persons with disabilities were more likely to work part-time than those without a disability (27.1% versus 9.4%). This pattern held true for both men (20.2%Note E: Use with caution versus 4.3%Note E: Use with caution) and women (30.2% versus 14.9%).
Conclusion
Within the core working-age off-reserve First Nations population, there are notable differences in the employment characteristics of women and men based on educational attainment, with impacts on their income and food security as well as health status.
First Nations women were less likely to be employed and more likely to work part-time than their male counterparts. The disparity between the employment rates of First Nations women and men were most observable among those with lower levels of education, such as those with less than a high school education. However, there was no level of education where women were more likely to be employed than men.Note
Finally, this research suggests not only that First Nations women were less likely to be employed but that the benefits of employment were not equally felt among women and men. Employed First Nations women were less likely to live in food secure households and less likely to report being able to cover common or unexpected expenses.
Negative health was also tied to employment for First Nations women, who were less likely to report excellent or very good health as well as excellent or very good mental health than their male counterparts.
Future research on the labour force outcomes of First Nations men and women could examine the relationship between earnings and employment. Multivariate analysis could also further illuminate other factors that are related to employment for both First Nations men and women.
Data sources and methods
Data sources
The data used are from the 2017 Aboriginal Peoples Survey (APS). The 2017 APS is a voluntary, national survey of First Nations people living off reserve, Métis and Inuit aged 15 or older. The objectives of the APS are to identify the needs of these Aboriginal groups and to inform policy and programs. The APS aims to provide current and relevant data for a variety of stakeholders, including Aboriginal organizations, communities, service providers, researchers, governments, and the general public.
The APS is a post-censal survey, designed to follow and complement the Census of Population. The 2017 APS represents the fifth cycle of the survey and follows the thematic approach that was first introduced in the 2012 APS. The focus for the 2017 APS is on participation in the Canadian economy, transferable skills, practical training, use of information technology, Aboriginal language attainment, etc. It collected data on part-time employment, self-employment, business assistance, job satisfaction, job seeking, and non-participation in the labour force and job skills. It also collected unique and detailed information on education, health, languages, society and community, etc.
The 2017 APS was developed by Statistics Canada with funding provided by Indigenous Services Canada, Crown-Indigenous Relations and Northern Affairs Canada, Health Canada, and Employment and Social Development Canada.
While this paper analyzes the employment rates of the off-reserve First Nations population from the 2017 APS, official employment, unemployment and participation rates are produced via the Labour Force Survey (LFS).
The target population of the 2017 APS was composed of the Aboriginal identity population of Canada, 15 years of age or older as of January 15, 2017, living in private dwellings. It excluded people living on Indian reserves and settlements and in certain First Nations communities in Yukon and the Northwest Territories (NWT). The sample for the survey was derived from a sampling frame of individuals who answered "Yes" to one of the three Census questions defining the identity population (questions 18, 20 and 21) or those who reported Aboriginal ancestry to question 17 on the Census. Although not part of the 2017 APS target population, some individuals with Aboriginal ancestry who did not report Aboriginal identity were still sampled, since past survey experience indicates that nearly one-third of these individuals will report an Aboriginal identity on the APS. Therefore, unlike the target population, the sampled population (or survey population) was composed of both the identity population and the Aboriginal ancestry-only population. Additional details of the survey are available on the Aboriginal Peoples Survey (APS) and in the Concepts and Methods Guide.
The 2017 APS was conducted from January through August, 2017. The overall response rate was 76%.
Methods
The population of study for this analysis were people who identified as First Nations living off reserve, aged 25 to 54 years. It was possible to report both single and multiple responses to the Aboriginal identity question on the APS (e.g. both First Nations and Métis). The data presented here represent a combination of the single and multiple responses for First Nations people.
Prevalence estimates presented in this article are based on descriptive analysis conducted using SAS-callable SUDAAN and STATA. Weighted estimates were calculated using methods that took into account the survey design of the APS. Missing values including "don’t know," "not stated" and "refusal" were excluded from the denominator when calculating percentages. Variance was estimated using 1,000 sets of bootstrap weights and a Fay adjustment factor of 16. Variance around each estimate is depicted using 95% confidence intervals. Statistically significant differences between two estimates were identified using hypothesis testing.
To ensure confidentiality of respondents, estimates based on small cell counts (10 or less) were suppressed. Further, estimates with unacceptable precision (coefficient of variation greater than 33.3%) were also suppressed. Estimates with marginal precision (coefficient of variation between 16.6% and 33.3%) are presented with an "E" and should be used with caution.
References
Avellar, S. and P.J. Smock. 2005. "The economic consequences of the dissolution of cohabiting unions." Journal of Marriage and Family, 67(2), pp. 315-327.
Caron-Malenfant, É., Coulombe, S., Guimond, E., Grondin, C. and A. Lebel. 2014. "Ethnic Mobility of Aboriginal Peoples in Canada Between the 2001 and 2006 Censuses." Population, English edition, 69(1), pp. 29-54.
Ciceri, C. and K. Scott. 2006. "The Determinants of Employment among Aboriginal Peoples." Aboriginal Policy Research Consortium International (APRCI). 132.
Chirikos, T.N., 1993. "The relationship between health and labor market status." Annual Review of Public Health, 14(1), pp. 293-312.
Food and Agricultural Organization of the United Nations. 1996. Rome Declaration on World Food Security.
Fox, D. and M. Moyser. 2018. The Economic Well-Being of Women in Canada. Statistics Canada Catalogue no. 89-503-X. Ottawa: Statistics Canada.
Hanushek, E.A., G. Schwerdt, S. Wiederhold and L. Woessmann. 2013. Returns to Skills around the World: Evidence from PIAAC. NBER Working Paper No. 197762. National Bureau of Economic Research. Cambridge, MA.
Morency, J.-D., É. Caron-Malenfant, S. Coulombe, and S. Langlois. 2015. Projections of the Aboriginal Population and Households in Canada, 2011 to 2036. Statistics Canada Catalogue no. 91-552-X. Ottawa: Statistics Canada.
Moyser, M. 2017. Aboriginal People living off-reserve and the labour market: Estimates from the Labour Force Survey, 2007-2015. Statistics Canada Catalogue no. 71-588-X. Ottawa: Statistics Canada.
National Collaborating Centre for Aboriginal Health. 2017. Employment as a Social Determinant of First Nations, Inuit and Métis Health. Prince George, BC: National Collaborating Centre for Aboriginal Health.
Park, J. 2018. "Overqualification Among Aboriginal Workers in Canada." The International Indigenous Policy Journal, 9(1), p. 2.
Reading, C.L. and F. Wien. 2009. Health inequalities and the social determinants of Aboriginal peoples' health. Prince George, BC: National Collaborating Centre for Aboriginal Health.
Sinha, M. 2013. Portrait of caregivers, 2012. Statistics Canada Catalogue no. 89-652-X. Ottawa: Statistics Canada.
Statistics Canada. 2013. "Education and occupation of high-income Canadians." NHS in Brief. Statistics Canada Catalogue no. 99-014-X2011003. Ottawa: Statistics Canada.
Statistics Canada. 2017. "Education in Canada: Key results from the 2016 Census." The Daily. November 29, 2017. Statistics Canada Catalogue no. 11-001-X. Ottawa: Statistics Canada.
Statistics Canada. 2017. "Labour in Canada: Key results from the 2016 Census." The Daily. November 29, 2017. Statistics Canada Catalogue no. 11-001-X. Ottawa: Statistics Canada.
Turcotte, M. 2014. "Persons with Disabilities and Employment." Insights on Canadian Society. Statistics Canada Catalogue no. 75-006-X. Ottawa: Statistics Canada.
Zhao, J., S.J. Ferguson, H. Dryburgh, C. Rodriguez, and L. Gibson. 2017. "Does Education Pay? A Comparison of Earnings by Level of Education in Canada and Its Provinces and Territories. Census of Population, 2016." Census in Brief. Statistics Canada Catalogue no. 98-200-X2016024. Ottawa: Statistics Canada.
- Date modified: