
 StatCan COVID-19: Data to Insights for a Better Canada Indigenous people in urban areas: Vulnerabilities to the socioeconomic impacts of COVID-19

Archived Content
Information identified as archived is provided for reference, research or recordkeeping purposes. It is not subject to the Government of Canada Web Standards and has not been altered or updated since it was archived. Please "contact us" to request a format other than those available.
Text begins
The Public Health Agency of Canada has highlighted how certain groups are at an increased risk of developing COVID-19. These groups may also be more vulnerable to the stresses and challenges that arise from measures to slow its spread, including closures of schools and businesses. This article focuses on vulnerabilities to the socio-economic impacts of the COVID-19 pandemic among Indigenous people living in urban areas.
Previous research has highlighted challenges facing First Nations, Métis and Inuit families and individuals in urban areas, including the absence of traditional supports and higher costs of living (Place, 2012). This article focuses on the 970,000 Indigenous people living in urban areas (off reserve), providing key indicators of economic well-being.Note While these data are from prior to the COVID-19 pandemic (2016 Census and 2017 Aboriginal Peoples Survey), they provide insight into vulnerabilities existing in these areas entering into the current economic situation.
About one-quarter of Indigenous people in urban areas in poverty
Financially vulnerable individuals and groups are exposed to greater risk of negative socioeconomic consequences of interventions aimed at curbing COVID-19 transmission (United Nations, 2020). For those already experiencing economic disadvantages, staying at home often means lost income for basic needs such as rent, transportation, and food. It may also limit children’s ability to undertake at-home learning if they do not have access to a computer or the internet.
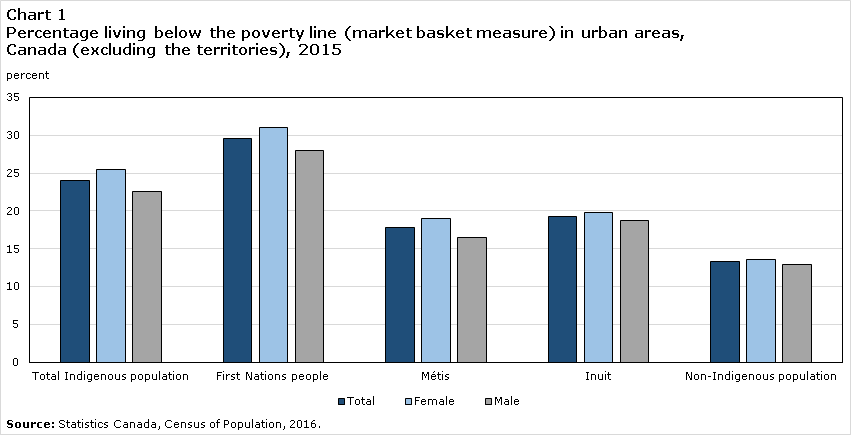
According to the market basket measure (MBM), Canada’s official poverty line, approximately one-quarter (24%) of Indigenous people living in urban areas in the provinces were in poverty.Note By comparison, 13% of the non-Indigenous population in these areas were in poverty. (Chart 1)
Data table for Chart 1
| Total | Female | Male | |
|---|---|---|---|
| percent | |||
| Total Indigenous population | 24.0 | 25.4 | 22.5 |
| First Nations people | 29.6 | 31.0 | 28.0 |
| Métis | 17.8 | 19.0 | 16.4 |
| Inuit | 19.3 | 19.8 | 18.8 |
| Non-Indigenous population | 13.3 | 13.5 | 13.0 |
| Source: Statistics Canada, Census of Population, 2016. | |||
While 30% of Indigenous children and youth under the age of 18 in urban areas were living in poverty, the percentage was higher for those in lone-parent families. According to the 2016 Census, 38% of Indigenous children and youth in urban areas were living with a lone parent (most often with a female lone parentNote ), and more than half of them (51%) were in poverty. Higher than average poverty rates were also observed among those living with grandparent(s) without parents present (43%) and foster children (37%). (Table 1)
| Percentage in poverty | |
|---|---|
| Total under 18 years of age | 29.8 |
| Living with two parents | 12.8 |
| Living with one parent in lone-parent family | 51.2 |
| Living with grandparent(s) without parents present | 42.7 |
| Foster children | 37.2 |
| Source: Statistics Canada, Census of Population, 2016 | |
More than one in three Indigenous people in urban areas in food insecure households
Food insecurity occurs when one or more household members do not have access to an acceptable amount of quality healthy food because of financial constraints. It has been shown to contribute to poor physical and mental health (Rotenberg, 2016; Anderson, 2015; Willows et al., 2011) and has also been linked to lower educational outcomes and family stress (Council of Canadian Academies, 2014; Butler Walker et al., 2009). Households that were already experiencing food insecurity entering the COVID-19 pandemic may be particularly vulnerable to its economic consequences.Note
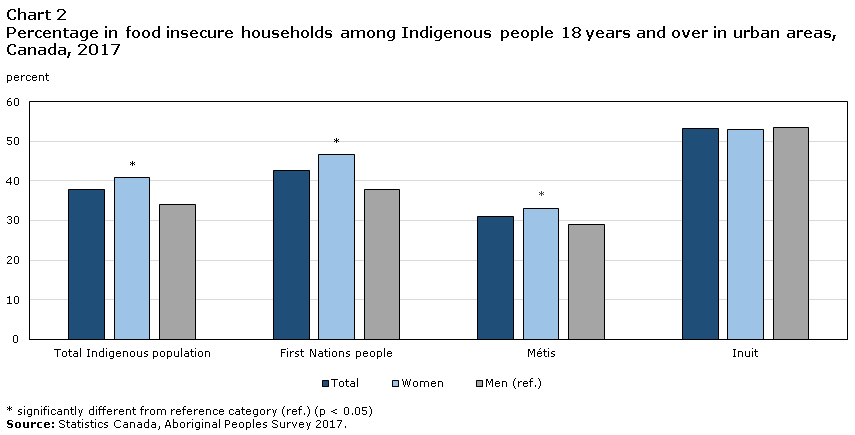
In 2017, among Indigenous people aged 18 and older living in urban areas, 38% lived in a food insecure household. The proportions were 43% among off-reserve First Nations people, 31% among Métis and 53% among Inuit (Chart 2). Furthermore, women were more likely to experience food insecurity, with 41% of Indigenous women aged 18 and older living in a food insecure household compared with 34% of Indigenous men.
Data table for Chart 2
| Total | Women | Men (ref.) | |
|---|---|---|---|
| percent | |||
| Total Indigenous population | 37.7 | 40.8Note * | 34.0 |
| First Nations people | 42.6 | 46.6Note * | 37.7 |
| Métis | 31.1 | 33.1Note * | 28.9 |
| Inuit | 53.3 | 53.0 | 53.6 |
|
|||
Many report being unable to cover an unexpected expense of $500
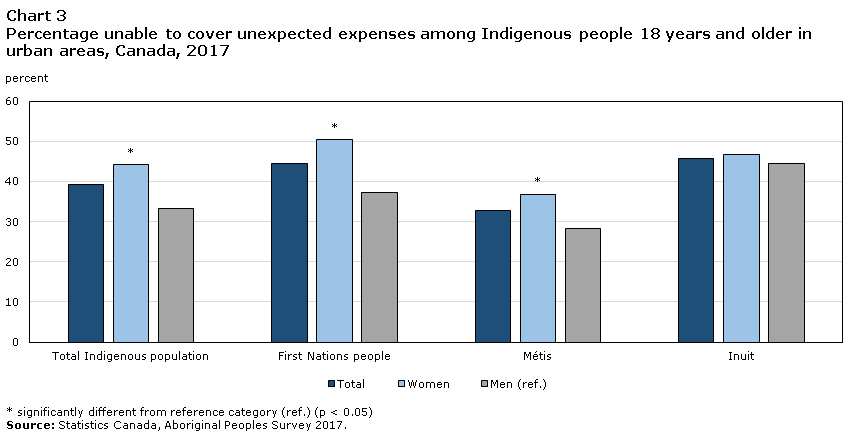
A key indicator that provides insight into the preparedness to cope with the economic consequences of the COVID-19 pandemic is the ability to cover unexpected expenses. When asked in 2017 if their household could cover an unexpected expense of $500 from their own resources, 39% of Indigenous people in urban areas reported that they could not (Chart 3). The gap between men and women was significant, as 44% of Indigenous women reported they could not cover such an unexpected expense compared to 33% of Indigenous men.
Data table for Chart 3
| Total | Women | Men (ref.) | |
|---|---|---|---|
| percent | |||
| Total Indigenous population | 39.2 | 44.2Note * | 33.2 |
| First Nations people | 44.6 | 50.4Note * | 37.3 |
| Métis | 32.7 | 36.8Note * | 28.3 |
| Inuit | 45.7 | 46.7 | 44.6 |
|
|||
The COVID-19 pandemic will continue to have far-reaching impacts on the well-being of all Canadians, including First Nations people, Métis and Inuit. A first Daily article, released on April 17th, examined health and social characteristics associated with a higher risk of contracting or spreading the COVID-19 virus among Indigenous people, with a focus on rural, remote and northern communities. The present article focused on vulnerabilities to socioeconomic impacts among Indigenous people living in urban areas.
Over the coming weeks, Statistics Canada will continue to report on impacts of the current pandemic among Indigenous people, including using data from the Impacts of COVID-19 on Canadians: Data Collection Series, a series of timely crowdsourcing surveys designed to collect information on an ongoing basis on topics related to the COVID-19 pandemic.
Methodology
The main sources of data are the 2017 Aboriginal Peoples Survey (APS) and the 2016 Census of Population.
It is important to note that the findings reported here are for the population living in private households. Indigenous people experiencing homelessness or living in non-permanent or collective dwellings may represent a significant number of uncounted people living below the poverty line.
Indigenous identity: 'Indigenous identity' refers to whether the person reported being First Nations (North American Indian), Métis or Inuk (Inuit) and/or being a Registered or Treaty Indian (that is, registered under the Indian Act of Canada) and/or being a member of a First Nation or Indian band. Census data for specific Indigenous groups (First Nations, Métis or Inuit) refer to those who reported a single identity, and APS findings include both the single and multiple identity groups.
Geographic classifications: For the purpose of this study, urban areas refer to population centres. Population centres are defined as areas with at least 1,000 residents and a population density of 400 persons per kilometre. There are on-reserve communities that would be classified as population centres according to their size and population density; however, because of the different context of these communities, this study focuses only on off-reserve areas.
Poverty rates: The Market Basket Measure (MBM) is based on the cost of a specific basket of goods and services representing a modest, basic standard of living. It includes the costs of food, clothing, shelter, transportation and other items for a reference family. These costs are compared to the disposable income of families to determine whether they fall below the poverty line.
Food insecurity: In the Aboriginal Peoples Survey, food insecurity refers to situations when the food purchased does not last (i.e., running out of food) and there is not enough money to buy more food, balanced meals are unaffordable, or household members cut the size of their meals or skip meals because there is not enough money for sufficient food.
Note
The Aboriginal Population Profile, 2016 Census provides information about the Indigenous identity population of various geographic areas spanning provinces and territories to census subdivisions and historic treaty areas. More information can be found in the Aboriginal Population Profile 2016 Census, Statistics Canada Catalogue no. 98-510-X2016001.
References
Anderson, Thomas. 2015. The Social Determinants of Higher Mental Distress among Inuit. Statistics Canada Catalogue no. 89-653-X. Ottawa.
Butler Walker, Jody, Norma Kassi and Claire Eamer. 2009. Food Security in Times of Change: A Policy Brief on Food Security for Northern Canada. Whitehorse, Yukon. Arctic Health Research Network – Yukon.
Council of Canadian Academies. 2014. Aboriginal Food Security in Northern Canada: An Assessment of the State of Knowledge. Ottawa. Expert Panel on the State of Knowledge of Food Security in Northern Canada, Council of Canadian Academies.
Rotenberg, Cristine. 2016. Aboriginal Peoples Survey, 2012: Social Determinants of Health for the Off-Reserve First Nations Population, 15 Years of Age and Older, 2012. Statistics Canada Catalogue no. 89-653-X. Ottawa.
United Nations. 2020. COVID-19 and Indigenous peoples. Retrieved 05 May 2020 from https://www.un.org/development/desa/indigenouspeoples/covid-19.html.
Willows, Noreen, Paul Veugelers, Kim Raine and Stefan Kuhle. 2011. “Associations between household food insecurity and health outcomes in the Aboriginal population (excluding reserves).” Health Reports. Vol. 22, no. 2. Statistics Canada Catalogue no. 82-003-X.
- Date modified: