Canada at a Glance 2017
Agriculture
Archived Content
Information identified as archived is provided for reference, research or recordkeeping purposes. It is not subject to the Government of Canada Web Standards and has not been altered or updated since it was archived. Please "contact us" to request a format other than those available.

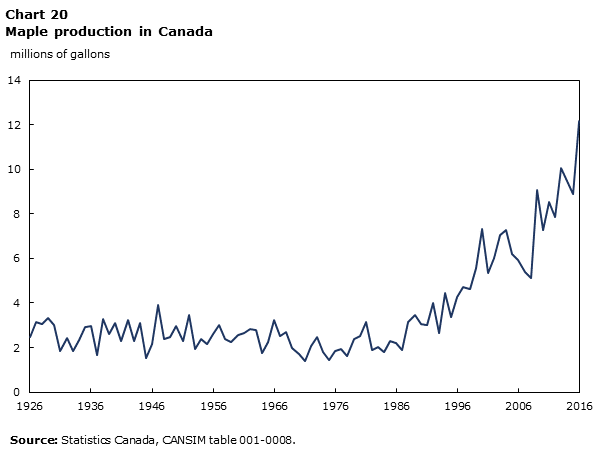
Data Table for Chart 20
| maple production | |
|---|---|
| 1926 | 2.46 |
| 1927 | 3.138 |
| 1928 | 3.067 |
| 1929 | 3.344 |
| 1930 | 3.007 |
| 1931 | 1.832 |
| 1932 | 2.436 |
| 1933 | 1.842 |
| 1934 | 2.333 |
| 1935 | 2.907 |
| 1936 | 2.946 |
| 1937 | 1.674 |
| 1938 | 3.3 |
| 1939 | 2.593 |
| 1940 | 3.098 |
| 1941 | 2.276 |
| 1942 | 3.251 |
| 1943 | 2.299 |
| 1944 | 3.09 |
| 1945 | 1.53 |
| 1946 | 2.144 |
| 1947 | 3.923 |
| 1948 | 2.394 |
| 1949 | 2.484 |
| 1950 | 2.983 |
| 1951 | 2.308 |
| 1952 | 3.448 |
| 1953 | 1.922 |
| 1954 | 2.373 |
| 1955 | 2.172 |
| 1956 | 2.589 |
| 1957 | 3.012 |
| 1958 | 2.374 |
| 1959 | 2.231 |
| 1960 | 2.554 |
| 1961 | 2.645 |
| 1962 | 2.822 |
| 1963 | 2.791 |
| 1964 | 1.77 |
| 1965 | 2.254 |
| 1966 | 3.226 |
| 1967 | 2.504 |
| 1968 | 2.697 |
| 1969 | 1.962 |
| 1970 | 1.712 |
| 1971 | 1.394 |
| 1972 | 2.053 |
| 1973 | 2.485 |
| 1974 | 1.815 |
| 1975 | 1.435 |
| 1976 | 1.831 |
| 1977 | 1.94 |
| 1978 | 1.609 |
| 1979 | 2.366 |
| 1980 | 2.521 |
| 1981 | 3.128 |
| 1982 | 1.904 |
| 1983 | 2.002 |
| 1984 | 1.813 |
| 1985 | 2.271 |
| 1986 | 2.215 |
| 1987 | 1.91 |
| 1988 | 3.134 |
| 1989 | 3.441 |
| 1990 | 3.073 |
| 1991 | 2.994 |
| 1992 | 4.011 |
| 1993 | 2.669 |
| 1994 | 4.449 |
| 1995 | 3.369 |
| 1996 | 4.287 |
| 1997 | 4.736 |
| 1998 | 4.616 |
| 1999 | 5.553 |
| 2000 | 7.319 |
| 2001 | 5.357 |
| 2002 | 6.01 |
| 2003 | 7.05 |
| 2004 | 7.284 |
| 2005 | 6.182 |
| 2006 | 5.933 |
| 2007 | 5.384 |
| 2008 | 5.132 |
| 2009 | 9.078 |
| 2010 | 7.274 |
| 2011 | 8.551 |
| 2012 | 7.855 |
| 2013 | 10.053 |
| 2014 | 9.486 |
| 2015 | 8.907 |
| 2016 | 12.16 |
| Source: Statistics Canada, CANSIM table 001-0008. | |
| Operating revenue | Operating expenses | Operating margin | |
|---|---|---|---|
| average (dollars) | % | ||
| All farms | 418,080 | 347,084 | 17.0 |
| Grain and oilseed | 362,967 | 278,476 | 23.3 |
| Potato | 1,411,033 | 1,172,514 | 16.9 |
| Other vegetables and melon | 513,372 | 435,772 | 15.1 |
| Fruit and tree nut | 262,194 | 225,588 | 14.0 |
| Greenhouse, nursery and floriculture | 1,356,411 | 1,206,943 | 11.0 |
| Other crop | 125,081 | 96,658 | 22.7 |
| Beef cattle and feedlots | 335,383 | 309,619 | 7.7 |
| Dairy cattle and milk production | 645,333 | 491,721 | 23.8 |
| Hog and pig | 2,413,747 | 2,118,885 | 12.2 |
| Poultry and egg | 1,230,019 | 1,043,820 | 15.1 |
| Other animal | 222,294 | 190,767 | 14.2 |
| Sources: Statistics Canada, CANSIM tables 002-0044 and 002-0055. | |||
| 2011 | 2015 | 2011 to 2015 | |
|---|---|---|---|
| tonnes | % change | ||
| Total finfish | 132 146 | 151 031 | 14.3 |
| Salmon | 110 328 | 121 926 | 10.5 |
| Trout | 5 600 | 7 062 | 26.1 |
| Steelhead | 694 | 718 | 3.5 |
| Other finfish | 788 | 1 177 | 49.4 |
| Total shellfish | 37 560 | 36 343 | -3.2 |
| Clams | 1 513 | 2 402 | 58.8 |
| Oysters | 9 779 | 11 153 | 14.1 |
| Mussels | 25 897 | 22 725 | -12.2 |
| Scallops | 300 | 31 | -89.7 |
| Other shellfish | 71 | 32 | -54.9 |
| Source: Statistics Canada, CANSIM table 003-0001. | |||
- Date modified:
