Canada at a Glance 2016
Travel, Transport
Archived Content
Information identified as archived is provided for reference, research or recordkeeping purposes. It is not subject to the Government of Canada Web Standards and has not been altered or updated since it was archived. Please "contact us" to request a format other than those available.
Tables
| Country of origin | Overnight trips | ||
|---|---|---|---|
| Trips | Nights | Spending in Canada | |
| thousands | CAN$ millions | ||
| United States | 11,508 | 51,443 | 7,269 |
| United Kingdom | 659 | 8,444 | 1,032 |
| France | 465 | 8,216 | 764 |
| China | 448 | 15,365 | 1,026 |
| Germany | 324 | 5,525 | 553 |
| Australia | 283 | 5,144 | 808 |
| Japan | 262 | 3,517 | 476 |
| India | 183 | 7,472 | 281 |
| South Korea | 175 | 4,244 | 293 |
| Mexico | 170 | 2,461 | 270 |
| Hong Kong | 133 | 1,987 | 180 |
| Italy | 117 | 1,301 | 132 |
| Source: Statistics Canada, Tourism and the Centre for Education Statistics. | |||
| Country visited | Overnight visits | ||
|---|---|---|---|
| Visits | Nights | Spending in country | |
| thousands | CAN$ millions | ||
| United States | 23,009 | 233,341 | 21,195 |
| Mexico | 1,900 | 25,979 | 2,262 |
| United Kingdom | 1,125 | 13,692 | 1,353 |
| France | 1,019 | 12,355 | 1,334 |
| Cuba | 844 | 8,882 | 780 |
| Dominican Republic | 528 | 6,086 | 562 |
| Italy | 468 | 5,021 | 572 |
| Germany | 467 | 4,397 | 420 |
| China | 367 | 7,526 | 758 |
| Spain | 332 | 3,846 | 360 |
| Netherlands | 275 | 2,040 | 221 |
| Republic of Ireland | 271 | 3,345 | 332 |
| Source: Statistics Canada, Tourism and the Centre for Education Statistics. | |||
Chart

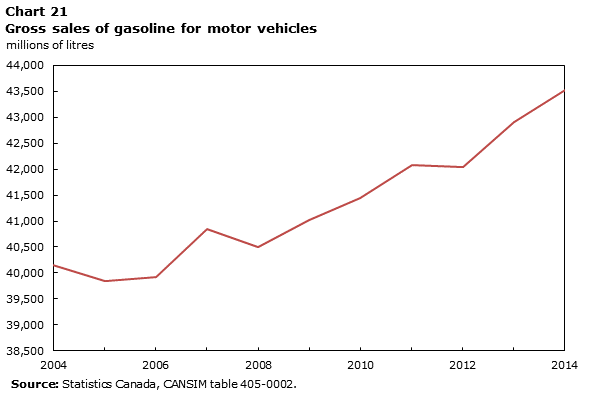
Description for Chart 21
| millions of litres | |
|---|---|
| 2004 | 40,146.0 |
| 2005 | 39,845.9 |
| 2006 | 39,918.3 |
| 2007 | 40,848.5 |
| 2008 | 40,496.0 |
| 2009 | 41,028.5 |
| 2010 | 41,452.7 |
| 2011 | 42,076.4 |
| 2012 | 42,032.5 |
| 2013 | 42,902.5 |
| 2014 | 43,522.5 |
Source:
Statistics Canada, CANSIM table 405-0002.
- Date modified:
