Canada at a Glance 2016
Agriculture
Archived Content
Information identified as archived is provided for reference, research or recordkeeping purposes. It is not subject to the Government of Canada Web Standards and has not been altered or updated since it was archived. Please "contact us" to request a format other than those available.
Tables
| 2006 | 2011 | 2006 to 2011 | |
|---|---|---|---|
| number | % change | ||
| All farms | 229,373 | 205,730 | -10.3 |
| Cattle ranching and farming | 75,598 | 49,613 | -34.4 |
| Hog and pig farming | 6,040 | 3,470 | -42.5 |
| Poultry and egg production | 4,578 | 4,484 | -2.1 |
| Sheep and goat farming | 3,815 | 3,924 | 2.9 |
| Other animal production | 26,779 | 24,124 | -9.9 |
| Oilseed and grain farming | 61,667 | 61,692 | 0.0 |
| Vegetable and melon farming | 5,239 | 4,822 | -8.0 |
| Fruit and tree nut farming | 8,329 | 8,253 | -0.9 |
| Greenhouse, nursery and floriculture production | 8,754 | 7,946 | -9.2 |
| Other crop farming | 28,574 | 37,402 | 30.9 |
| Source: Statistics Canada, censuses of agriculture. | |||
| Operating revenueNote p: preliminary | Operating expensesNote p: preliminary | Operating marginNote p: preliminary | |
|---|---|---|---|
| average ($) | % | ||
| All farms | 415,380 | 343,870 | 17.2 |
| Grain and oilseed | 358,006 | 272,416 | 23.9 |
| Potato | 1,405,421 | 1,161,468 | 17.4 |
| Other vegetable and melon | 500,340 | 420,438 | 16.0 |
| Fruit and tree nut | 251,399 | 219,421 | 12.7 |
| Greenhouse, nursery and floriculture | 1,399,163 | 1,228,730 | 12.2 |
| Other crop | 124,836 | 94,323 | 24.4 |
| Beef cattle and feedlots | 334,943 | 310,432 | 7.3 |
| Dairy cattle and milk production | 643,714 | 487,880 | 24.2 |
| Hog and pig | 2,396,491 | 2,112,375 | 11.9 |
| Poultry and egg | 1,231,654 | 1,042,531 | 15.4 |
| Other animal | 208,291 | 184,224 | 11.6 |
|
p preliminary Source: Statistics Canada, CANSIM tables 002-0044, 002-0055 and 002-0056. |
|||
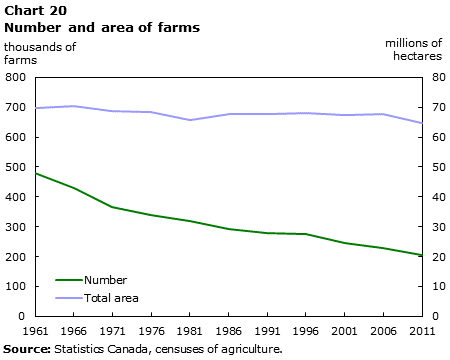
Chart

Description for Chart 20
| Number | Total area | |
|---|---|---|
| thousands of farms | millions of hectares | |
| 1961 | 480.877 | 69.825 |
| 1966 | 430.503 | 70.464 |
| 1971 | 366.110 | 68.661 |
| 1976 | 338.552 | 68.425 |
| 1981 | 318.361 | 65.889 |
| 1986 | 293.089 | 67.826 |
| 1991 | 280.043 | 67.754 |
| 1996 | 276.548 | 68.055 |
| 2001 | 246.923 | 67.502 |
| 2006 | 229.373 | 67.587 |
| 2011 | 205.730 | 64.813 |
Source:
Statistics Canada, censuses of agriculture.
- Date modified:
