
Science and survey management
Section 4. Rapid CARI feedback
Interviewers can contribute in several ways to the total error of a survey estimate, affecting coverage, nonresponse, and measurement errors (Schaeffer, Dykema and Maynard, 2010; West and Blom, 2017). There can be complex interactions among these different interviewer-related error sources. For example, there may be a tradeoff between coverage and nonresponse errors (Tourangeau et al., 2012); in our study, the interviewers with the highest response rates also found the fewest eligible households. In a series of papers, West and his colleagues (West and Olson, 2010; West, Kreuter and Jaenichen, 2013; West, Conrad, Kreuter and Mittereder, 2018) have shown that different interviewers may elicit different answers because of differences in the respondents they recruit (e.g., some interviewers may be better than others at recruiting older respondents) but also because of differences in their levels of measurement error. As anyone who has ever listened to CARI recordings can testify, interviewers do not always stick to the script and their improvisations can sometimes elicit poor quality responses.
Pilot study. Having listened to recordings of field interviewers as part of the field test for a major national study, we designed an experiment to test the hypothesis that providing timely feedback to interviewers about their reading of the questions would improve the quality of the answers they elicited. (At the client’s request, we do not divulge the name of the study.) This particular survey was a good test bed for assessing the effects of rapid feedback because the interviewers administered a short screening questionnaire to a household informant and then similar questions were administered to each sample member via audio computer-assisted self-interviewing (ACASI). As a result, we could compare the screening data collected by each interviewer with a “gold standard” for several of the key items in the survey. Of course, the ACASI data are not error-free, but we regarded them as less error-prone than the screener data for two reasons: Each person reported for himself or herself whereas the screener was administered to a single household informant; and the questions were self-administered rather than administered by an interviewer and self-administration was likely to reduce any social desirability bias in the responses.
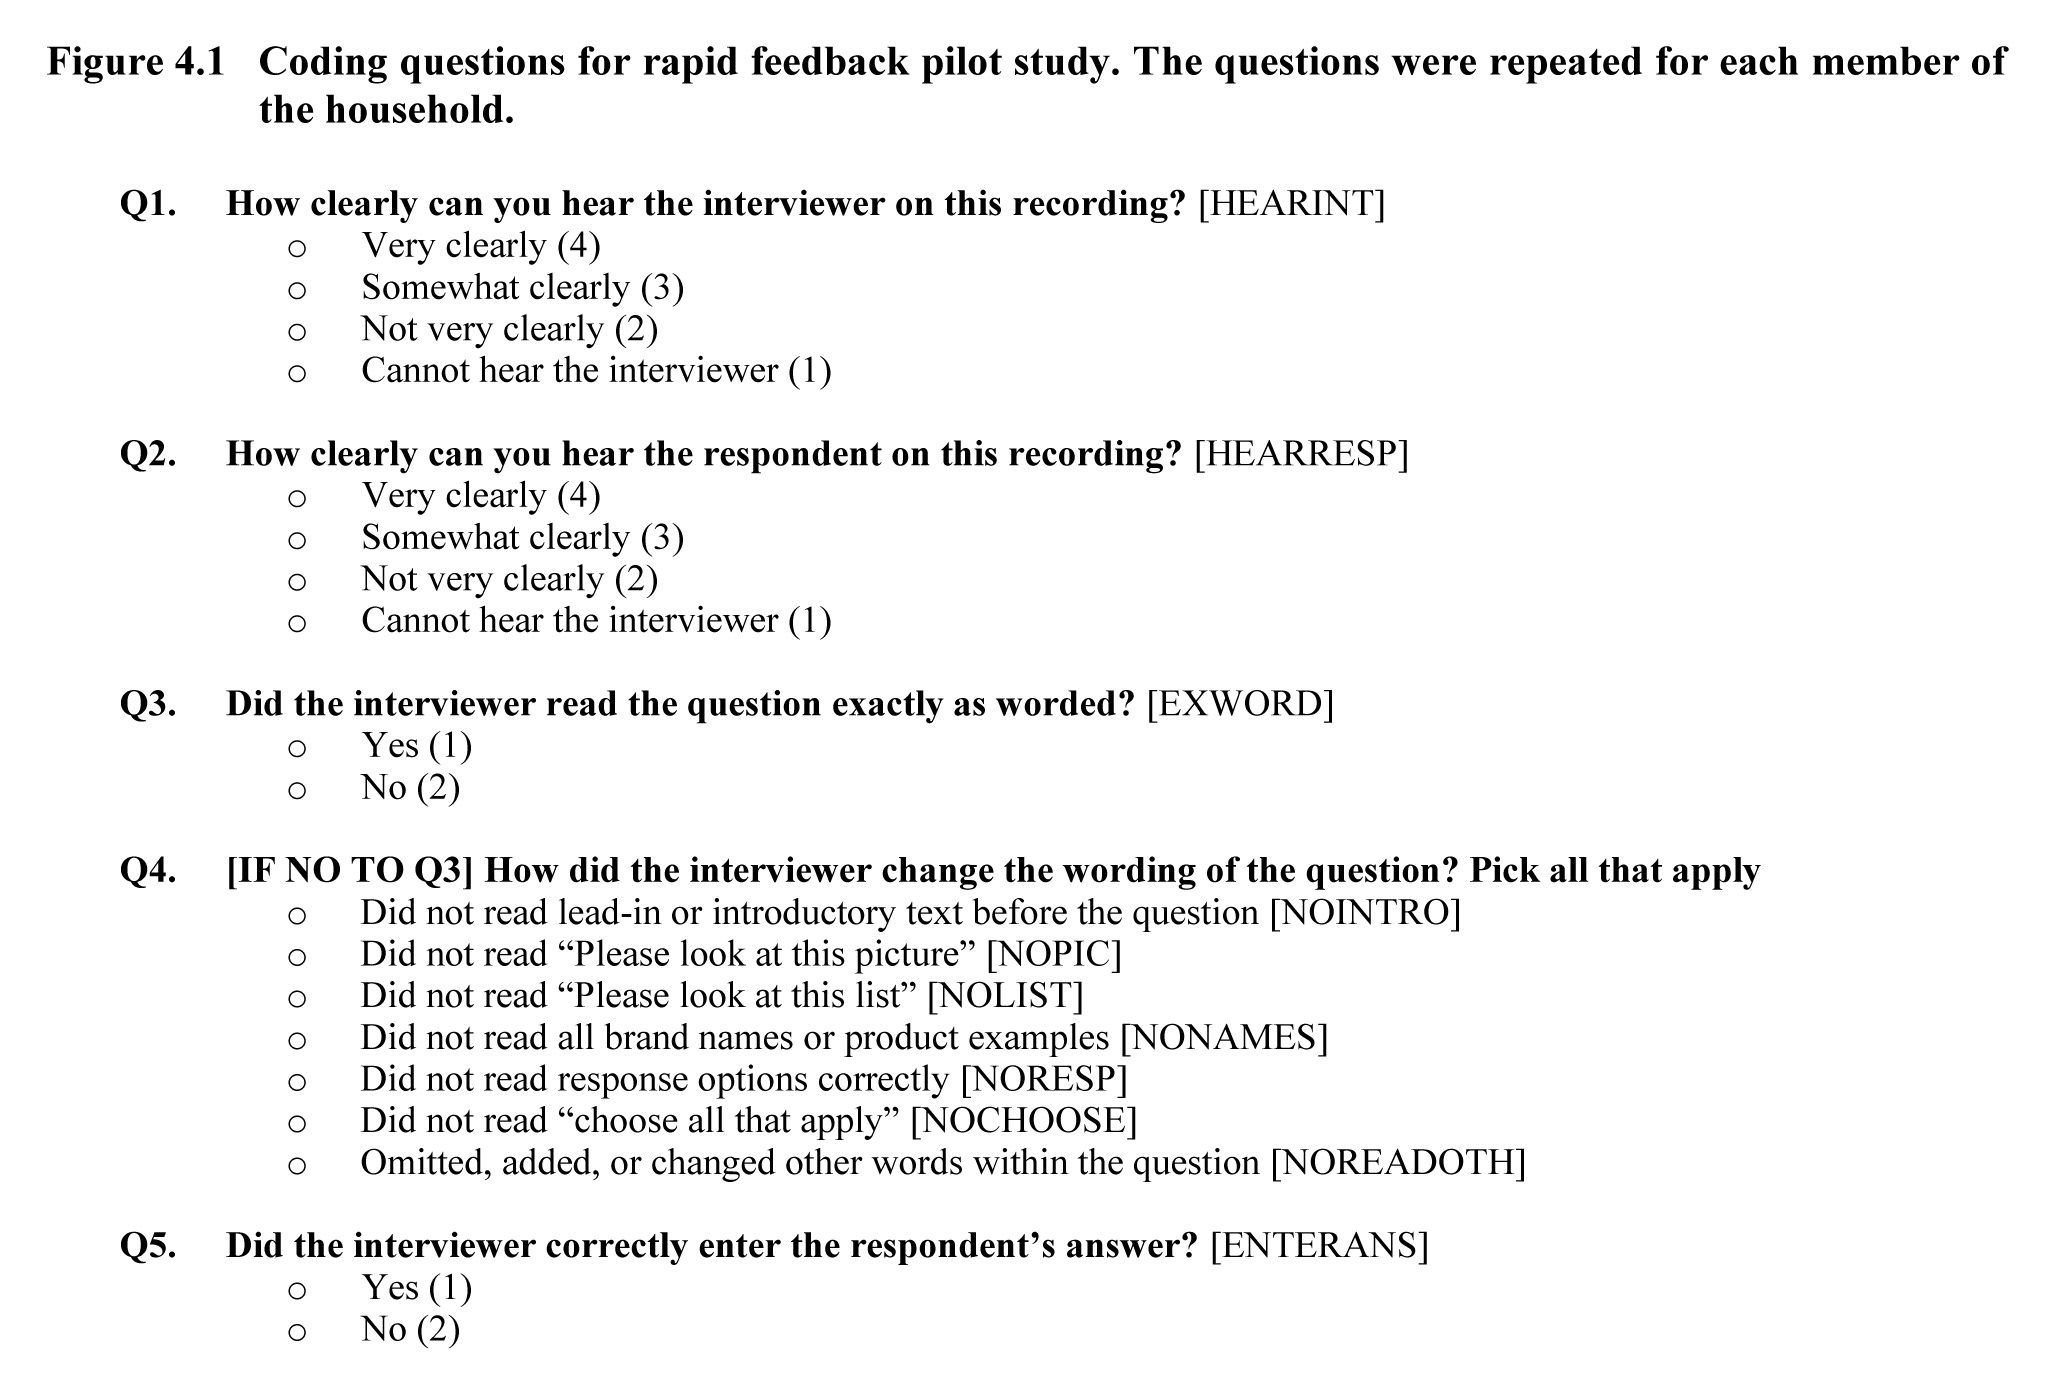
The experiment included 291 interviewers. Half were assigned to receive rapid feedback and half were assigned to the control group. Every fifth screener done by interviewers in the rapid feedback group was CARI-coded to identify departures from standardized interviewing. Figures 4.1 displays the questions coders answered for each screening interview. After a screener was coded, interviewers (and their supervisors) were sent a report with their performance and a link to the question recordings. For their first coded screener, interviewers were instructed to schedule a feedback session with a central office “mentor”, who reviewed the results and provided guidance for improvement. For their second coded screener, interviewers were sent only the report and a link to the recordings. For subsequent screeners, interviewers were only instructed to schedule a feedback session with their mentor if the coding identified problems; otherwise, they were only sent the written report.
Description for Figure 4.1
Figure representing the coding questions coders answered for each screening interview for the rapid feedback pilot study. The questions were repeated to each member of the household. There were five questions to provide feedback on the conduct of the interview. Questions Q1, Q2, Q3 and Q5 are followed by the name of the variable representing the question. Question Q3 allows to select several answers that apply, these answers being followed by the name of the variable representing the answer. Question Q1 and Q2 assess the clarity of the recording on a scale from “Cannot hear the interviewer” to “Very clearly”. Question Q3 concerns the wording of the question asked by the interviewer and is answered by “Yes” or “No”. Question Q4 is conditional on having answered “No” to question Q3 and assesses how the interviewer changed the wording of the question. Finally, question Q5 is about the correctness of the interviewer’s entry of the respondent’s answer and is answered by “Yes” or “No”.
The experiment was conducted from May to August, 2014, with 1,729 respondents interviewed by the feedback group and 1,717 interviewed by the control group.
To evaluate the effects of rapid feedback, we compared three variables derived from the screening items to the corresponding variables from the ACASI interviews. In principle, the two should match. Table 4.1 shows the proportion of respondents in the treatment and control groups who were classified the same way in the screener and the ACASI data. For all three, the match rate was significantly higher for respondents who were interviewed by interviewers getting feedback. (We used a Rao-Scott test that took into account the clustering of the sample by areas. All three -values were significant at Kappa values measuring the chance corrected agreement between screener and ACASI responses are substantially higher for interviewers in the rapid feedback group as well.
| Rapid feedback | Control | Rao-Scott value (1 and 230 df) | |
|---|---|---|---|
| Composite | |||
| % Agree | 93% | 88% | 15.5Note *** |
| Kappa | 0.85 | 0.76 | |
| Variable 1 | |||
| % Agree | 95% | 92% | 8.8Note ** |
| Kappa | 0.89 | 0.83 | |
| Variable 2 | |||
| % Agree | 89% | 85% | 7.7Note ** |
| Kappa | 0.76 | 0.69 | |
|
|||
MEPS study. Based on the success of this initial study, Edwards, Sun and Hubbard (2019) undertook a replication. In 2018, the Medical Expenditure Panel survey had implemented a major upgrade of the CAPI system and had simplified some sections of the questionnaire. Two question series were of particular interest because they were asked in all interviews, always recorded in CARI (almost all respondents gave consent to record), and were critical for producing data on the use and cost of health care services, key MEPS statistics. These were the questions on the use of calendars or other records of medical care during the interview and “provider probes”, filter questions that prompt the respondent to recall services from various types of medical providers. The calendar series asked whether various records were available during the interview (e.g., a calendar with entries for medical visits, insurance statements, etc.), and who in the household was associated with each record type. The CAPI entry area for these items was a grid, with each household member listed on a row and each record type a column header. Interviewers could enter answers in any order, by person or by record type. The objective was to encourage respondents to bring records for all family members into the interview and to structure the questioning so that the records could be incorporated into the interview in any order. The provider probes consisted of 15 questions about various kinds of health care providers. They were re-ordered in the technical upgrade to begin with three that accounted for the highest expenditures.
Audio-recordings of the calendar series and the provider probes series were reviewed by two behavior coders. The coding system allowed coders to call up specific interviewers or questions. Coders evaluated the overall quality of the interview and of each instance of asking the calendar series and the provider probes. The inter-coder agreement rate was 0.82. Verbal and written feedback was provided to the interviewer quickly (ideally within 72 hours of the interview). The next interview conducted by the interviewer was also coded, so that each interviewer had a pair of interviews in the data set, one just before and one just after feedback. Because the process was implemented in late fall only a subset (122) of the MEPS interviewers were available to participate in the study, resulting in 244 interviews in the data set. Data about the feedback interaction was also captured (such as whether the interviewer agreed with the feedback or asked for clarification). Again, we expected that interviewer behavior more consistent with the study protocol would be observed after feedback, both for overall interview quality and for each question series.
Table 4.2 shows the rapid feedback results for each question series. Interviewers maintained the meaning of the questions but did not follow the protocol exactly in the majority of instances both before and after feedback. Still, question-asking behavior that followed the protocol exactly increased from 33.4 percent before feedback to 43.4 percent after feedback; failing to maintain the question meaning decreased from 9.8 percent before feedback to 3.7 percent after feedback. An test that took into account the clustering of the observations by interviewer found a significant overall difference between interviewer behavior before and after feedback, both overall and for the provider probes The differences for the calendar series was in the same direction but not statistically significant. These results, like those of the pilot study, indicate that rapid feedback to the interviewers can lead to marked improvements in how they administer the questions.
| Interviewer Behavior | Calendar series | Provider probes | Both series | |||
|---|---|---|---|---|---|---|
| Before | After | Before | After | Before | After | |
| Followed protocol exactly | 18.6% | 27.9% | 43.3% | 51.7% | 33.4% | 43.4% |
| Maintained meaning but did not follow protocol exactly | 68.9% | 65.1% | 48.7% | 46.4% | 56.8% | 52.9% |
| Did not maintain meaning | 12.5% | 7.0% | 8.0% | 2.0% | 9.8% | 3.7% |
| Total | 100.0% | 100.0% | 100.0% | 100.0% | 100.0% | 100.0% |
| 1,240 | 759 | 1,832 | 1,428 | 3,072 | 2,187 | |
- Date modified: