
Longitudinal Immigration Database (IMDB) Technical Report, 2019
7 Data evaluation and quality indicators

Archived Content
Information identified as archived is provided for reference, research or recordkeeping purposes. It is not subject to the Government of Canada Web Standards and has not been altered or updated since it was archived. Please "contact us" to request a format other than those available.
Skip to text
Text begins
7.1 Error sources
Because the IMDB is the product of several record linkages, it is subject to different sources of errors, including record linkage errors, measurement errors, and coverage errors. In this section, the sources of errors are explained and the prevalence of some of these errors is presented.
It is to be noted that, given that it is a census of immigrant taxfilers who were admitted in 1980 or thereafter, no weights are created in the IMDB. No adjustments are made for the missing tax years of filers or for linkage errors; no sampling is performed; and every linked taxfilers is kept in the final dataset. However, the linkage itself presents a form of sampling error when links are missed.
7.1.1 Record linkage errors
Datasets produced from the results of record linkages are subject to record linkage errors. Two types of errors are possible—false positives (false matches) and false negatives (false non-matches). A link is considered a false positive when two records not belonging to the same person are deemed a match. A link is considered a false negative when two records belonging to the same person are deemed a non-match.
It is possible to miss part of an immigrant’s fiscal history since some immigrants have more than one social insurance number (SIN) through time (a temporary SIN assigned at arrival to the individual as a non-permanent resident, and later a permanent SIN assigned after admission). Both SINs are required in order to have a complete fiscal history from arrival in Canada. The SDLE (described in Sections 2.3) allows for identification of these SINs. It is possible that, in a few instances, some SIN connections are missed or false connections are made.
7.1.2 Measurement errors
Measurement error is the difference between a variable’s measured value and its true value. This type of error can be attributed to a number of factors, including data capture (e.g., typos) and respondent error (e.g., misinterpretation of the question asked). This type of error was taken into account in the creation of the Integrated Permanent and Non-permanent Resident File (PNRF) to avoid conflicting information for any individual. For example, when a person has a record on both the ILF and the NRF, and the sociodemographic variables have inconsistent values, the values at admission (in the ILF) are kept. See sections 7.2 and section 7.5 for some counts.
7.1.3 Coverage errors
Coverage errors are the result of omissions, erroneous additions, duplicates, and errors of classification of records in the database. Coverage errors can result from inadequate coverage of the population. They can create biased estimates, and the impact can vary for different sub-groups of the population. These errors often result in undercoverage. Undercoverage in the IMDB is in part the result of the exclusion of tax files of immigrant taxfilers from the database. Immigrants who do not file taxes for a given year or who file late would not have an IMDB_T1FF record although linked to tax and part of the population of interest. If, for any reason, an immigrant record was not included in the Immigrant Landing File (ILF), it would not be part of the IMDB. Overcoverage is the result of the addition to the database of records excluded from the target population. An immigrant could have more than one ILF record as a result of multiple admissions not identified as such, for example. Please refer to Section 7.4 and Appendix B for more information on IMDB coverage.
7.2 Data accuracy
This section will discuss the accuracy of the immigration data. For details on the accuracy of the T1 Family File (T1FF), please refer to the T1FF entry (record number 4105).
The accuracy of the IMDB is dependent on the representativeness of the population included in it. A study conducted in the first years of the IMDB concluded that the IMDB “appears to be representative of the population most likely to file tax returns. Therefore, the results obtained from the IMDB should not be inferred to the immigrant population as a whole, but rather to the universe of tax-filing immigrants” (Carpentier and Pinsonneault 1994).
The reasons for the differences between taxfilers and the entire foreign-born population are explained in an article by Badets and Langlois (2000) describing the challenges of using the IMDB:
The characteristics of the immigrant taxfiler population will differ from those of the entire foreign-born population because the tendency or requirement to file a tax return will vary in relation to a person’s age, family status, and other factors. One would expect a higher percentage of males to file a tax return, for example, because males have higher labour force participation rates than females. The extent to which immigrants are “captured” in the IMDB will also be influenced by changes to the income tax. For example, the introduction of federal and provincial non-refundable tax credit programs encourage individuals with no taxable income to file a return to qualify for certain tax credits. (Badets and Langlois 2000)
7.2.1 2019 IMDB: Linkage rates
This section is based on the 2019 IMDB. The overall linkage rate between IRCC immigration file and the SDLE Derived Record Depository was 97.1% (see Section 4). A link does not necessarily mean that a tax file is available since it is possible to link dependents of taxfilers or immigrants who have yet to file taxes. This SDLE theoretical linkage rate mostly informs on how well IRCC files could be associated within a larger repository environment.
Of the immigrants who landed in any year from 1980 to 2018, 84.6% were linked to at least one T1FF record. This rate represents the effective coverage of immigrant linkage to tax files. As presented in the following statistics, this coverage rate may change according to gender and age.
The proportion of linked taxfilers by age group at admission and sex is shown in Table 5. The lower rates for the 0-to-14 age group are expected since those in this age group are not of working age. See Appendix B for rates by sex, age group and admission cohort.
| Age at landing | |||||||
|---|---|---|---|---|---|---|---|
| 0 to 14 | 15 to 24 | 25 to 34 | 35 to 49 | 50 to 64 | 65 and older | Total | |
| percent | |||||||
| Male | 57.6 | 92.3 | 93.3 | 93.0 | 89.9 | 78.4 | 84.5 |
| Female | 56.8 | 91.5 | 93.3 | 93.4 | 88.2 | 76.6 | 84.8 |
| Total | 57.2 | 91.9 | 93.3 | 93.2 | 89.0 | 77.4 | 84.6 |
| Source: Statistics Canada, 2019 Longitudinal Immigration Database. | |||||||
As immigrants become older, they start filing taxes and are included in the IMDB. Chart 1 shows that, among immigrants who landed at any age from birth to age 14, the proportion of linked taxfilers is higher for immigrants who landed prior to 2000 than for immigrants who have landed since 2000. Recent immigrants also have lower linkage rates. See Appendix B for table showing the proportion of linked taxfilers by age group at admission, sex and admission decade.

Data table for Chart 1
| Cohorts | Age groups | |||||
|---|---|---|---|---|---|---|
| 0 to 14 years | 15 to 24 years | 25 to 34 years | 35 to 49 years | 50 to 64 years | 65 years and older | |
| proportion | ||||||
| 1980 to 1989 cohorts | 0.82 | 0.93 | 0.94 | 0.93 | 0.83 | 0.61 |
| 1990 to 1999 cohorts | 0.81 | 0.92 | 0.93 | 0.93 | 0.89 | 0.76 |
| 2000 to 2009 cohorts | 0.64 | 0.93 | 0.92 | 0.93 | 0.93 | 0.88 |
| 2010 to 2018 cohorts | 0.14 | 0.90 | 0.94 | 0.94 | 0.90 | 0.83 |
| Source: Statistics Canada, 2019 Longitudinal Immigration Database. | ||||||
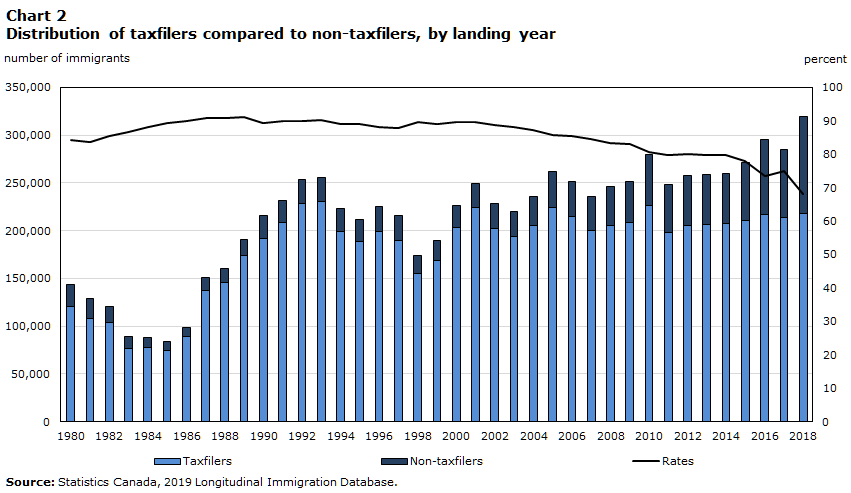
Chart 2 illustrates the proportion of filers, and the number of filers and non-filers by landing year, where the term “non-filer” means that no T1FF records are available. For the 2019 IMDB, the filing rate varies by landing year, ranging from 68.1% for those who landed in 2018 to 91.2% for those who landed in 1989. The filing rates increase with the number of years that immigrants stay in Canada; this may explain why the linkage rates are higher for those who landed in the 1990s and early 2000’s. See Appendix B, tables 14 and 15, for detailed distribution numbers by landing year.
Data table for Chart 2
| Landing Year | Taxfilers | Non-taxfilers | Rates |
|---|---|---|---|
| number of immigrants | percent | ||
| 1980 | 120,410 | 22,710 | 84.1 |
| 1981 | 107,670 | 20,910 | 83.7 |
| 1982 | 103,400 | 17,680 | 85.4 |
| 1983 | 77,090 | 11,950 | 86.6 |
| 1984 | 77,510 | 10,520 | 88.0 |
| 1985 | 75,020 | 8,920 | 89.4 |
| 1986 | 88,980 | 9,790 | 90.1 |
| 1987 | 137,490 | 13,680 | 91.0 |
| 1988 | 146,210 | 14,550 | 90.9 |
| 1989 | 173,880 | 16,780 | 91.2 |
| 1990 | 192,170 | 23,260 | 89.2 |
| 1991 | 208,540 | 23,280 | 90.0 |
| 1992 | 228,700 | 25,230 | 90.1 |
| 1993 | 230,790 | 24,880 | 90.3 |
| 1994 | 198,810 | 24,780 | 88.9 |
| 1995 | 188,810 | 23,340 | 89.0 |
| 1996 | 198,630 | 26,730 | 88.1 |
| 1997 | 189,420 | 26,040 | 87.9 |
| 1998 | 155,460 | 18,230 | 89.5 |
| 1999 | 168,810 | 20,550 | 89.1 |
| 2000 | 203,400 | 23,350 | 89.7 |
| 2001 | 224,190 | 25,580 | 89.8 |
| 2002 | 202,760 | 25,450 | 88.8 |
| 2003 | 194,110 | 26,410 | 88.0 |
| 2004 | 205,190 | 30,160 | 87.2 |
| 2005 | 224,680 | 37,100 | 85.8 |
| 2006 | 214,560 | 36,550 | 85.4 |
| 2007 | 199,770 | 36,410 | 84.6 |
| 2008 | 205,380 | 41,230 | 83.3 |
| 2009 | 208,910 | 42,680 | 83.0 |
| 2010 | 225,880 | 54,190 | 80.7 |
| 2011 | 197,780 | 50,350 | 79.7 |
| 2012 | 205,620 | 51,620 | 79.9 |
| 2013 | 205,970 | 52,540 | 79.7 |
| 2014 | 207,230 | 52,280 | 79.9 |
| 2015 | 211,020 | 59,980 | 77.9 |
| 2016 | 216,730 | 78,660 | 73.4 |
| 2017 | 213,860 | 71,460 | 75.0 |
| 2018 | 217,650 | 102,140 | 68.1 |
| Source: Statistics Canada, 2019 Longitudinal Immigration Database. | |||
7.2.2 Availability of date of death
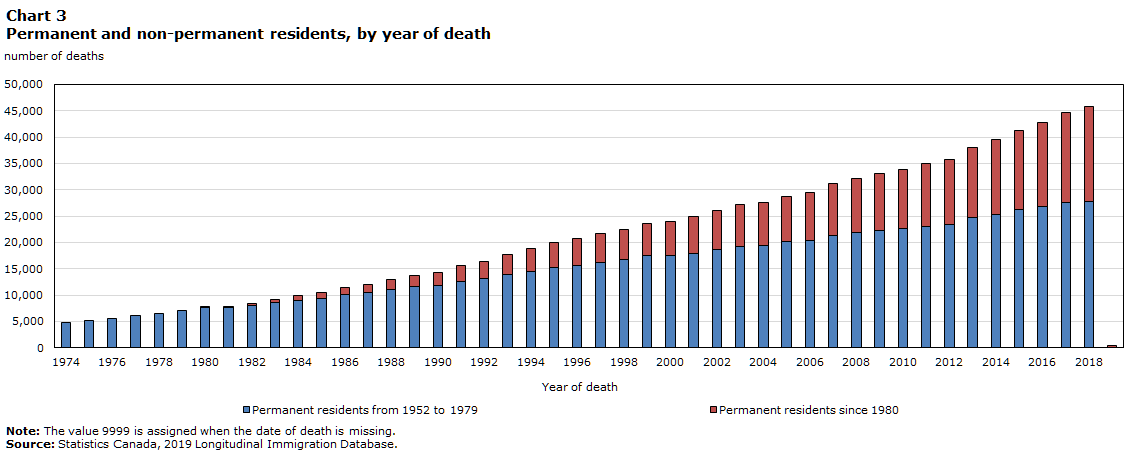
The year and month of death, as well as a death flag, are included in the PNRF. In the 2019 IMDB, these variables were linked by using the Canadian Mortality Database (CMDB). In the past, these variables were based on Statistics Canada’s Amalgamated Mortality Database (AMDB), which is a retired dataset that combined records between CMDB and vital statistics and tax files. The CMDB is an administrative database that collects information on death dates and cause of death from all provincial and territorial vital statistics registries in Canada. Some undercoverage, while minimal, exists in the database as it does not include deaths of Canadians (1) who died outside of Canada, with the exception of United States; (2) who served as members of the Canadian military, or (3) whose bodies were unidentified. Note that the CMDB does not include deaths which were reported in the tax files.
Chart 3 describes the general trend in the number of deaths per year since 1974 for immigrants admitted since 1952. The availability of data for pre-1980 admission was recently added to the IMDB. The value “9999” represents the records of deceased immigrants for which the year of death is not available.
Data table for Chart 3
| Year of death | Permanent residents from 1952 to 1979 | Permanent residents since 1980 |
|---|---|---|
| number of deaths | ||
| 1974 | 4,840 | 0 |
| 1975 | 5,270 | 0 |
| 1976 | 5,580 | 0 |
| 1977 | 6,220 | 0 |
| 1978 | 6,520 | 0 |
| 1979 | 7,090 | 0 |
| 1980 | 7,690 | 80 |
| 1981 | 7,620 | 300 |
| 1982 | 7,960 | 510 |
| 1983 | 8,530 | 730 |
| 1984 | 8,940 | 940 |
| 1985 | 9,370 | 1,110 |
| 1986 | 10,090 | 1,330 |
| 1987 | 10,470 | 1,630 |
| 1988 | 11,080 | 1,900 |
| 1989 | 11,560 | 2,210 |
| 1990 | 11,860 | 2,440 |
| 1991 | 12,660 | 2,910 |
| 1992 | 13,200 | 3,200 |
| 1993 | 13,980 | 3,750 |
| 1994 | 14,480 | 4,280 |
| 1995 | 15,270 | 4,710 |
| 1996 | 15,690 | 5,110 |
| 1997 | 16,160 | 5,450 |
| 1998 | 16,730 | 5,760 |
| 1999 | 17,490 | 6,180 |
| 2000 | 17,520 | 6,380 |
| 2001 | 17,970 | 6,930 |
| 2002 | 18,690 | 7,310 |
| 2003 | 19,140 | 8,070 |
| 2004 | 19,390 | 8,270 |
| 2005 | 20,120 | 8,650 |
| 2006 | 20,360 | 9,100 |
| 2007 | 21,300 | 9,860 |
| 2008 | 21,820 | 10,280 |
| 2009 | 22,320 | 10,770 |
| 2010 | 22,700 | 11,150 |
| 2011 | 22,980 | 11,940 |
| 2012 | 23,500 | 12,180 |
| 2013 | 24,790 | 13,190 |
| 2014 | 25,340 | 14,160 |
| 2015 | 26,230 | 15,010 |
| 2016 | 26,860 | 15,870 |
| 2017 | 27,620 | 17,140 |
| 2018 | 27,800 | 17,990 |
| 9999 | 30 | 490 |
|
Note: The value 9999 is assigned when the date of death is missing. Source: Statistics Canada, 2019 Longitudinal Immigration Database. |
||
7.2.3 Prefilers compared to records on the Non-permanent Resident File (NRF)
The results included in this section are drawn from a study based on the 2014 IMDB. Prefilers are immigrants who filed taxes prior to their landing year. It is sometimes assumed that all prefilers are immigrants who were non-permanent residents prior to admission. This section discusses why it is not the case. A total of 1.26 million individuals filed taxes before officially admission in 1980 or a subsequent year—of these, 212,500 are not linked to a non-permanent resident record as may otherwise be expected. Upon further investigation, it has been discovered that most permanent resident prefilers not linked to a non-permanent resident record are likely immigrants who have filed taxes when not required: 96% of these prefilers filed taxes only for the year prior to admission, and 75% reported no income (96% had no wages). As shown in Chart 4, most of these prefilers landed in the first months of the year, prior to the deadline to file taxes for the previous year. It appears some immigrants who landed prior to the month of May filed taxes for the year prior to their landing year, for which they were not required to file.
Given these findings, whether it is appropriate to remove records with Prefiler_ind=1 and FIRST_EFFECTIVE_YEAR=. from studies on immigrants with pre-admission experience depends on the analysis since FIRST_EFFECTIVE_YEAR=. means no record is available on the non-permanent permit file.

Data table for Chart 4
| Landing month | Number of immigrants |
|---|---|
| January | 32,300 |
| February | 36,100 |
| March | 35,500 |
| April | 24,100 |
| May | 20,500 |
| June | 18,200 |
| July | 16,100 |
| August | 11,200 |
| September | 9,800 |
| October | 5,500 |
| November | 2,000 |
| December | 1,200 |
| Source: Statistics Canada, 2014 Longitudinal Immigration Database. | |
Not all immigrants with pre-admission experience are identified as prefilers: 478,100 immigrants have non-permanent resident records with Prefiler_ind=0. Depending on the subject of interest, using the FIRST_EFFECTIVE_YEAR<>. or the number of temporary resident permits (variable NUMBER_ALL_PERMITS) is more appropriate to study immigrants with pre-admission experience. Prefiler_ind=0 indicates that no tax records have been filed prior to admission, but this does not mean that the individual had no pre-admission Canadian experience.
7.2.4 Spouse indicator
The IMDB contains variables that enable data users to obtain information on marital status and spouses. The following section contains results of a study done on the 2012 IMDB. No major changes have occurred since then in the marital status codes or family flag.
The spouse identification number (SP__IDI) is derived from tax files. This information can be derived only when the respondent claims his or her spouse or common-law partner while filing taxes; this causes an underestimation of couples as compared to the marital status declared in the tax files. From the T1FF, it is also possible to obtain the marital status at time of filing.
Prior to 1991, the “single” category was not available as marital status (MSTCO). The “common-law” status was made available as of 1992 for all datasets (1982 to 2012). Since 1992, the proportion of IMDB records indicating marital status as “single” has ranged from 20% to 30%. The proportion of “separated” has declined from 30% prior to 1992 to 4% after. The other marital status categories have not been affected by pattern changes.
Analysis done on the distribution of marital status (MSTCO from tax files) and the spouse ID (SP__IDI) shows differences between the two variables. This is because values for marital status are missing for some records. In a perfect situation, the records of all married persons would have spousal information, and the records of all single persons would have no spousal information. This analysis shows data quality to be better after 1992, when separate statuses for “common-law” and “single” were introduced.
Presence of spouse reporting gaps
Further to a review of the longitudinal history of immigrants on the 2012 IMDB, some cases where the spouse or common-law partner is missing (or different) for a given year and the same spouse is declared two or three years later have been found. The Chart 5 gives a summary of these gaps.
Data table for Chart 5
| Tax year | Percent |
|---|---|
| 1980 | 16.8 |
| 1981 | 16.6 |
| 1982 | 17.1 |
| 1983 | 17.7 |
| 1984 | 17.4 |
| 1985 | 17.7 |
| 1986 | 17.7 |
| 1987 | 16.9 |
| 1988 | 14.4 |
| 1989 | 13.9 |
| 1990 | 13.4 |
| 1991 | 14.4 |
| 1992 | 13.5 |
| 1993 | 12.7 |
| 1994 | 9.8 |
| 1995 | 9.4 |
| 1996 | 8.7 |
| 1997 | 8.1 |
| 1998 | 7.8 |
| 1999 | 7.1 |
| 2000 | 6.3 |
| 2001 | 5.6 |
| 2002 | 5.0 |
| 2003 | 4.6 |
| 2004 | 4.0 |
| 2005 | 3.1 |
| 2006 | 2.9 |
| 2007 | 2.4 |
| 2008 | 1.8 |
| 2009 | 1.1 |
| 2010 | 0.7 |
| 2011 | 0.5 |
| Source: Statistics Canada, 2012 Longitudinal Immigration Database. | |
Most immigrants on the file have one or no spouse in the years from 1980 to 2012 according to the IMDB_T1FF files. It is to be noted that no marital status (and no spouse info) is available for 1.2 million immigrants out of approximately 6 million immigrants.
7.3 Imputed variables
7.3.1 Imputation of education variables
A data quality issue regarding the variables for education qualifications and years of schooling was identified. A non-negligible proportion of individuals who did not state their education qualifications or years of schooling were coded as “0” or “None” instead of “Missing” on EDUCATION_QUALIFICATIONS and YEARS_OF_SCHOOLING. This problem was prevalent from 2011 to 2014. In 2011, 35% of immigrants stated that they had no education qualifications, compared to roughly 10% in the 1990s.
This issue was resolved by imputing the education variables by means of values for education variables from 2008 to 2010 to model the most recent year’s education variables. For the imputation, variables such as admission age, immigration_category_rollup2, intended occupation, gender and country of last permanent residence were used. The nearest-neighbour imputation method was employed. The variable Education_imputation_ind (0: no; 1: yes), available in the PNRF, was created to identify records with imputed education variables.
For immigrants admitted in 2016, the number of cases where a non-stated education was coded to “0” or “None” instead of “Missing” was reduced. However, a non-negligible number of records had a missing education qualification with a valid number of years of schooling. For these records, years of schooling was used to impute a value for education qualifications.
For principal applicants admitted since 2015, under the express entry, the year of schooling in most cases are underestimated.
For the 2019 IMDB, those who were admitted between 2015 and 2018 and who were connected to an Express Entry record had their education imputed using values found in the Express Entry file. A more comprehensive education variable called Education_Derived was created, combining data from Education_Qualification, for those who were not found in the Express Entry file, and the new values from Express Entry. Users should note that the values from the Express Entry file are based on the immigration officer’s assessment of the educational qualifications of the applicant in the context of a Canadian equivalency, whereas the values from Education_Qualification are self-declared by the applicant, and do not necessarily reflect a Canadian equivalency.
7.3.2 Imputation of language variables
For the 2019 IMDB, two new language variables were added, English_IND and French_IND, reporting the first official language known at admission. For those who were admitted in 2018 or earlier, they are defined as permanent residents having English (French) as their mother tongue or having a mother tongue other than English or French while declaring English only (French only) as their knowledge of official language at admission.
For those admitted in 2019 or later, they are defined as permanent residents having declared English only (French only) as their knowledge of official language at admission or having declared English and French as their knowledge of official language at admission and reporting English (French) as the language in which they are most at ease.
7.4 Coverage
7.4.1 Coverage of the Integrated Permanent and Non-permanent Resident File (PNRF)
The 2019 Integrated Permanent and Non-permanent Resident File (PNRF) contains over 8 million records (Table 6); of these, over 7.1 million records (84.6%) are linked to at least one tax file. It is to be noted that immigration data belonging to non-taxfilers and taxfilers alike are included in a file named PNRF_ 1980_2019. The following table shows the distribution of records depending on their presence in the different immigration and tax files. About 1.9million records belong to immigrants who were temporary residents prior to becoming permanent residents; over 1.8 million of these records are linked to at least one tax file.
See Appendix B for detailed distribution numbers by landing year.
| Permanent resident | Permanent resident with non-permanent resident permit | Total | |
|---|---|---|---|
| number | |||
| Total filers | 5,223,060 | 1,829,450 | 7,052,510 |
| Total non-filers | 1,188,730 | 93,200 | 1,281,940 |
| Total | 6,411,780 | 1,922,650 | 8,334,450 |
| percent | |||
| Percent taxfilers | 81.5 | 95.2 | 84.6 |
| Source: Statistics Canada, 2019 Longitudinal Immigration Database. | |||
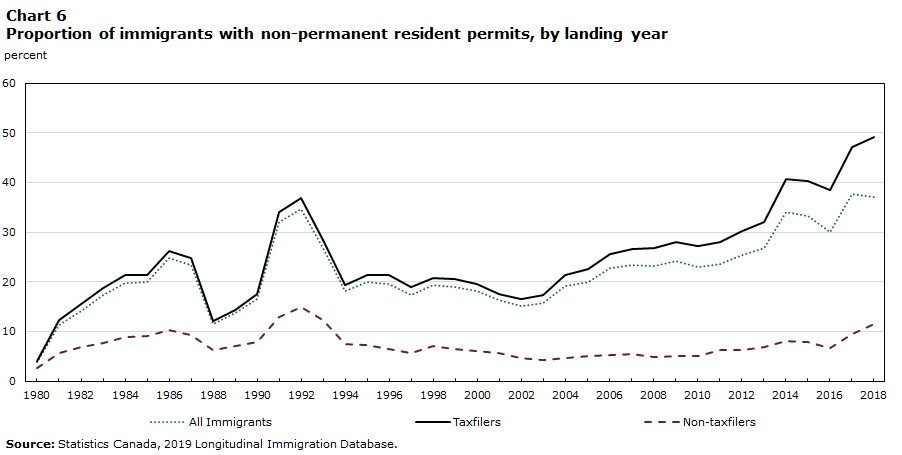
Data on immigrants with non-permanent resident permits are available. The proportion of immigrants with pre-admission experience varies by landing year (Chart 6); it ranges from 3.8% in 1980 to 37.8% in 2017. As a result, the proportion of immigrants with pre-admission experience in the early 1980s is underrepresented. The proportion of immigrant filers with pre-admission experience (solid line) is higher than the overall proportion of immigrants with pre-admission experience (dotted line) because the linkage rate for these immigrants is higher than that for immigrants without pre-admission experience.
Data table for Chart 6
| Landing Year | All Immigrants | Taxfilers | Non-taxfilers |
|---|---|---|---|
| percent | |||
| 1980 | 3.8 | 4.1 | 2.6 |
| 1981 | 11.3 | 12.4 | 5.8 |
| 1982 | 14.2 | 15.5 | 6.8 |
| 1983 | 17.3 | 18.8 | 7.7 |
| 1984 | 19.8 | 21.3 | 8.8 |
| 1985 | 20.0 | 21.3 | 9.0 |
| 1986 | 24.7 | 26.3 | 10.4 |
| 1987 | 23.4 | 24.8 | 9.2 |
| 1988 | 11.5 | 12.0 | 6.3 |
| 1989 | 13.6 | 14.3 | 7.1 |
| 1990 | 16.6 | 17.6 | 8.0 |
| 1991 | 32.0 | 34.1 | 13.0 |
| 1992 | 34.7 | 36.9 | 14.9 |
| 1993 | 26.8 | 28.4 | 12.3 |
| 1994 | 18.1 | 19.5 | 7.6 |
| 1995 | 19.9 | 21.4 | 7.4 |
| 1996 | 19.6 | 21.4 | 6.5 |
| 1997 | 17.4 | 19.0 | 5.7 |
| 1998 | 19.3 | 20.8 | 7.0 |
| 1999 | 19.0 | 20.6 | 6.4 |
| 2000 | 18.2 | 19.6 | 6.2 |
| 2001 | 16.3 | 17.5 | 5.6 |
| 2002 | 15.2 | 16.5 | 4.7 |
| 2003 | 15.7 | 17.3 | 4.2 |
| 2004 | 19.2 | 21.3 | 4.7 |
| 2005 | 20.0 | 22.5 | 5.0 |
| 2006 | 22.7 | 25.7 | 5.3 |
| 2007 | 23.3 | 26.6 | 5.4 |
| 2008 | 23.2 | 26.9 | 4.8 |
| 2009 | 24.2 | 28.1 | 5.1 |
| 2010 | 23.0 | 27.3 | 5.2 |
| 2011 | 23.6 | 28.0 | 6.2 |
| 2012 | 25.4 | 30.2 | 6.3 |
| 2013 | 26.9 | 32.0 | 6.8 |
| 2014 | 34.1 | 40.7 | 8.0 |
| 2015 | 33.2 | 40.4 | 7.9 |
| 2016 | 30.0 | 38.5 | 6.7 |
| 2017 | 37.8 | 47.2 | 9.5 |
| 2018 | 37.2 | 49.2 | 11.6 |
| Source: Statistics Canada, 2019 Longitudinal Immigration Database. | |||
7.4.1.2 Coverage of non-permanent residents
This section describes the coverage of individuals who only had non-permanent residents permits since 1980, overall tax records are available for 27.9% of them. Among individuals who have not become permanent residents, asylum seekers have the highest coverage rate, tax records are available for 40.3% of them (see table 6.B). There is a wide variety of non-permanent resident permits; some permits are as short as one day.
| With work permit | With study permits | Asylum claimants | Total | |
|---|---|---|---|---|
| number | ||||
| Total filers | 1,289,110 | 603,370 | 177,310 | 1,529,870 |
| Total non-filers | 2,243,580 | 1,617,640 | 262,420 | 3,951,330 |
| Total | 3,532,690 | 2,221,020 | 439,740 | 5,481,190 |
| percent | ||||
| Percent taxfilers | 36.5 | 27.2 | 40.3 | 27.9 |
| Source: Statistics Canada, 2019 Longitudinal Immigration Database. | ||||
7.4.2 T1 Family File (T1FF) size and coverage by year
Tax files for 1982 and subsequent years are available for linked non-permanent and permanent residents. Some permanent residents were non-permanent residents prior to admission. Table 7 gives details on the distribution of linked permanent residents with and without non-permanent permits prior to admission, by tax year. At least one tax file is available for the 81.5% of permanent residents without a non-permanent permit prior to admission and for the 95.2% of permanent residents who were non-permanent residents prior to admission. The fact that permanent residents with pre-admission temporary permits have a higher rate of filing taxes than permanent residents without pre-admission permits can be explained by a requirement in the permanent resident application process with respect to non-permanent residents. Non-permanent residents who apply for permanent residency are required to fulfil their obligation to file tax in Canada. The number of taxfilers on the IMDB_T1FF increases as the years pass since the size of the in-scope population increases.
| Permanent resident admitted prior to 1980 | Permanent resident since 1980 | Permanent resident with non-permanent resident permit | Non-permanent resident only | Number of taxfilers | |
|---|---|---|---|---|---|
| number | |||||
| 1982 | 1,633,720 | 188,314 | 55,159 | 24,786 | 1,897,209 |
| 1983 | 1,619,691 | 224,600 | 65,464 | 23,287 | 1,928,252 |
| 1984 | 1,615,316 | 263,818 | 79,829 | 23,660 | 1,977,623 |
| 1985 | 1,596,466 | 298,078 | 94,716 | 22,369 | 2,006,421 |
| 1986 | 1,651,911 | 356,204 | 124,690 | 26,369 | 2,153,218 |
| 1987 | 1,632,055 | 415,832 | 157,775 | 26,544 | 2,225,655 |
| 1988 | 1,652,439 | 508,166 | 199,260 | 35,594 | 2,387,891 |
| 1989 | 1,679,711 | 622,051 | 262,191 | 47,959 | 2,603,301 |
| 1990 | 1,688,818 | 743,453 | 309,456 | 51,308 | 2,783,542 |
| 1991 | 1,685,953 | 841,101 | 358,279 | 51,066 | 2,926,389 |
| 1992 | 1,692,359 | 947,226 | 402,212 | 50,563 | 3,081,877 |
| 1993 | 1,724,716 | 1,091,259 | 441,584 | 50,531 | 3,296,813 |
| 1994 | 1,709,448 | 1,212,686 | 467,118 | 49,688 | 3,427,451 |
| 1995 | 1,693,426 | 1,324,852 | 492,413 | 52,055 | 3,551,103 |
| 1996 | 1,674,466 | 1,432,375 | 513,221 | 53,990 | 3,662,356 |
| 1997 | 1,650,008 | 1,546,778 | 533,705 | 56,016 | 3,774,847 |
| 1998 | 1,626,034 | 1,646,612 | 553,795 | 54,928 | 3,869,742 |
| 1999 | 1,619,564 | 1,770,924 | 589,608 | 59,573 | 4,028,037 |
| 2000 | 1,601,817 | 1,914,429 | 630,090 | 67,486 | 4,202,285 |
| 2001 | 1,588,358 | 2,071,271 | 679,075 | 77,642 | 4,404,761 |
| 2002 | 1,558,415 | 2,201,293 | 716,810 | 83,288 | 4,548,334 |
| 2003 | 1,538,449 | 2,323,548 | 753,950 | 86,423 | 4,690,962 |
| 2004 | 1,522,399 | 2,454,757 | 795,865 | 87,952 | 4,849,642 |
| 2005 | 1,497,256 | 2,570,898 | 829,651 | 93,311 | 4,979,948 |
| 2006 | 1,479,491 | 2,720,371 | 886,942 | 98,304 | 5,173,997 |
| 2007 | 1,460,643 | 2,843,981 | 955,855 | 110,396 | 5,359,880 |
| 2008 | 1,440,365 | 2,969,054 | 1,034,081 | 132,946 | 5,565,587 |
| 2009 | 1,419,939 | 3,084,511 | 1,101,097 | 143,213 | 5,738,023 |
| 2010 | 1,395,149 | 3,210,533 | 1,158,235 | 152,724 | 5,906,038 |
| 2011 | 1,376,067 | 3,341,223 | 1,224,011 | 161,377 | 6,092,164 |
| 2012 | 1,349,423 | 3,459,663 | 1,291,914 | 174,266 | 6,264,904 |
| 2013 | 1,330,990 | 3,592,703 | 1,366,659 | 197,181 | 6,477,281 |
| 2014 | 1,309,274 | 3,712,175 | 1,442,937 | 224,352 | 6,678,651 |
| 2015 | 1,281,934 | 3,839,521 | 1,497,356 | 253,948 | 6,862,904 |
| 2016 | 1,253,715 | 3,961,074 | 1,544,192 | 311,662 | 7,060,970 |
| 2017 | 1,227,744 | 4,064,283 | 1,575,544 | 449,172 | 7,307,287 |
| 2018 | 1,204,382 | 4,199,974 | 1,592,911 | 641,093 | 7,629,133 |
| Total taxfilers | 2,054,432 | 5,223,052 | 1,829,450 | 1,522,358 | |
| Total non-taxfilers | 2,059,247 | 1,188,735 | 93,206 | 3,473,903 | |
| percent | |||||
| Percent taxfilers | 49.9 | 81.5 | 95.2 | 30.5 | |
|
Notes:Pemanent resident statistics are for people who were admitted between 1980 and 2018 Non-permanent residents statistics are for people who obtain their first permits between 1980 and 2018. Source: Statistics Canada, 2019 Longitudinal Immigration Database. |
|||||
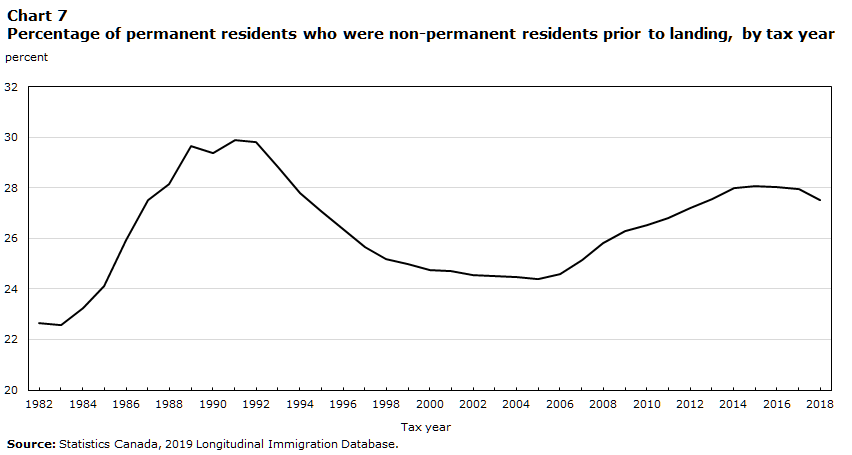
Chart 7 shows that the proportion of permanent residents who were non-permanent residents prior to admission varies by tax year from a low of 22.6% for the 1983 tax year to a high of 29.9% for the 1991 tax year. Since the 2000s, this proportion has been stable at about 26.2%.
Data table for Chart 7
| Tax year | Percent |
|---|---|
| 1982 | 22.7 |
| 1983 | 22.6 |
| 1984 | 23.2 |
| 1985 | 24.1 |
| 1986 | 25.9 |
| 1987 | 27.5 |
| 1988 | 28.2 |
| 1989 | 29.7 |
| 1990 | 29.4 |
| 1991 | 29.9 |
| 1992 | 29.8 |
| 1993 | 28.8 |
| 1994 | 27.8 |
| 1995 | 27.1 |
| 1996 | 26.4 |
| 1997 | 25.7 |
| 1998 | 25.2 |
| 1999 | 25.0 |
| 2000 | 24.8 |
| 2001 | 24.7 |
| 2002 | 24.6 |
| 2003 | 24.5 |
| 2004 | 24.5 |
| 2005 | 24.4 |
| 2006 | 24.6 |
| 2007 | 25.2 |
| 2008 | 25.8 |
| 2009 | 26.3 |
| 2010 | 26.5 |
| 2011 | 26.8 |
| 2012 | 27.2 |
| 2013 | 27.6 |
| 2014 | 28.0 |
| 2015 | 28.1 |
| 2016 | 28.0 |
| 2017 | 27.9 |
| 2018 | 27.5 |
| Source: Statistics Canada, 2019 Longitudinal Immigration Database. | |
An immigrant who filed taxes for a given year will not necessarily file taxes the next year. For example, if Person A landed in 1983, this individual might be found on tax files from 1984 to 1999, but not be found on the 2000 file, and again be found on the 2001 to 2013 files. For example, 35.6% of filers from the 1980 cohort had tax files available for all years. Out-migration, death and late filing are some of the reasons immigrant filers might stop filing permanently or for some years.
Most immigrants file taxes for the first time in the year they land or one year before or after. For example, of the
251,100 immigrants who landed in 2006, 100,880 (40.2%) filed taxes for the first time in 2006, while 15,560 (6.2%) did so in 2007 and 3,220 (1.3%) did so in 2015.
7.5 Quality assessment of the Integrated Permanent and Non-permanent Resident File (PNRF)
A validation of the content of the PNRF_1980_2019 was done. While admission and tax data are collected mandatorily from those in scope, some fields may not have been completed. They could be left empty because the response was unknown, or for other reasons unbeknownst to database users (e.g., refusal) (McLeish 2011). Item non-response can present issues when one is considering the IMDB for statistical purposes, including the following:
- If the database user is interested in producing a sample based on characteristics for which there are missing records, there will be coverage error (i.e., those being included in the sampling frame may not be representative of the target population).
- If the non-response is non-ignorable (i.e., the fact that information is missing is not a random occurrence; the fact that there is no response is indicative of what the response would have been), any analysis using those variables would be biased.
The presence of missing variables and invalid values was assessed. The numbers presented in this section are rounded. Invalid values are either inconsistent or not listed in the metadata tables available to users (see the immigration component of the data dictionary appendix). Most of the quality issues listed in Table 8 are for data collected in the 1980s and 1990s. It should be noted that some seemingly valid values may be erroneous as well.
The variable Case Identification Number (CASE_ID) has item response rates generally in the high 90% range (usually over 99%). However, for some landing years, the response rate drops significantly (to as low as 80% in 1991 and 1992). Therefore, any analysis using this variable for all landing years will under-represent those years where the item non-response is higher (e.g., 1986, 1987, 1990, 1991, 1992, 1993). No detection of invalid values was performed for the variable Case Identification Number (CASE_ID).
The variable Landing_age was defined as invalid when it was greater than 99, although it is possible in some instances that these values are accurate. It should be noted that, according to the values for this variable, the number of immigrants who landed after age 99 was much higher between 1986 and 1994 than the other landing years. This could be the result of a data capture issue.
In the 2019 PNRF, 25 records had a birth year prior to 1880, with 18 records having birth year 1753 with corresponding landing years that are post 1985, with one specific record having a landing year of 2012.
The variables related to country have quality issues as well. The country of birth is missing for some records in almost all landing years. For example, values are missing for over 100 records in each of the years from 1985 to 1993. The country of citizenship is missing for fewer than 10 records per landing year for most years (with the exception of 2004, 2005 and 2006, where over 40 records were missing per landing year). The country of residence is missing for many admission records from 2013 (this value is missing for 980 records, or 0.5% of admissions taking place that year) and 2014, (this value is missing for 4000 records, or 2% of admissions taking place that year) and 2015 (missing for 5000 records, or 3% of admissions in that year).
The education variables after imputation (see Section 6.3), have over 150 missing values per landing year from 1980 to 1984; this translates as a rate of missing values per landing year of less than
0.5%. A new derive variable using Express Entry data was used to help fill some missing data for the education variables for those admitted from 2015 to 2019.
The percentage of valid responses for the occupation variables is above 99% for all landing years.
The variables Family_Status, Mother_Tongue, Official_Language, CSQ_IND and Destination_Province have most of their missing values for records with a landing year prior to 1999.
Mother_Tongue is missing for 550 records from the 2011 admissions.
The variable Official language has an increasing number of missing values;from 2016 to 2018, over 7500 per cohort have a missing value.
The year and month of death was missing for some individuals identified as deceased (Death_Indicator=1). The value “9999” was assigned to Death_Year and the value “99” was assigned to Death_Month in cases where the year and month of death were unknown.
The variables Destination_CD, Destination_CMA, and Destination_CSD have fewer missing values in the 2019 IMDB than in previous years since the Standard Geographical Classification (SGC) updated the geographical region and code in 2016.
| PNRF variables | Valid responses | Blanks | Invalid responses | |||
|---|---|---|---|---|---|---|
| number | percent | number | percent | number | percent | |
| Case_ID | 8,673,960 | 100.00% | 0 | 0.00% | 0 | 0.00% |
| Landing_age | 8,668,980 | 99.94% | 720 | 0.01% | 4,260 | 0.05% |
| Birth_Year | 8,673,905 | 100.00% | 30 | 0.00% | 25 | 0.00% |
| Gender | 8,673,960 | 100.00% | 0 | 0.00% | 0 | 0.00% |
| Country_Birth | 8,670,850 | 99.96% | 3,110 | 0.04% | 0 | 0.00% |
| Country_Citizenship | 8,673,020 | 99.99% | 940 | 0.01% | 0 | 0.00% |
| Country_Residence | 8,657,590 | 99.81% | 16,370 | 0.19% | 0 | 0.00% |
| Education_Qualification | 8,353,750 | 96.31% | 320,210 | 3.69% | 0 | 0.00% |
| Level_of_Education | 8,673,960 | 100.00% | 0 | 0.00% | 0 | 0.00% |
| Years_of_Schooling | 8,624,460 | 99.43% | 49,500 | 0.57% | 0 | 0.00% |
| Education_Derived | 8,217,210 | 94.73% | 456,750 | 5.27% | 0 | 0.00% |
| Landing_age_6_groups | 8,673,240 | 99.99% | 720 | 0.01% | 0 | 0.00% |
| Landing_age_9_groups | 8,673,240 | 99.99% | 720 | 0.01% | 0 | 0.00% |
| Occupation_CD | 8,667,840 | 99.93% | 6,120 | 0.07% | 0 | 0.00% |
| NOC5-NOC2 | 8,667,840 | 99.93% | 6,120 | 0.07% | 0 | 0.00% |
| Skill_level_CD11 | 8,667,390 | 99.92% | 6,570 | 0.08% | 0 | 0.00% |
| Family_Status | 8,671,370 | 99.97% | 2,590 | 0.03% | 0 | 0.00% |
| Family_Status_rollup | 8,671,370 | 99.97% | 2,590 | 0.03% | 0 | 0.00% |
| Marital_status | 8,671,200 | 99.97% | 2,760 | 0.03% | 0 | 0.00% |
| Marital_status_rollup | 8,669,360 | 99.95% | 4,600 | 0.05% | 0 | 0.00% |
| Mother_Tongue | 8,671,200 | 99.97% | 2,760 | 0.03% | 0 | 0.00% |
| Official_Language | 8,634,480 | 99.54% | 39,480 | 0.46% | 0 | 0.00% |
| Special_Program | 1,385,170 | 15.97% | 7,288,790 | 84.03% | 0 | 0.00% |
| CSQ_ind | 8,673,730 | 100.00% | 230 | 0.00% | 0 | 0.00% |
| Destination_CD | 8,673,580 | 100.00% | 380 | 0.00% | 0 | 0.00% |
| Destination_CMA | 8,673,580 | 100.00% | 380 | 0.00% | 0 | 0.00% |
| Destination_CSD | 8,673,580 | 100.00% | 380 | 0.00% | 0 | 0.00% |
| Destination_Province | 8,673,580 | 100.00% | 380 | 0.00% | 0 | 0.00% |
| Permits and NPR-specific variables | 2,047,724 | 100.00% | 0 | 0.00% | 0 | 0.00% |
| Death_Year | 8,673,480 | 99.99% | 480 | 0.01% | 0 | 0.00% |
| Death_Month | 8,673,480 | 99.99% | 480 | 0.01% | 0 | 0.00% |
|
Notes: PNRF: Integrated Permanent and Non-permanent Resident File. NPR: non-permanent resident. The number of blank responses for Skill_level _CD11 combines retired and missing NOCs. Only variables with missing or invalid values were included in the table. All numbers are rounded. Source: Statistics Canada, 2019 Longitudinal Immigration Database. |
||||||
7.6 Quality Assessment of the Province of Residence Variable (PRCO_)
A validation of the geography variables included in the IMDB tax files was done. This section discusses how the variable Province of Residence (PRCO_) was derived and its quality.
The Province of residence (PRCO_) is based on information from tax filers when available. Missing information from the province of residence is replaced by information collected on the postal code of the mailing address either from the individual (PSCO_I), if available, otherwise from the family (PSCO_F).
| PRCO | Province and Territories | First character of the postal code (PSCO) |
|---|---|---|
| 0 | Newfoundland and Labrador | A |
| 2 | Prince Edward Island | B |
| 1 | Nova Scotia | C |
| 3 | New Brunswick | E |
| 4 | Quebec | G, H, J |
| 5 | Ontario | K, L, M, N ,P |
| 6 | Manitoba | R |
| 7 | Saskatchewan | S |
| 8 | Alberta | T |
| 9 | British Columbia | V |
| 10 | Northwest Territories | X |
| 11 | Yukon Territories | Y |
| 12 | Non-residents | missing |
| 14 | Nunavut | X |
| Note: The value some postal codes are U or F for blank, respectively U or US is U an Foreign is F. | ||
While the Province of residence (PRCO_) is more reliable than the Taxing province (TXPCO_), some abnormalities were observed mostly on the non-resident code in the reporting for taxation years 1989, 1993, and 1998. These may impact specific provinces.
For the 1993 tax year, IMDB_T1FF includes anomalies for the province of Manitoba with an unusual number of residents (48,130 in 1993, compared to 33,650 the tax year before, and 37,365 the tax year after). Similar changes are observed for the Northwest Territories. Additionally, 740 individuals are coded as residing in Nunavut while Nunavut was created in 1998. 725 individuals are coded as residing in multiple jurisdictions. Users can use the information from the variable PSCO_F to diminish the effect of the anomalies on their analyses that include province of residence. However, as stated above, the time are different between PSCO_ (based residence at time of filling) and PRCO_ (residence on December 31st).
Non-resident (PRCO_=12) records appear to be overestimated in the 1989 IMDB_T1FF. It includes 79,210 non-residents of Canada, with many of them having a non-permanent residency status. Users can decide to use the postal code of the mailing address (PSCO_ at the individual or family level) to derive the value of PRCO_ or remove the non-residents from their analysis.
In the 1998 IMDB_T1FF, a higher than expected number of records are assigned to Newfoundland and Labrador (PRCO_). In these cases the place of residence of the family at the time of filing is also Newfoundland based on variable PSCO_F.
- Date modified: