
Canadian Agriculture at a Glance
The changing face of the immigrant farm operator

Archived Content
Information identified as archived is provided for reference, research or recordkeeping purposes. It is not subject to the Government of Canada Web Standards and has not been altered or updated since it was archived. Please "contact us" to request a format other than those available.
Skip to text
Text begins
Immigrants have played a significant role in shaping Canada’s agricultural industry. Some immigrants become farm operators, managing the day-to-day operations of their own farms.
Results from the 2016 Census of Agriculture, along with data from the 2016 Census of Population, show that immigrants made up 8.7% of Canadian farm operators, accounting for 23,440 people. In 1996, immigrants made up 10.2% of Canadian farm operators, accounting for 39,620 people.
But that’s not the only change.
The countries of birth of Canadian immigrant farm operators have evolved over time, gradually moving away from a European origin.
In 2016, the United States and China emerged as the two most frequently reported countries of birth for Canadian immigrant farm operators over the most recent period of immigration.
Recent immigrants, that is, those who came to Canada between 2011 and 2016, represented 1.7% of immigrant farm operators in 2016.
There are many differences between other immigrant, non-immigrant, and Chinese and American immigrant farm operators who came to Canada between 2011 and 2016—everything from where they live to the type and size of farm they operate.
Start of text box‘Other immigrants’ includes farm operators who immigrated to Canada between 2011 and 2016 from countries other than the United States and China. It also includes farm operators who immigrated to Canada before 2011, regardless of the country of origin. This is done so a direct analysis can be undertaken to compare other immigrant farm operators with farm operators who recently immigrated to Canada from the United States and China.
Immigrant farm operators were more likely to come from the United States and China
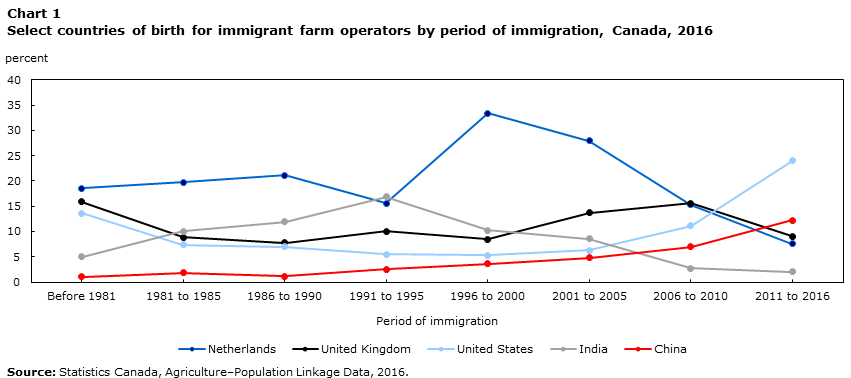
In 2016, the most frequently reported country of birth for immigrant farm operators was the United States (24.0%), followed by China (12.2%) (Chart 1).
This is significantly different from what was reported in the past. Farm operators who came to Canada before 1981 were more likely to come from Europe, with the most frequently reported country of birth being the Netherlands (18.5%), followed by the United Kingdom (15.9%) (Chart 1).
Data table for Chart 1
| Period of immigration | Country of birth | ||||
|---|---|---|---|---|---|
| Netherlands | United Kingdom | United States | India | China | |
| percent | |||||
| Before 1981 | 18.5 | 15.9 | 13.6 | 5.0 | 1.0 |
| 1981 to 1985 | 19.7 | 8.9 | 7.4 | 10.0 | 1.8 |
| 1986 to 1990 | 21.1 | 7.8 | 7.0 | 11.9 | 1.1 |
| 1991 to 1995 | 15.6 | 10.0 | 5.5 | 16.9 | 2.5 |
| 1996 to 2000 | 33.4 | 8.5 | 5.3 | 10.2 | 3.6 |
| 2001 to 2005 | 27.9 | 13.7 | 6.3 | 8.6 | 4.8 |
| 2006 to 2010 | 15.3 | 15.6 | 11.1 | 2.7 | 7.0 |
| 2011 to 2016 | 7.6 | 9.1 | 24.0 | 2.0 | 12.2 |
| Source: Statistics Canada, Agriculture–Population Linkage Data, 2016. | |||||
Start of text box
Key facts from 2016
Among immigrant farm operators who came to Canada from the United States between 2011 and 2016:
- 47.3 years was the average age
- 53.8% were female
- 46.2% were male
- 41.7% worked off the farm
- 56.5% used technology for farming
- 59.3% reported university as their highest level of educational attainment
- $32,321 was the average total income
More detail on farm operators can be found in the 2016 Agriculture–Population Linkage Data.
End of text box
Recent farm operators who immigrated to Canada from the United States were more likely to live in urban areas
More and more immigrant farm operators reported living in urban centres. In 1996, 11.0% of other immigrant farm operators reported living in urban areas; by 2016, this proportion had increased to 19.2%.
In particular, farm operators who immigrated to Canada from the United States were more likely to be urbanized.
In 2016, nearly one-quarter (24.9%) of farm operators who immigrated to Canada from the United States between 2011 and 2016 reported living in urban centres. This proportion was higher than for immigrant farm operators who came from China during the same period (15.7%) and non-immigrant farm operators (14.3%).
Ontario was the top provincial destination for recent Chinese immigrant farm operators, while British Columbia was the top destination for recent American immigrant farm operators
While the percentage of other immigrant farm operators living in Ontario declined from 39.1% in 1996 to 34.6% in 2016, this was certainly not the case for recent immigrant farm operators from China.
In 2016, the most frequently reported provincial destination for farm operators who came from China between 2011 and 2016 was Ontario (58.7%). Notably, farm operators from China reported living in only three other provinces: British Columbia (24.3%), New Brunswick (8.9%) and Saskatchewan (8.2%) (Table 1).
As the percentage of total immigrant farm operators living in British Columbia increased from 22.9% in 1996 to 26.8% in 2016, immigrant farm operators from the United States were still more likely to report living there.
In 2016, the most frequently reported provincial destination for farm operators who came from the United States between 2011 and 2016 was British Columbia (39.0%), a higher proportion than that of those from China (24.3%) and non-immigrants (8.1%) (Table 1).
| Province | Farm operators | |||
|---|---|---|---|---|
| Immigrated between 2011 and 2016 | Other immigrants | Non-immigrants | ||
| China | United States | |||
| percent | ||||
| Newfoundland and Labrador | 0.0 | 0.0 | 0S | 0.2 |
| Prince Edward Island | 0.0 | 10.7 | 0.6 | 0.7 |
| Nova Scotia | 0.0 | 0.0 | 1.7 | 1.7 |
| New Brunswick | 8.9 | 0.0 | 0.9 | 1.1 |
| Quebec | 0.0 | 4.5 | 6.6 | 16.3 |
| Ontario | 58.7 | 13.1 | 34.6 | 25.2 |
| Manitoba | 0.0 | 4.6 | 6.7 | 7.4 |
| Saskatchewan | 8.2 | 11.2 | 4.0 | 17.9 |
| Alberta | 0.0 | 17.0 | 18.1 | 21.4 |
| British Columbia | 24.3 | 39.0 | 26.8 | 8.1 |
|
0S value rounded to 0 (zero) where there is a meaningful distinction between true zero and the value that was rounded. Source: Statistics Canada, Agriculture–Population Linkage Data, 2016. |
||||
Start of text box
Key facts from 2016
Among immigrant farm operators who came to Canada from China between 2011 and 2016:
- 45.1 years was the average age
- 26.2% were female
- 73.8% were male
- 0.0% worked off the farm
- 49.4% used technology for farming
- 42.0% reported university as their highest level of educational attainment
- $13,627 was the average total income
More detail on farm operators can be found in the 2016 Agriculture–Population Linkage Data.
End of text box
More than half of recent Chinese immigrant farm operators were involved in greenhouse, nursery and floriculture production
Although the most frequently reported type of farming by other immigrants (18.6%) and non-immigrants (32.7%) in 2016 was oilseed and grain farming, over half of immigrant farm operators from China were busy working in greenhouses.
In 2016, the farm type most frequently reported by farm operators who came from China between 2011 and 2016 was greenhouse, nursery and floriculture production (56.3%) as defined by the North American Industry Classification System (NAICS). This proportion was much higher than that for farm operators who came from the United States (15.1%) and non-immigrant farm operators (3.2%).
While immigrant farm operators from China were mainly involved in greenhouse, nursery and floriculture production (NAICS), immigrant farm operators from the United States were more involved in beef cattle farming or farming to support beef cattle.
In 2016, the farm type most frequently reported for farm operators who came from the United States was other crop farming (19.2%) (NAICS), followed by beef cattle ranching and farming, including feedlots (17.6%) (NAICS). Interestingly, over three-quarters (75.4%) of farm operators from the United States involved in other crop farming specifically produced hay, which is mainly used as cattle feed.
The type of farming influences not only the size of the farm, but also the size of the revenues produced by the farm.
On average, recent American immigrant farm operators worked on larger farms than recent Chinese immigrant farm operators
The average total farm area of other immigrant farm operators increased from 334.9 acres in 1996 to 487.5 acres in 2016. While the average farm area increased for non-immigrant farm operators as well, the increase was not as large over the same 20-year period. In 1996, the average farm area of non-immigrant farm operators was 657.3 acres, and was 841.9 acres by 2016.
In 2016, the average total farm area of farm operators who came from the United States between 2011 and 2016 was 628.6 acres. This was significantly higher than for their Chinese counterparts. In 2016, the average total farm area of farm operators who came from China between 2011 and 2016 was 360.2 acres.
Although the average farm area of immigrant farm operators from China was smaller than that of their American and non-immigrant counterparts, they were more likely to own a greater portion of their farm land.
Recent Chinese immigrant farm operators were more likely to own their farm land
Although other immigrant farm operators and non-immigrant farm operators owned a little over one-half of their farm land, on average, Chinese immigrant farm operators owned over three-quarters of theirs.
In 2016, farm operators who came from China between 2011 and 2016 owned 81.7% of their farm land, on average, whereas total immigrant and non-immigrant farm operators owned 69.2% and 61.6%, respectively.
American immigrant farm operators fell somewhere in the middle. In 2016, farm operators from the United States owned, on average, 77.4% of their farm land.
Average total farm value was highest for other immigrant farm operators and lowest for recent Chinese immigrant farm operators
The average farm value of other immigrant farm operators not only was larger than that of non-immigrant farm operators, but also had a greater increase in value over the past 20 years. The average reported total farm capital of other immigrant farm operators rose from $922,319 in 1996 to $2,902,924 in 2016, an increase of 214.7%. Conversely, the average reported total farm capital of non-immigrant farm operators rose from $876,789 in 1996 to $2,698,162 in 2016, an increase of $207.7% (Chart 2).
The average farm value of other immigrant farm operators also dwarfed that of farm operators from the United States and China.
In 2016, farm operators who came from the United States between 2011 and 2016 worked on farms with a reported average total farm capital of $1,444,322. While this figure was lower than that for other immigrants, it was greater than that of their Chinese counterparts. In 2016, farm operators who came from China between 2011 and 2016 worked on farms with a reported average total farm capital of $1,337,167 (Chart 2).

Data table for Chart 2
| Farm operators | Average total farm capital |
|---|---|
| dollars | |
| Non-immigrants | 2,698,162 |
| Other immigrants | 2,902,924 |
| Immigrants from China between 2011 and 2016 | 1,337,167 |
| Immigrants from the United States between 2011 and 2016 | 1,444,322 |
| Source: Statistics Canada, Agriculture–Population Linkage Data, 2016. | |
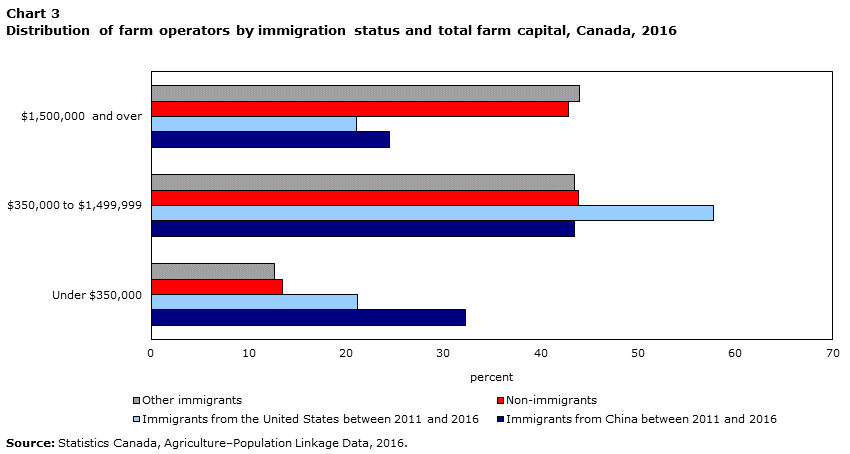
Additionally, Chinese immigrant farm operators were more likely than their American counterparts to work on farms with a reported total farm capital under $350,000. In 2016, 32.3% of farm operators who came from China between 2011 and 2016 worked on farms with a reported total farm capital below $350,000, compared with 21.2% of immigrant farm operators who came from the United States during the same time (Chart 3).
Data table for Chart 3
| Total farm capital classes | |||
|---|---|---|---|
| Under $350,000 | $350,000 to $1,499,999 | $1,500,000 and over | |
| percent | |||
| Farm operators | |||
| Non-immigrants | 13.4 | 43.9 | 42.8 |
| Other immigrants | 12.6 | 43.4 | 44.0 |
| Immigrants from China between 2011 and 2016 | 32.3 | 43.4 | 24.4 |
| Immigrants from the United States between 2011 and 2016 | 21.2 | 57.7 | 21.1 |
| Source: Statistics Canada, Agriculture–Population Linkage Data, 2016. | |||
Conclusion
The top countries of birth of Canadian immigrant farm operators have shifted over time. The Netherlands and the United Kingdom used to be the most prominent countries of birth for immigrant farm operators, but by 2016, the most frequently reported countries of birth were the United States and China.
When immigrant farm operators who came to Canada from the United States and China between 2011 and 2016 are examined more closely, the data indicate that there are many differences between these groups.
For instance, immigrant farm operators from China were mostly involved in farming related to greenhouse, nursery and floriculture production (NAICS), while immigrant farm operators from the United States were heavily involved in either beef cattle farming or farming to support beef cattle (i.e., hay farming).
While immigrant farm operators from the United States were more likely to work on agricultural operations with more farm land, immigrant farm operators from China were more likely to own more of their farm land.
Where the two groups decided to live also varied. The majority of immigrant farm operators from China lived in Ontario, while immigrant farm operators from the United States were more likely to live in British Columbia.
To learn more about the Canadian immigrant farm population, please see the infographic on Canada’s immigrant farm population.
Note to readers
A university-level education includes everything from a university certificate or diploma below bachelor level up to an earned doctorate.
Data for Yukon, Nunavut and the Northwest Territories are not included in national totals because of their differing definition of an agricultural operation.
Collective dwellings are not included.
Farm operators’ technology use refers to Step 23 of the 2016 Census of Agriculture. If the farm operator indicated “None of the above” in this section, they were counted in this article as not using any technology. Conversely, if the farm operator reported meeting any of the criteria for technology use, they were counted as using technology.
Greenhouse, nursery and floriculture production is primarily engaged in growing crops of any kind under cover, growing nursery crops and growing flowers. Under cover includes in greenhouses, cold frames, cloth houses and lath houses.
Other crop farming is primarily engaged in growing crops such as tobacco, peanuts, sugar beets, cotton, sugar cane, hay, agave, herbs and spices, mint, hops, and hay and grass seeds.
Please refer to the Dictionary, Census of Population, 2016, for additional information on census variables.
Price indices were used to obtain constant dollar estimates of capital values to eliminate the impact of price change in year-to-year comparisons.
Total farm capital refers to the combined value of livestock, farm area and machinery.
Urban areas comprise small, medium and large population centres.
Weights were assigned to the records on the Agriculture–Population Linkage Database to represent the entire farming population. For any given geographic area, the weighted population, household, family or farm totals or subtotals may differ from similar estimates presented in previous Census of Agriculture data releases. This is because the Census of Agriculture collected data from all farming operations, whereas the estimates from the Agriculture–Population Linkage Database come from a sample.
Terms
Agricultural operation (farm): Any operation that produces agricultural products intended for sale.
Farm operator: Any person responsible for the management decisions in operating an agricultural operation.
Immigrant farm operator: A farm operator who is or has ever been a landed immigrant and who was operating an agricultural operation at the time of the 2016 Census of Agriculture.
Technology: Computers, laptops or smartphones used for farm management; automated steering; GPS technology; GIS mapping; greenhouse automation; robotic milking; automated environmental controls for animal housing; automated animal feeding; and other technologies.
- Date modified: