
Canadian Agriculture at a Glance
Aboriginal peoples and agriculture in 2016: A portrait

Archived Content
Information identified as archived is provided for reference, research or recordkeeping purposes. It is not subject to the Government of Canada Web Standards and has not been altered or updated since it was archived. Please "contact us" to request a format other than those available.
Skip to text
Text begins
Aboriginal peoples have a history of agriculture that goes back many centuries, long before the arrival of Europeans on the land that today includes Canada. Very little data, or for that matter analysis, on Aboriginal peoples and agriculture has been published. This article represents Statistics Canada’s first attempt at filling this gap.
One of the key products from the 2016 Census of Agriculture is the Agriculture–Population Linkage Database, a rich source of information on the socioeconomic characteristics of the agricultural population, which is defined as all persons who live in agricultural households. By linking farm-level data from the Census of Agriculture to individuals in the Census of Population, a portrait emerges of Aboriginal peoples and agriculture.
It should be noted that Aboriginal history has been marked by government policies that affected Aboriginal access to farmland, tools and markets.Note The recent statistics, then, should be viewed with this history in mind.
Strong growth in the number of Aboriginal people in the agricultural population
In 2016, of the 592,975 people in the agricultural population, 15,765 individuals (2.7%) self-identified as Aboriginal. By comparison, Aboriginal people accounted for 4.9% of Canada’s total population.
Métis (10,960) represented the largest group of Aboriginal people living in agricultural households in 2016, accounting for 69.5% of the total (Table 1). In addition, 4,135 First Nations people and 115 Inuit were part of the agricultural population.
| Aboriginal identity categories | Agricultural population | Total population | Agricultural population | Total population |
|---|---|---|---|---|
| number | percentTable 1 Note 1 | |||
| Total Aboriginal population | 15,765 | 1,673,785 | 100.0 | 100.0 |
| First Nations | 4,135 | 977,230 | 26.2 | 58.4 |
| Métis | 10,960 | 587,545 | 69.5 | 35.1 |
| Inuit | 115 | 65,025 | 0.7 | 3.9 |
| Multiple Aboriginal identities | 300 | 21,310 | 1.9 | 1.3 |
| Aboriginal identities not included elsewhere | 255 | 22,670 | 1.6 | 1.4 |
|
||||
Nationally, the number of Aboriginal people in the agricultural population in 2016 was 21.4% higher than in 1996, the first year in which comparable data were collected. During the same period, the total agricultural population fell 39.3%.
Several factors may have contributed to the increase in the number of Aboriginal people in the agricultural population. One may be that greater numbers of Aboriginal people chose agricultural careers.
Two other factors likely played a role as well. The first is relatively high natural growth in the Aboriginal population, while the second is changes in self-reported identification. More people are newly identifying as Aboriginal on the Census of Population, continuing a trend over time.Note
Aboriginal farm operators increase in number
In 2016, Aboriginal agricultural operators represented 5,160 (1.9%) of the 270,720 agricultural operators in Canada. The number of Aboriginal agricultural operators in 2016 increased 53.7% compared with 1996. In contrast, the total number of agricultural operators declined 30.1% over the same time period.
Of the 3,940 agricultural operators who self-identified as Métis, the largest number (965) farmed in Alberta, followed by those in Saskatchewan (820) and Manitoba (650) (Chart 1 and Map 1). Métis made up more than half of Aboriginal agricultural operators in all regions (Chart 1).
Among all agricultural operators, 1,060 self-identified as First Nations in 2016. British Columbia (285) had the largest number of First Nations agricultural operators, followed by Ontario (215) and Alberta (150) (Chart 1 and Map 1).
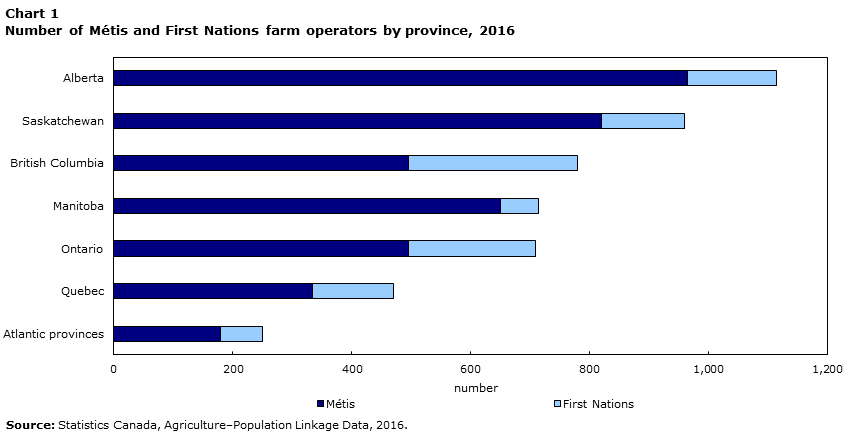
Data table for Chart 1
| Province | Métis | First Nations |
|---|---|---|
| number of farm operators | ||
| Alberta | 965 | 150 |
| Saskatchewan | 820 | 140 |
| British Columbia | 495 | 285 |
| Manitoba | 650 | 65 |
| Ontario | 495 | 215 |
| Quebec | 335 | 135 |
| Atlantic provinces | 180 | 70 |
| Source: Statistics Canada, Agriculture–Population Linkage Data, 2016. | ||
Map 1
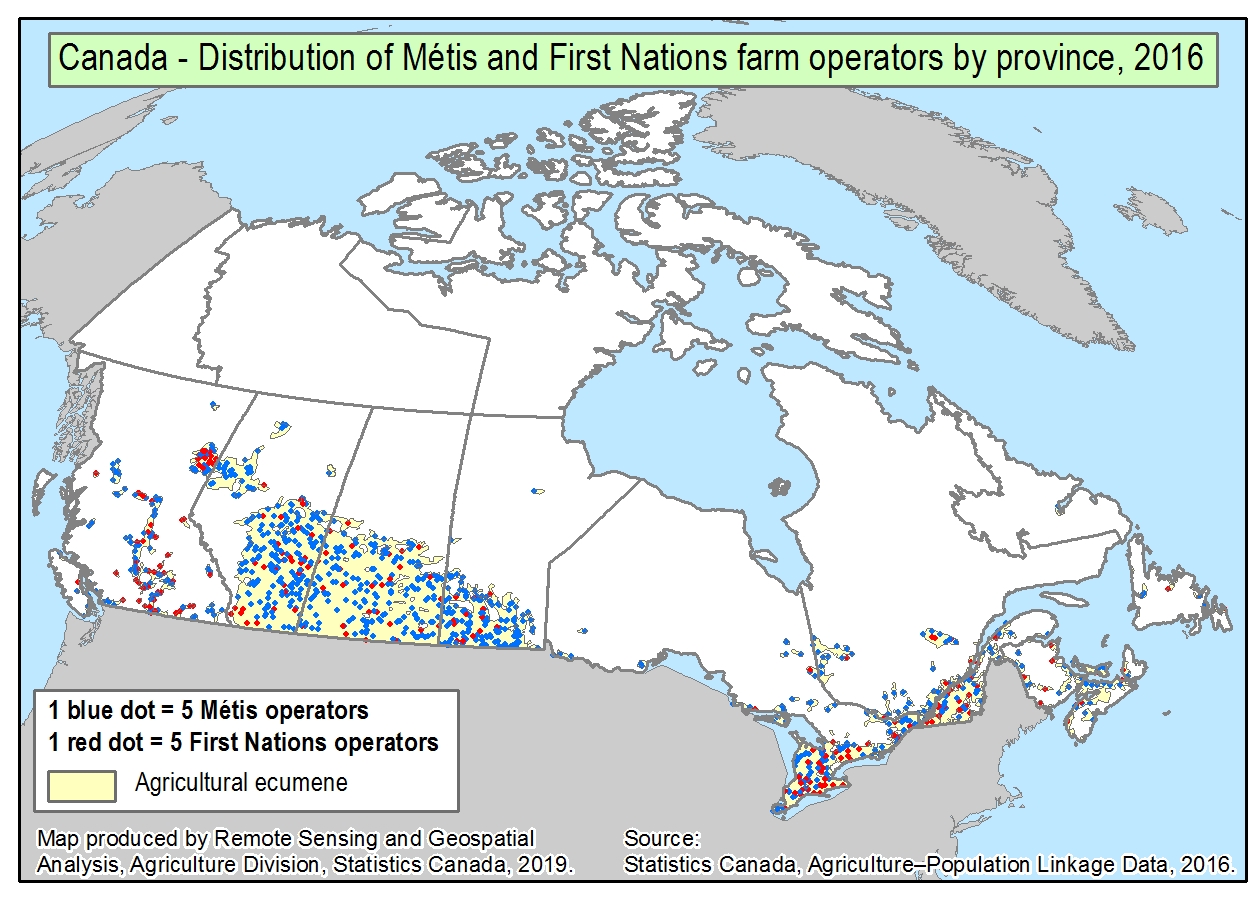
Description for Map 1
This map shows the distribution of Métis and First Nations farm operators by province in Canada for 2016.
Legend
Each blue dot represents 5 Métis operators. Each red dot represents 5 First Nations operators. The dots are placed randomly inside the province's agricultural area. The agricultural ecumene is displayed with a yellow background, while the rest of the area has a white background.
Provinces and territories are outlined in a thin dark gray line.
Countries other than Canada are represented in dark gray. Oceans and the Great Lakes are represented in light blue.
Data table
| Geographic area | Number of blue dots | Number of red dots |
|---|---|---|
| Atlantic provinces | 35 | 14 |
| Québec | 67 | 27 |
| Ontario | 99 | 43 |
| Manitoba | 131 | 13 |
| Saskatchewan | 164 | 28 |
| Alberta | 193 | 30 |
| British Columbia | 100 | 57 |
Source
Statistics Canada, Agriculture–Population Linkage Data, 2016.
Map produced by Remote Sensing and Geospatial Analysis, Agriculture Division, Statistics Canada, 2019.
Métis farm operators focus on beef cattle
On average, Métis agricultural operators were 52.3 years old in 2016, younger than their non-Aboriginal counterparts whose average age was 55.0. Women accounted for 33.3% of Métis farm operators, compared with 28.6% of non-Aboriginal agricultural operators.
At the Canada level, 76.0% of Métis agricultural operators reported English as their first language, while 22.1% reported French. In all regions, Métis agricultural operators were more likely than non-Aboriginal farmers to speak French as a first language.
Start of text box
Key facts
The Métis farm operator in 2016:
- Average age: 52.3
- Average total income: $59,126
- Marital status:
- Married (73.7%)
- Living common law (9.6%)
- Never married (not living common law) (8.2%)
- Average household size: 2.9 persons
- Highest level of education completed:
- High school (28.2%)
- College (23.2%)
- Trades qualification (18.5%)
- No diploma (17.4%)
- University (12.7%)
- Top three major fields of study:
- Business (13.7%)
- Mechanic and repair technologies (12.5%)
- Health professions (11.0%)
- Employed off-farm: 56.1%
- Top three farm types:
- Beef cattle (24.2%)
- Other crop (23.2%)
- Oilseed and grain (18.3%)
- Rural farm: 92.3%
More details on farm operators can be found in the 2016 Agriculture–Population Linkage Data.
End of text box
Across Canada, Métis were involved in managing 3,510 agricultural operations in 2016. Beef cattle farming was the most common farm type, representing 24.2% of Métis-managed operations (Chart 2). Another 23.2% were mainly involved in ‘other crop farming’ (see text box).
Start of text box
Other crop farming: This farm type includes establishments, not classified in any other group, that are primarily engaged in growing crops such as hay, sugar beets, ginseng, tobacco, herbs and spices, hemp, and hops. Combination crop farming and harvesting maple sap are included in this category.
End of text box
Agricultural operations managed by Métis had a median size of 210 acres, compared with 225 acres for agricultural operations managed by non-Aboriginal operators. The median gross farm revenue from Métis agricultural operations was $26,528, or 38.4% of the median gross farm revenue of non-Aboriginal agricultural operations ($69,000).
These discrepancies were partly due to Métis agricultural operators being underrepresented in higher-revenue sectors, such as dairy farming. Another factor is that Métis agricultural operators (56.1%) were more likely to have off-farm employment than non-Aboriginal operators (44.3%). When agricultural operators combine farming with off-farm work, farm revenues tend to be lower.

Data table for Chart 2
| Farm type | Farms managed by Métis operators | Farms managed by First Nations operators | Farms managed by non-Aboriginal operators |
|---|---|---|---|
| percent | |||
| Oilseed and grain | 18.3 | 15.4 | 33.2 |
| Beef cattle | 24.2 | 20.8 | 18.5 |
| Other crop | 23.2 | 22.7 | 16.6 |
| Other animal | 17.8 | 16.4 | 10.0 |
| Dairy cattle and milk | 1.1 | 2.1 | 5.6 |
| Fruit and tree nut | 5.4 | 5.6 | 4.1 |
|
Note: Farm type is based on the major source of farm receipts. Source: Statistics Canada, Agriculture–Population Linkage Data, 2016. |
|||
First Nations farm operators more likely to be women
Women made up 36.8% of First Nations agricultural operators, compared with 28.6% of non-Aboriginal agricultural operators.
English was reported as the first language by 79.4% of First Nations agricultural operators, followed by 14.5% who reported French and 4.2% who reported an Aboriginal first language. Multiple first languages were reported by 2.0% of First Nations operators.
Among the 960 agricultural operations managed by First Nations people, ‘other crop farming’, representing 22.7%, was the most common type of agriculture practised (Chart 2). Beef cattle production was the main activity of another 21.1%.
Agricultural operations managed by First Nations people had a median area of 151 acres, or about two-thirds the size of operations managed by non-Aboriginal persons. The median gross farm revenue of First Nations agricultural operations was $18,000, or about one-quarter of the revenue of farms managed by non-Aboriginal operators.
These differences are partly explained by the concentration of First Nations agricultural operators in British Columbia, where it is more common to find small agricultural operations that focus on specialty crops, such as berries. It is notable, as well, that First Nations operators were more likely to be “part-time” farmers. In 2016, 60.8% of First Nations agricultural operators worked at an off-farm job or business.
Start of text box
Key facts
The First Nations farm operator in 2016:
- Average age: 52.3
- Average total income: $45,111
- Marital status:
- Married (61.7%)
- Common law (17.4%)
- Never married (not living common law) (11.6%)
- Average household size: 2.9 persons
- Highest level of education completed:
- High school (28.7%)
- College (20.8%)
- No diploma (20.1%)
- Trades qualification (14.2%)
- University (16.2%)
- Top three major fields of study:
- Business (14.4%)
- Mechanic and repair technologies (9.8%)
- Health professions (9.6%)
- Employed off-farm: 60.8%
- Registered or Treaty Indian: 50.9 %
- Top two Aboriginal mother tongues:
- Blackfoot (1.2%)
- Ojibway (0.8%)
- Top three farm types:
- Other crop (22.7%)
- Beef cattle (20.8%)
- Oilseed and grain (16.4%)
- Rural farm: 87.3%
More details on farm operators can be found in the 2016 Agriculture–Population Linkage Data.
End of text box
Conclusion
Aboriginal people represented one of the few growing sectors of the agricultural population in 2016, posting large increases even as the total agricultural population declined. Compared with non-Aboriginal farm operators, Aboriginal farm operators were more likely to be female, and were more likely to combine farming with off-farm paid employment. More research on Aboriginal peoples and agriculture remains to be done, particularly on the subject of Aboriginal access to agricultural land.
Note to readers
The Aboriginal population is defined in this article using the concept of Aboriginal identity.
Please refer to the Dictionary, Census of Population, 2016, for additional information on the census variables.
In the 2016 Census, enumeration was not permitted, was interrupted before it could be completed or was considered inadequate for 14 Indian reserves or Indian settlements. These geographic areas are called incompletely enumerated.
Data for census farms located on these incompletely enumerated reserves and settlements are not available. The impact of the missing data is very small for higher-level geographic areas (Canada, provinces, and census agricultural regions). However, the impact is more significant for those smaller areas (census divisions and census consolidated subdivisions) in which the affected reserves and settlements are located.
For a listing of the names and locations of the 14 incompletely enumerated Indian reserves and Indian settlements, please refer to Incompletely enumerated Indian reserves and Indian settlements.
Data for agricultural operations located in Yukon, the Northwest Territories and Nunavut are not included in national totals because of the different definition of an agricultural operation in those regions and because of confidentiality constraints. Collective dwellings are excluded.
Terms
Agricultural household: a household which includes at least one agricultural operator.
Agricultural operation: any operation that produces agricultural products intended for sale.
Agricultural operation managed by First Nations people: agricultural operation of which at least one operator self-identifies as First Nations.
Agricultural operation managed by Métis: agricultural operation of which at least one operator self-identifies as Métis.
Agricultural operation managed by non-Aboriginal people: agricultural operation of which all operators self-identify as non-Aboriginal.
Agricultural operator: an individual responsible for the management decisions of an agricultural operation.
Farm (agricultural) population: Farm population refers to farm operators and the individuals in their households.
Farm type: Farm type is established through a procedure that classifies each agricultural operation according to the predominant type of production. This is done by estimating the potential receipts from the inventories of crops and livestock reported on the Census of Agriculture and determining the product or group of products that makes up the majority of the estimated receipts. For example, an agricultural operation with total potential receipts of 60% from hogs, 20% from beef cattle and 20% from wheat would be classified as a hog and pig farm. The farm types presented in this document are based on the 2012 North American Industry Classification System (NAICS).
Other animal production: This industry group comprises establishments, not classified to any other industry group, primarily engaged in raising animals, such as bees, horses and other equines, rabbits and other fur-bearing animals, llamas or deer. The production of animal products, such as honey and other bee products, are also included. Establishments primarily engaged in raising a combination of animals, with no one predominating, are also included in this industry group.
- Date modified: