
Correction Notice
On February 1, 2024, a correction was made to the text in the section entitled “Quebec sees a reversal in fertility trends in recent decades”. The text passage originally read “Quebec’s TFR in 2022 (1.36) was the lowest recorded in the province since 2002 (1.47) and equalled the previous record low observed in 1987 (1.36) …”. The corrected text reads “Quebec’s TFR in 2022 (1.49) was the lowest recorded in the province since 2002 (1.47). The record low was observed in 1987 (1.36) …”.
Skip to text
Text begins
Acknowledgements
The authors would like to thank a number of Statistics Canada colleagues for their contribution to this study. Early drafts of this document benefited from the input of Laurent Martel, Anne Milan, Patrice Dion, Ana Fostik, Patrick Charbonneau, France-Pascale Ménard, Valérie Gaston, Heather Hobson and Zoë Sayle. We would also like to thank Carol D’Aoust and Stéphane Mongeau for processing and compiling the data that contributed to this study.
Highlights
- In 2022, Canada’s total fertility rate (TFR) reached its lowest level on record, at 1.33 children per woman.
- Most (10 out of 13) provinces and territories saw their TFR reach a record low in 2022.
- The decrease in the TFR from 2021 to 2022 (-7.4%) is the largest decrease since 1971 to 1972 (-7.6%), at the height of the “baby bust” that followed the baby boom (1946 to 1965).
- The drop in the TFR in 2022 was not unique to Canada, although Canada’s decrease was one of the largest among high-income countries. Apart from the United States, all G7 countries experienced a fertility decline between 2021 and 2022.
- Over the period from 1921 to 2022, the lowest TFRs occurred in the last five years: 2022 (1.33), 2020 (1.41), 2021 (1.44), 2019 (1.47) and 2018 (1.51).
- From 2021 to 2022, fertility rates decreased in all age groups of women less than 40.
- Following a period of slow and steady decrease from 2009 to 2019, Canada’s TFR was relatively volatile from 2020 to 2022, with an initial large downward swing, then an increase, followed by another drop. This three-year pattern observed in Canada runs in parallel with the experience of many other countries over the same period, suggesting the COVID-19 pandemic may have temporarily disrupted fertility behaviours.
- Monthly birth patterns suggest many women briefly postponed conceiving a child in the initial weeks of the COVID-19 pandemic but resumed their childbearing plans fairly quickly afterward.
- The average age of mothers at childbirth has been increasing without interruption for nearly five decades, from 26.7 years in 1976 to 31.6 years in 2022.
Introduction
This article provides an in-depth look at trends in fertility in Canada from 1921 to 2022. The evolution of the total fertility rate (TFR) over time is examined, with a special focus on the changes that occurred following the onset of the COVID-19 pandemic. The shifts observed in Canada’s TFR from 2019 to 2022 are situated in an international context, and differences among the provinces and territories are explored.
Given the COVID-19 pandemic initiated a period of public health crisis, as well as economic and societal shocks, it is possible that a segment of the population responded to this period of widespread uncertainty via their childbearing choices. In an effort to identify potential behavioural responses to the COVID-19 pandemic, such as a postponement and subsequent rebound of births, year-over-year changes in the monthly number of births are analyzed and compared with data from other countries.
Lastly, trends in age-specific fertility rates and the average age of childbearing in Canada are described, as well as the cumulative fertility of different cohorts of women to date.
Total fertility rate
The total fertility rate (TFR) refers to the number of children that a woman would be expected to have over the course of her reproductive life if she experienced, at each age, the fertility rates observed over the course of a given calendar year. The TFR controls for the age composition and size of various cohorts of women of childbearing age, facilitating comparisons over time and across geographic regions. However, it is important to note that the TFR is a period-based measure that is strongly affected by changes in the timing of childbearing, and observed changes can be the result of a postponement of births over time. For more information on interpreting different fertility indicators, see the section “Data and methods.”
Canada’s total fertility rate reaches a new low in 2022
After a slight rebound in Canada’s TFR between 2020 (1.41) and 2021 (1.44), the TFR reached a new record low of 1.33 children per woman in 2022 (Chart 1).Note In fact, ranking each annual TFR observed since 1921, the five lowest values were recorded in the last five years: 2022 (1.33), 2020 (1.41), 2021 (1.44), 2019 (1.47) and 2018 (1.51). Canada is now closely approaching the group of “lowest-low” fertility countries, which are categorized as having a fertility rate of 1.3 children per woman or less (Piotrowski et al., 2021).

Data table for Chart 1
| Year | Cohort replacement level | Total fertility rate |
|---|---|---|
| number of children per woman | ||
| 1921 | 2.1 | 3.48 |
| 1922 | 2.1 | 3.40 |
| 1923 | 2.1 | 3.23 |
| 1924 | 2.1 | 3.22 |
| 1925 | 2.1 | 3.13 |
| 1926 | 2.1 | 3.36 |
| 1927 | 2.1 | 3.32 |
| 1928 | 2.1 | 3.30 |
| 1929Data table for Chart 1 Note 1 | 2.1 | 3.22 |
| 1930Data table for Chart 1 Note 1 | 2.1 | 3.28 |
| 1931Data table for Chart 1 Note 1 | 2.1 | 3.20 |
| 1932Data table for Chart 1 Note 1 | 2.1 | 3.09 |
| 1933Data table for Chart 1 Note 1 | 2.1 | 2.87 |
| 1934Data table for Chart 1 Note 1 | 2.1 | 2.80 |
| 1935Data table for Chart 1 Note 1 | 2.1 | 2.75 |
| 1936Data table for Chart 1 Note 1 | 2.1 | 2.70 |
| 1937Data table for Chart 1 Note 1 | 2.1 | 2.64 |
| 1938Data table for Chart 1 Note 1 | 2.1 | 2.70 |
| 1939Data table for Chart 1 Note 1 Data table for Chart 1 Note 2 | 2.1 | 2.65 |
| 1940Data table for Chart 1 Note 2 | 2.1 | 2.76 |
| 1941Data table for Chart 1 Note 2 | 2.1 | 2.83 |
| 1942Data table for Chart 1 Note 2 | 2.1 | 2.96 |
| 1943Data table for Chart 1 Note 2 | 2.1 | 3.03 |
| 1944Data table for Chart 1 Note 2 | 2.1 | 3.00 |
| 1945Data table for Chart 1 Note 2 | 2.1 | 3.01 |
| 1946 | 2.1 | 3.36 |
| 1947 | 2.1 | 3.58 |
| 1948 | 2.1 | 3.43 |
| 1949 | 2.1 | 3.44 |
| 1950 | 2.1 | 3.44 |
| 1951 | 2.1 | 3.49 |
| 1952 | 2.1 | 3.63 |
| 1953 | 2.1 | 3.71 |
| 1954 | 2.1 | 3.82 |
| 1955 | 2.1 | 3.82 |
| 1956 | 2.1 | 3.86 |
| 1957 | 2.1 | 3.92 |
| 1958 | 2.1 | 3.88 |
| 1959 | 2.1 | 3.94 |
| 1960Data table for Chart 1 Note 3 | 2.1 | 3.91 |
| 1961 | 2.1 | 3.86 |
| 1962 | 2.1 | 3.78 |
| 1963 | 2.1 | 3.69 |
| 1964 | 2.1 | 3.52 |
| 1965 | 2.1 | 3.16 |
| 1966 | 2.1 | 2.83 |
| 1967 | 2.1 | 2.60 |
| 1968 | 2.1 | 2.46 |
| 1969Data table for Chart 1 Note 4 | 2.1 | 2.41 |
| 1970 | 2.1 | 2.34 |
| 1971 | 2.1 | 2.13 |
| 1972 | 2.1 | 1.97 |
| 1973 | 2.1 | 1.88 |
| 1974 | 2.1 | 1.83 |
| 1975 | 2.1 | 1.83 |
| 1976 | 2.1 | 1.78 |
| 1977 | 2.1 | 1.75 |
| 1978 | 2.1 | 1.70 |
| 1979 | 2.1 | 1.70 |
| 1980 | 2.1 | 1.68 |
| 1981 | 2.1 | 1.65 |
| 1982 | 2.1 | 1.63 |
| 1983 | 2.1 | 1.62 |
| 1984 | 2.1 | 1.62 |
| 1985 | 2.1 | 1.61 |
| 1986 | 2.1 | 1.59 |
| 1987 | 2.1 | 1.58 |
| 1988 | 2.1 | 1.60 |
| 1989 | 2.1 | 1.66 |
| 1990 | 2.1 | 1.71 |
| 1991 | 2.1 | 1.72 |
| 1992 | 2.1 | 1.71 |
| 1993 | 2.1 | 1.69 |
| 1994 | 2.1 | 1.69 |
| 1995 | 2.1 | 1.67 |
| 1996 | 2.1 | 1.63 |
| 1997 | 2.1 | 1.57 |
| 1998 | 2.1 | 1.56 |
| 1999 | 2.1 | 1.55 |
| 2000 | 2.1 | 1.51 |
| 2001 | 2.1 | 1.54 |
| 2002 | 2.1 | 1.52 |
| 2003 | 2.1 | 1.55 |
| 2004 | 2.1 | 1.56 |
| 2005 | 2.1 | 1.58 |
| 2006 | 2.1 | 1.63 |
| 2007 | 2.1 | 1.67 |
| 2008 | 2.1 | 1.70 |
| 2009 | 2.1 | 1.69 |
| 2010 | 2.1 | 1.65 |
| 2011 | 2.1 | 1.63 |
| 2012 | 2.1 | 1.63 |
| 2013 | 2.1 | 1.61 |
| 2014 | 2.1 | 1.61 |
| 2015 | 2.1 | 1.60 |
| 2016 | 2.1 | 1.59 |
| 2017 | 2.1 | 1.55 |
| 2018 | 2.1 | 1.51 |
| 2019 | 2.1 | 1.47 |
| 2020Data table for Chart 1 Note 5 | 2.1 | 1.41 |
| 2021 | 2.1 | 1.44 |
| 2022 | 2.1 | 1.33 |
Sources: Statistics Canada, Canadian Vital Statistics - Birth database (CVSB), Annual Demographic Estimates: Canada, Provinces and Territories; C.D. Howe Institute, Business Cycle Council, 2021, Recession chronology; C.D. Howe Institute, Council Reports. |
||
The decrease in the TFR from 2021 to 2022 (-0.11, or -7.4%) is the largest absolute and relative year-over-year decrease observed since 1971 to 1972 (-0.16, or -7.6%). In the late 1960s and the early 1970s, the TFR declined rapidly from one year to another, leading to the “baby bust” that followed the baby-boom years (1946 to 1965). In fact, Canada’s TFR fell below the cohort replacement level of 2.1 children per woman for the first time in 1972 (1.97).
After a period of slow, steady decreases or stagnation in the TFR from 2009 to 2019 (averaging -0.02, or -1.3%, per year), the years 2020 to 2022 showed greater annual volatility, with two large year-over-year decreases (-0.07, or -4.5%, from 2019 to 2020; -0.11, or -7.4%, from 2021 to 2022) surrounding a moderate rebound in the intermediary year (+0.03, or +2.1%, from 2020 to 2021).
Variation in the total fertility rate by province and territory
Except for 2021, the TFR has shown a general decreasing trend in all provincesNote since 2017. Not only is it unusual to observe an annual decline in all provinces, but this has not occurred for four years in a row—as it did from 2017 to 2020—since the 1960s. Moreover, this decline accelerated in 2020 and 2022, with a partial catch-up in almost all provinces in 2021.
In contrast to the provinces, Nunavut and the Northwest TerritoriesNote saw variable annual patterns, reflecting in part their smaller population sizes. That said, these two territories joined 8 out of 10 provinces (except Quebec and Nova ScotiaNote ) in showing record low fertility rates in 2022.
Despite the widespread pattern of fertility decreases, there remains considerable variability in the TFR among the provinces and territories (Chart 2). The Prairie provinces and Quebec registered TFRs above the national average in 2022. Manitoba and Saskatchewan have the highest proportions of persons with Indigenous identity among the provinces, with 18.1% and 17.0% in 2021, respectively—of which over half had Registered or Treaty Indian statusNote —compared with 5.0% for Canada as a whole (Statistics Canada, Table 98-10-0264-01). The population with Registered or Treaty Indian status has one of the highest fertility rates among the population with Indigenous identity, estimated at 2.20 children per woman in 2016 (Statistics Canada, 2021) compared with 1.59 for the total Canadian population in the same year. In the case of Alberta, the barriers to childbearing could be lower in the province as a result of the absence of a provincial sales tax, low provincial income tax, and on average, higher salaries and lower unemployment than in the other provinces and territoriesNote (Beaujot and Wang, 2010; Brauner-Otto, 2016).

Data table for Chart 2
| Year | Canada | Newfoundland and Labrador | Prince Edward Island | Nova Scotia | New Brunswick | Quebec | Ontario | Manitoba | Saskatchewan | Alberta | British Columbia | Yukon | Northwest Territories | Nunavut |
|---|---|---|---|---|---|---|---|---|---|---|---|---|---|---|
| number of children per woman | ||||||||||||||
| 2002 | 1.52 | 1.32 | 1.49 | 1.39 | 1.40 | 1.47 | 1.50 | 1.81 | 1.84 | 1.69 | 1.39 | 1.56 | 1.93 | 3.01 |
| 2003 | 1.55 | 1.33 | 1.60 | 1.39 | 1.43 | 1.50 | 1.52 | 1.82 | 1.88 | 1.74 | 1.42 | 1.50 | 2.08 | 3.06 |
| 2004 | 1.56 | 1.32 | 1.58 | 1.43 | 1.42 | 1.50 | 1.55 | 1.80 | 1.86 | 1.74 | 1.43 | 1.63 | 2.10 | 3.05 |
| 2005 | 1.58 | 1.36 | 1.54 | 1.42 | 1.43 | 1.54 | 1.57 | 1.84 | 1.87 | 1.75 | 1.44 | 1.42 | 2.12 | 2.81 |
| 2006 | 1.63 | 1.41 | 1.65 | 1.42 | 1.48 | 1.65 | 1.59 | 1.89 | 1.91 | 1.81 | 1.47 | 1.61 | 2.12 | 2.92 |
| 2007 | 1.67 | 1.44 | 1.64 | 1.50 | 1.53 | 1.68 | 1.61 | 1.96 | 2.03 | 1.89 | 1.52 | 1.57 | 2.19 | 3.02 |
| 2008 | 1.70 | 1.55 | 1.74 | 1.56 | 1.60 | 1.76 | 1.63 | 1.97 | 2.06 | 1.90 | 1.52 | 1.62 | 2.09 | 2.98 |
| 2009 | 1.69 | 1.55 | 1.71 | 1.53 | 1.61 | 1.74 | 1.62 | 1.99 | 2.08 | 1.87 | 1.51 | 1.62 | 2.07 | 3.18 |
| 2010 | 1.65 | 1.53 | 1.65 | 1.51 | 1.61 | 1.70 | 1.58 | 1.93 | 2.03 | 1.80 | 1.45 | 1.56 | 1.99 | 2.96 |
| 2011 | 1.63 | 1.40 | 1.67 | 1.52 | 1.57 | 1.68 | 1.57 | 1.88 | 1.99 | 1.77 | 1.45 | 1.67 | 1.96 | 2.85 |
| 2012 | 1.63 | 1.38 | 1.53 | 1.51 | 1.57 | 1.68 | 1.57 | 1.94 | 2.01 | 1.77 | 1.43 | 1.66 | 1.92 | 2.90 |
| 2013 | 1.61 | 1.44 | 1.66 | 1.47 | 1.57 | 1.68 | 1.54 | 1.93 | 1.97 | 1.74 | 1.40 | 1.50 | 1.88 | 3.09 |
| 2014 | 1.61 | 1.47 | 1.68 | 1.52 | 1.60 | 1.67 | 1.53 | 1.92 | 2.04 | 1.77 | 1.39 | 1.49 | 1.90 | 3.01 |
| 2015 | 1.60 | 1.46 | 1.61 | 1.46 | 1.54 | 1.67 | 1.53 | 1.92 | 2.00 | 1.78 | 1.37 | 1.59 | 1.96 | 2.88 |
| 2016 | 1.59 | 1.47 | 1.64 | 1.46 | 1.56 | 1.66 | 1.52 | 1.90 | 2.01 | 1.74 | 1.38 | 1.55 | 1.87 | 3.04 |
| 2017 | 1.55 | 1.37 | 1.53 | 1.43 | 1.54 | 1.60 | 1.50 | 1.87 | 1.96 | 1.67 | 1.33 | Note ...: not applicable | 1.79 | 2.99 |
| 2018 | 1.51 | 1.37 | 1.45 | 1.36 | 1.49 | 1.58 | 1.46 | 1.85 | 1.93 | 1.62 | 1.27 | Note ...: not applicable | 1.84 | 2.96 |
| 2019 | 1.47 | 1.30 | 1.41 | 1.35 | 1.45 | 1.57 | 1.42 | 1.78 | 1.83 | 1.59 | 1.23 | Note ...: not applicable | 1.73 | 2.80 |
| 2020 | 1.41 | 1.27 | 1.33 | 1.24 | 1.42 | 1.52 | 1.35 | 1.75 | 1.79 | 1.51 | 1.18 | Note ...: not applicable | 1.69 | 3.12 |
| 2021 | 1.44 | 1.37 | 1.43 | 1.11 | 1.46 | 1.59 | 1.37 | 1.64 | 1.85 | 1.55 | 1.21 | Note ...: not applicable | 1.62 | 2.70 |
| 2022 | 1.33 | 1.22 | 1.22 | 1.18 | 1.33 | 1.49 | 1.27 | 1.43 | 1.69 | 1.45 | 1.11 | Note ...: not applicable | 1.49 | 2.23 |
|
... not applicable Notes: Births for which the age of the mother is unknown were prorated using the observed distribution. The 2022 data are considered preliminary. Starting in 2017, the calculation for Canada excludes Yukon. Sources: Statistics Canada, Canadian Vital Statistics - Birth database (CVSB), Annual Demographic Estimates: Canada, Provinces and Territories. |
||||||||||||||
Quebec sees a reversal in fertility trends in recent decades
In 2006, Quebec joined the ranks of the provinces with the highest fertility rates, following the expansion of family-related policies in the province. Canada substantially increased parental leave benefits on December 31, 2000, adding 25 weeks of parental leave to the existing 10 weeks, for a total of 50 weeks including maternity leave (Human Resources and Skills Development Canada, 2005). Quebec then expanded its own program in 2006, making it more generous and flexible (Rose, 2010). The province also introduced reduced-rate daycare in 1997, which was progressively implemented with a gradual increase in the number of daycare spaces available in the years that followed (Lapierre-Adamcyk, 2010). These changes may have contributed to the rise in the TFR over the period from 2003 to 2008 (Croisetière, 2012; Beaujot and Ravanera, 2013; Brauner-Otto, 2016), mainly through an impact on the timing of births (Moyser and Milan, 2018) but also possibly through an increase in completed or nearly completed fertility among the 1972 to 1983 cohorts of womenNote (see Appendix, Chart 8). Quebec’s TFR in 2022 (1.49) was the lowest recorded in the province since 2002 (1.47). The record low was observed in 1987 (1.36), just before the substantial increase and universal implementation of family allowances in the 1988/1989 provincial budget (Lapierre-Adamcyk, 2010).
The TFR has been below the national average since the middle of the 1980s in Nova Scotia and New Brunswick, although the latter slightly surpassed the national level in 2020 and 2021. Prince Edward Island has also posted a TFR below the national average since 2017.
Nunavut continues to post an exceptionally high fertility rate
Since its creation in 1999, Nunavut has registered the highest TFR in Canada by a large margin, ranging from a low of 2.23 (2022Note ) to a high of 3.18 (2009) and averaging 2.91 children per woman over the period from 1999 to 2022. In every year since its foundation, Nunavut is the only province or territory to post a TFR above the cohort replacement level of 2.1 children per woman. In 2021, the majority (84.3%) of Nunavut’s population was composed of persons who identify as Inuit (Statistics Canada, Table 98-10-0264-01). Fertility has been found to be particularly high among Inuit, even within the subpopulation of persons having Indigenous identity (Statistics Canada, 2021).
The Northwest Territories has also consistently recorded a higher-than-average TFR. As in Nunavut, this elevated fertility is likely owing in part to the fact that a significant part of the territory’s population has Indigenous identity—49.6% in 2021, among which 63% had Registered or Treaty Indian status and 20% identified as Inuit (Statistics Canada, Table 98-10-0264-01).
International trends in the total fertility rate
Many countries saw a substantial decrease in fertility from 2021 to 2022, but Canada’s was among the largest
Among G7 members and other selected high-income countries with comparable data, Canada and South Korea tied for the largest absolute decrease in TFR from 2019 to 2022 (-0.14 for each). Canada also saw the second-largest percentage decrease in TFR over the same period (-9.7%), after South Korea (-15.3%).
However, the majority of this decrease occurred from 2021 to 2022 (-0.11), as opposed to the previous post-pandemic years (-0.04 from 2019 to 2021). From 2021 to 2022, Canada recorded a decrease of 7.4% in its TFR, one of the largest decreases among comparable countries; only Germany (-7.7%) and the Netherlands (-8.4%) saw a larger decline over the same period.
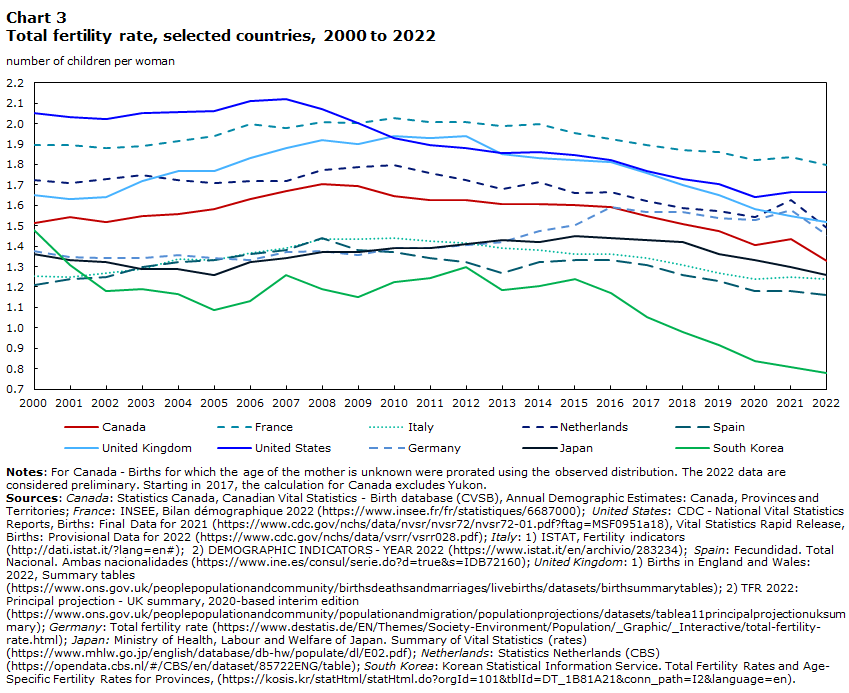
Among comparable countries, Canada’s TFR was situated in the middle of the range in 2022, as has been the case for many years (Chart 3). France recorded the highest TFR, at 1.80 children per woman, while South Korea had the lowest (0.78 children per woman). South Korea is the only country among 39 with comparable data that has seen its TFR dip below 1 child per woman in the 2000s (Human Fertility Database, 2023).
Over the course of the two decades before 2020, Canada experienced relatively minor overall decreases in its TFR (-2.7% from 2000 to 2019), a result of a mix of increasing trends from 2002 to 2007, then decreasing trends from 2009 to 2019. By comparison, other countries such as South Korea (-38.0%), the United States (-16.9%) and the Netherlands (-8.6%) saw much larger declines over the same period.
Data table for Chart 3
| Year | Canada | France | Germany | Italy | Japan | Netherlands | South Korea | Spain | United Kingdom | United States |
|---|---|---|---|---|---|---|---|---|---|---|
| number of children per woman | ||||||||||
| 2000 | 1.51 | 1.89 | 1.38 | 1.26 | 1.36 | 1.72 | 1.48 | 1.21 | 1.65 | 2.05 |
| 2001 | 1.54 | 1.90 | 1.35 | 1.25 | 1.33 | 1.71 | 1.31 | 1.24 | 1.63 | 2.03 |
| 2002 | 1.52 | 1.88 | 1.34 | 1.27 | 1.32 | 1.73 | 1.18 | 1.25 | 1.64 | 2.02 |
| 2003 | 1.55 | 1.89 | 1.34 | 1.29 | 1.29 | 1.75 | 1.19 | 1.30 | 1.72 | 2.05 |
| 2004 | 1.56 | 1.92 | 1.36 | 1.34 | 1.29 | 1.73 | 1.16 | 1.32 | 1.77 | 2.06 |
| 2005 | 1.58 | 1.94 | 1.34 | 1.33 | 1.26 | 1.71 | 1.09 | 1.33 | 1.77 | 2.06 |
| 2006 | 1.63 | 2.00 | 1.33 | 1.37 | 1.32 | 1.72 | 1.13 | 1.36 | 1.83 | 2.11 |
| 2007 | 1.67 | 1.98 | 1.37 | 1.39 | 1.34 | 1.72 | 1.26 | 1.38 | 1.88 | 2.12 |
| 2008 | 1.70 | 2.01 | 1.38 | 1.44 | 1.37 | 1.77 | 1.19 | 1.44 | 1.92 | 2.07 |
| 2009 | 1.69 | 2.00 | 1.36 | 1.44 | 1.37 | 1.79 | 1.15 | 1.38 | 1.90 | 2.00 |
| 2010 | 1.65 | 2.03 | 1.39 | 1.44 | 1.39 | 1.80 | 1.23 | 1.37 | 1.94 | 1.93 |
| 2011 | 1.63 | 2.01 | 1.39 | 1.42 | 1.39 | 1.76 | 1.24 | 1.34 | 1.93 | 1.90 |
| 2012 | 1.63 | 2.01 | 1.41 | 1.41 | 1.41 | 1.72 | 1.30 | 1.32 | 1.94 | 1.88 |
| 2013 | 1.61 | 1.99 | 1.42 | 1.39 | 1.43 | 1.68 | 1.19 | 1.27 | 1.85 | 1.86 |
| 2014 | 1.61 | 2.00 | 1.48 | 1.38 | 1.42 | 1.71 | 1.21 | 1.32 | 1.83 | 1.86 |
| 2015 | 1.60 | 1.96 | 1.50 | 1.36 | 1.45 | 1.66 | 1.24 | 1.33 | 1.82 | 1.84 |
| 2016 | 1.59 | 1.92 | 1.59 | 1.36 | 1.44 | 1.66 | 1.17 | 1.33 | 1.81 | 1.82 |
| 2017 | 1.55 | 1.89 | 1.57 | 1.34 | 1.43 | 1.62 | 1.05 | 1.31 | 1.76 | 1.77 |
| 2018 | 1.51 | 1.87 | 1.57 | 1.31 | 1.42 | 1.59 | 0.98 | 1.26 | 1.70 | 1.73 |
| 2019 | 1.47 | 1.86 | 1.54 | 1.27 | 1.36 | 1.57 | 0.92 | 1.23 | 1.65 | 1.71 |
| 2020 | 1.41 | 1.82 | 1.53 | 1.24 | 1.33 | 1.55 | 0.84 | 1.18 | 1.58 | 1.64 |
| 2021 | 1.44 | 1.84 | 1.58 | 1.25 | 1.30 | 1.62 | 0.81 | 1.18 | 1.55 | 1.66 |
| 2022 | 1.33 | 1.80 | 1.46 | 1.24 | 1.26 | 1.49 | 0.78 | 1.16 | 1.52 | 1.67 |
|
Notes: For Canada - Births for which the age of the mother is unknown were prorated using the observed distribution. The 2022 data are considered preliminary. Starting in 2017, the calculation for Canada excludes Yukon. Sources: Canada: Statistics Canada, Canadian Vital Statistics - Birth database (CVSB), Annual Demographic Estimates: Canada, Provinces and Territories; France: INSEE, Bilan démographique 2022 (https://www.insee.fr/fr/statistiques/6687000); United States: CDC - National Vital Statistics Reports, Births: Final Data for 2021 (https://www.cdc.gov/nchs/data/nvsr/nvsr72/nvsr72-01.pdf?ftag=MSF0951a18), Vital Statistics Rapid Release, Births: Provisional Data for 2022 (https://www.cdc.gov/nchs/data/vsrr/vsrr028.pdf); Italy: 1) ISTAT, Fertility indicators (http://dati.istat.it/?lang=en#); 2) DEMOGRAPHIC INDICATORS - YEAR 2022 (https://www.istat.it/en/archivio/283234); Spain: Fecundidad. Total Nacional. Ambas nacionalidades (https://www.ine.es/consul/serie.do?d=true&s=IDB72160); United Kingdom: 1) Births in England and Wales: 2022, Summary tables (https://www.ons.gov.uk/peoplepopulationandcommunity/birthsdeathsandmarriages/livebirths/datasets/birthsummarytables); 2) TFR 2022: Principal projection - UK summary, 2020-based interim edition (https://www.ons.gov.uk/peoplepopulationandcommunity/populationandmigration/populationprojections/datasets/tablea11principalprojectionuksummary); Germany: Total fertility rate (https://www.destatis.de/EN/Themes/Society-Environment/Population/_Graphic/_Interactive/total-fertility-rate.html); Japan: Ministry of Health, Labour and Welfare of Japan. Summary of Vital Statistics (rates) (https://www.mhlw.go.jp/english/database/db-hw/populate/dl/E02.pdf); Netherlands: Statistics Netherlands (CBS) (https://opendata.cbs.nl/#/CBS/en/dataset/85722ENG/table); South Korea: Korean Statistical Information Service. Total Fertility Rates and Age-Specific Fertility Rates for Provinces, (https://kosis.kr/statHtml/statHtml.do?orgId=101&tblId=DT_1B81A21&conn_path=I2&language=en). |
||||||||||
How could the COVID-19 pandemic impact fertility?
Historically, fertility rates have responded to major societal disruptions affecting public health (pandemics or natural or man-made disasters) or the economy (recession or downturn), and during times of heightened general uncertainty (Alderotti et al., 2021; Matysiak et al., 2020; Boberg-Fazlic et al., 2021; Comolli and Vignoli, 2021; Fostik, 2021; Comolli, 2023). Sometimes, these shocks may prompt a very short-term fertility response that is quickly reversed, while other times, the impact can be longer-lasting. Typically, the fertility response to a negative societal disruption is to temporarily delay childbearing and make up births later. However, overall reductions can also occur (Sobotka et al., 2011)—a recent example being the sustained trend of fertility decrease that occurred after the 2008 global financial crisis (Comolli, 2017). Among persons of childbearing age surveyed in Europe and the United States in the first months of the COVID-19 pandemic, a sizable proportion had decided to delay or stop their childbearing plans in response to the pandemic situation (Lindberg et al., 2020; Luppi et al., 2020). This finding was repeated in Canada much later among persons surveyed in spring 2021 (Fostik and Galbraith, 2021).
There are many ways in which the COVID-19 pandemic may have negatively impacted fertility. Direct impacts of COVID-19 on fertility behaviour are likely negligible overall. For instance, during periods of intense illness during COVID-19 infection, a small number of individuals may have avoided conceiving a child. Additionally, among couples who live apart and who were planning to conceive, the initial strict lockdowns and travel restrictions may have created a physical barrier to conception. Indirect or secondary effects of the pandemic are more numerous and, when considered jointly, are more likely to have had a macro-level impact on fertility behaviour: marriages were postponed (Statistics Canada, 2022), and reduced social contact among young adults may have led to fewer opportunities to form unions. Some individuals reported greater frequency of disagreements with their spouse or partner during the pandemic, as well as new sources of disagreement on specific pandemic-related issues (Statistics Canada, 2023a). Health concerns, job loss, reductions in income, financial uncertainty, lower consumer confidence, increases in the cost of living, media narratives, and heightened feelings of stress and mental illness are various factors—some objective in nature and others subjectively perceived (Sobotka et al., 2023)—that could overall contribute to greater “social uncertainty,” leading some individuals to delay or abandon their plans to have a child at some point during the pandemic (Comolli, 2023).
On the other hand, disruptions in access to contraception and abortion in the initial weeks of the pandemic could have resulted in a temporary rise in unplanned or undesired births. While this possibility has not been analyzed in the Canadian context, studies in other countries suggest that the pandemic’s impact on unplanned births varied by socioeconomic status (Bailey et al., 2022), and there may have been overall lower demand for abortions in the early weeks of the pandemic as a result of fewer conceptions and pregnancies (Vilain et al., 2022). While it is also possible that for some individuals, having more time at home may have led to a newfound interest in conceiving a child or having a child earlier than previously planned, studies of changes in fertility intentions in response to the pandemic indicate this sentiment was fairly rare (Lindberg et al., 2020; Luppi et al., 2020; Fostik and Galbraith, 2021; Mooi-Reci et al., 2023).
The COVID-19 pandemic situation progressed in an unpredictable manner, with multiple waves of outbreaks and the reinstatement and lifting of public health measures; in turn, any discernible shifts in fertility behaviour in response to the COVID-19 pandemic may also have been numerous and varied in nature. At the individual level, this response likely varied depending on the socioeconomic, health and demographic characteristics of an individual, including their place of residence: as noted by Bignami (2021), public health measures, COVID-19 mortality rates, and the timing and severity of pandemic waves varied substantially across Canada’s provinces and territories.
The monthly evolution of births following the onset of the COVID-19 pandemic
As described in the box “How could the COVID-19 pandemic impact fertility?”, the numerous secondary and indirect impacts of the pandemic may have led a segment of the population to respond to this period of widespread uncertainty via their childbearing choices. In Canada, among persons of childbearing age surveyed in spring 2021, 19% reported that because of the pandemic, they now wanted to have fewer children than previously planned or to have a child later than previously planned (Fostik and Galbraith, 2021).
A month-by-month analysis of the number of births can potentially help to discern signs of a behavioural response to the onset of the pandemic. Births have a well-established seasonal pattern, peaking from July to September, with the lowest levels typically being observed in the first months of the year (January through March). By analyzing year-over-year differences in the number of births occurring in each month, it is possible to identify any unusual shifts that may align temporally with key points in the evolution of the pandemic.
The impacts of a societal disruption in births and fertility are generally evident approximately nine months after the event in question—the average duration from conception to a full-term birth. As a result, a widespread fertility behavioural response to the pandemic could only be detected from January 2021 onwards (approximately nine months after the onset of the pandemic public health crisis in mid-March 2020Note ).
Decrease in conceptions in the first stage of the pandemic
Canada saw a large decrease in the number of births in January 2021, compared with the volume of births observed in the same month in the preceding years (Table 1). The number of births in January 2021 was 8.3% lower than in January 2020; in contrast, the average year-over-year decrease in the number of January births for the period from 2009 to 2019 was 0.1%. Births in January 2021 coincide with estimated conceptions in the first weeks of the pandemic, a period of widespread lockdowns, travel restrictions and general uncertainty.
| Estimated month of conception | Month of birth | Average 2008/2009 to 2018/2019 | 2019 to 2020 | 2020 to 2021 | 2021 to 2022 |
|---|---|---|---|---|---|
| Year-over-year change (%) | |||||
| April | January | -0.1 | 0.1 | -8.3 | 3.1 |
| May | February | -0.6 | 1.6 | -1.9 | -4.1 |
| June | March | -0.1 | -0.3 | 3.4 | -9.0 |
| July | April | -0.3 | -1.1 | 0.6 | -6.1 |
| August | May | -0.2 | -2.8 | 2.7 | -5.6 |
| September | June | -0.1 | -3.8 | 6.6 | -7.1 |
| October | July | 0.0 | -4.5 | 3.6 | -6.8 |
| November | August | 0.1 | -6.0 | 4.7 | -3.7 |
| December | September | -0.4 | -4.3 | 5.4 | -7.0 |
| January | October | -0.3 | -5.0 | 3.8 | -5.0 |
| February | November | 0.0 | -6.0 | 6.0 | -3.4 |
| March | December | -0.3 | -6.3 | 4.2 | -3.8 |
|
Notes: Births for which the age of the mother is unknown were prorated using the observed distribution. The 2022 data are considered preliminary. Starting in 2017, the calculation for Canada excludes Yukon. Source: Statistics Canada, Canadian Vital Statistics - Birth database (CVSB). |
|||||
A short-term decrease in births in January 2021, coinciding with the first wave of the pandemic, was largely expected given historical responses to pandemics. However, in Canada, births were already experiencing unusually large decreases in the preceding months of 2020, corresponding to conception periods well in advance of the pandemic’s onset. The relatively large year-over-year decrease in births occurring from April to December 2020 could reflect to some extent a sudden drop in births to newcomers to the country in 2020 as a result of travel restrictions in the first months of the pandemic. Preliminary analyses find that the proportion of births to foreign-born mothers increased slightly between 2019 (33.5%) and 2020 (33.9%), continuing a long-term trend, although at a slower rate of increase than the immediately preceding years. In the future, more in-depth analysis of the contribution of foreign-born women to fertility in Canada may reveal additional insights.
The large decrease in births in January 2021 also occurred in various European countries (Pomar et al., 2022), the United States (Du and Chan, 2023; Kearney and Levine, 2023) and other high-income countries (Sobotka et al., 2023). In their analysis of 24 European countries, Pomar et al. (2022) found a correlation between birth declines in January 2021 and the stringency of public health measures in the month of conception. For instance, while Sweden had a higher number of COVID-19 deaths than many other countries at the beginning of the pandemic, it did not have a lockdown and subsequently did not show a drop in live births in January 2021. The stringency of Canada’s public health measures in April 2020 was on par with that of other G7 countries.Note
Canada and other countries ride the fertility “pandemic rollercoaster”
Following January 2021’s large decrease, the number of births quickly rebounded throughout the remaining months of that year. This recovery in the monthly number of births was strong and sustained until February 2022, when births once again experienced large year-over-year decreases throughout the rest of 2022.
This three-year pattern of a large decrease in births, then strong rebound, followed by even stronger decreases, is not unique to Canada. Deemed the “pandemic rollercoaster” by Sobotka et al. (2023), this recent volatility in fertility has been observed in many high-income countries (Ibid; Kearney and Levine, 2023). This pattern suggests many women briefly postponed conceiving a child in the initial weeks of the COVID-19 pandemic, but quickly resumed their childbearing plans over the course of the following year. Situated in a longer-term perspective, Canada’s record low TFR in 2022 appears to be a resumption of the pre-pandemic decreasing trend observed from 2009 to 2019, but at a quicker pace that may reflect various secondary effects of the pandemic or, more generally, increasing uncertainty (see the “How could the COVID-19 pandemic impact fertility?” box for more details).
Average age of childbearing and age-specific fertility rates
The average age at childbirth continues to rise for both mothers and fathers
In Canada, the age at which women give birth has been rising steadily since 1977 (Chart 4). In fact, the average age of mothers at childbirth was 31.6 years in 2022, which is 4.8 years higher than in 1977 (26.8 years). Similarly, the average age at fatherhood was 34.4 years in 2022, up from 30.1 years in 1974. New fathers were 2.8 years older than new mothers in 2022, on average; this gap has narrowed over time, particularly between 1987 (3.6 years) and 2003 (2.9 years). From 1977 to 2022, the average annual increase in the mean age at childbirth was 0.1 years for mothers and 0.09 years for fathers.

Data table for Chart 4
| Year | Mothers | Fathers |
|---|---|---|
| average age in years | ||
| 1974 | 26.8 | 30.1 |
| 1975 | 26.7 | 30.1 |
| 1976 | 26.7 | 30.1 |
| 1977 | 26.8 | 30.2 |
| 1978 | 26.8 | 30.3 |
| 1979 | 26.9 | 30.3 |
| 1980 | 27.0 | 30.3 |
| 1981 | 27.1 | 30.5 |
| 1982 | 27.1 | 30.5 |
| 1983 | 27.2 | 30.7 |
| 1984 | 27.3 | 30.9 |
| 1985 | 27.4 | 30.9 |
| 1986 | 27.5 | 31.1 |
| 1987 | 27.6 | 31.2 |
| 1988 | 27.7 | 31.2 |
| 1989 | 27.7 | 31.2 |
| 1990 | 27.8 | 31.3 |
| 1991 | 27.8 | 31.3 |
| 1992 | 27.9 | 31.3 |
| 1993 | 28.0 | 31.4 |
| 1994 | 28.1 | 31.4 |
| 1995 | 28.2 | 31.4 |
| 1996 | 28.3 | 31.5 |
| 1997 | 28.5 | 31.6 |
| 1998 | 28.5 | 31.6 |
| 1999 | 28.7 | 31.7 |
| 2000 | 28.8 | 31.9 |
| 2001 | 29.0 | 32.0 |
| 2002 | 29.1 | 32.1 |
| 2003 | 29.3 | 32.2 |
| 2004 | 29.5 | 32.4 |
| 2005 | 29.6 | 32.5 |
| 2006 | 29.7 | 32.6 |
| 2007 | 29.7 | 32.6 |
| 2008 | 29.8 | 32.7 |
| 2009 | 29.9 | 32.8 |
| 2010 | 30.1 | 33.0 |
| 2011 | 30.2 | 33.1 |
| 2012 | 30.3 | 33.2 |
| 2013 | 30.4 | 33.3 |
| 2014 | 30.5 | 33.5 |
| 2015 | 30.6 | 33.6 |
| 2016 | 30.7 | 33.7 |
| 2017 | 30.9 | 33.9 |
| 2018 | 31.0 | 34.0 |
| 2019 | 31.2 | 34.2 |
| 2020 | 31.3 | 34.2 |
| 2021 | 31.4 | 34.2 |
| 2022 | 31.6 | 34.4 |
|
Notes: Births for which the age of the mother or father is unknown were prorated using the observed distribution. The 2022 data are considered preliminary. Mid-year age is used. Starting in 2017, the calculation for Canada excludes Yukon. Sources: Statistics Canada, Canadian Vital Statistics - Birth database (CVSB), Annual Demographic Estimates: Canada, Provinces and Territories. |
||
Multiple births
The proportion of multiple births (twins, triplets or more) among all births in Canada increased gradually from 1991 to 2009, going from 2.0% to 3.3%, before declining to 3.1% by 2022 (Chart 5). This trend may be linked to the increase in mothers’ average age at childbirth. The likelihood of having a multiple pregnancy rises after age 30—and even more so after age 35—owing to a greater likelihood of releasing multiple eggs at once, receiving fertility treatments and having had previous pregnancies (Lazarov et al., 2016).
Since the 1970s, twin pregnancies have increased sharply in most developed countries (Torres et al., 2023). With the exception of Japan (2.1%), the prevalence of multiple births in Canada was similar to that registered in recent years in other G7 countries—the United States (3.2% in 2021), the United Kingdom (2.9% in 2020), Italy (3.2% in 2019), Germany (3.6% in 2020) and France (3.1% in 2021)—along with Australia (2.9% in 2020) (Human Multiple Births Database, 2023).
Like Canada, numerous other countries have observed a pattern of decrease in the prevalence of multiple births following a peak in the early 2000s (Pison et al., 2022). Following concerns about the health risks associated with multiple births, a concerted effort was made by medical providers towards the beginning of the 21st century to change practices—specifically, reducing the number of embryos transferred during in vitro fertilization. In turn, many countries saw a reversal in the multiple birth rate (Ibid; Kulkarni et al., 2013; Newman et al., 2023).

Data table for Chart 5
| Year | Aged less than 30 | Aged 30 and over | Total |
|---|---|---|---|
| proportion (%) | |||
| 1991 | 1.8 | 2.4 | 2.0 |
| 1992 | 1.9 | 2.4 | 2.1 |
| 1993 | 1.8 | 2.4 | 2.1 |
| 1994 | 2.0 | 2.7 | 2.2 |
| 1995 | 1.9 | 2.8 | 2.3 |
| 1996 | 2.0 | 2.9 | 2.4 |
| 1997 | 2.0 | 3.1 | 2.5 |
| 1998 | 2.2 | 3.2 | 2.6 |
| 1999 | 2.2 | 3.3 | 2.7 |
| 2000 | 2.2 | 3.3 | 2.7 |
| 2001 | 2.3 | 3.4 | 2.8 |
| 2002 | 2.3 | 3.6 | 2.9 |
| 2003 | 2.4 | 3.7 | 3.0 |
| 2004 | 2.4 | 3.7 | 3.0 |
| 2005 | 2.4 | 3.7 | 3.0 |
| 2006 | 2.3 | 3.9 | 3.1 |
| 2007 | 2.4 | 3.9 | 3.1 |
| 2008 | 2.4 | 3.8 | 3.1 |
| 2009 | 2.5 | 4.2 | 3.3 |
| 2010 | 2.4 | 4.1 | 3.3 |
| 2011 | 2.4 | 4.1 | 3.3 |
| 2012 | 2.4 | 4.0 | 3.2 |
| 2013 | 2.4 | 4.0 | 3.3 |
| 2014 | 2.4 | 3.9 | 3.2 |
| 2015 | 2.4 | 3.8 | 3.2 |
| 2016 | 2.4 | 3.7 | 3.1 |
| 2017 | 2.5 | 3.6 | 3.1 |
| 2018 | 2.5 | 3.6 | 3.1 |
| 2019 | 2.4 | 3.6 | 3.1 |
| 2020 | 2.4 | 3.3 | 2.9 |
| 2021 | 2.5 | 3.3 | 3.0 |
| 2022 | 2.6 | 3.4 | 3.1 |
|
Notes: Births for which the age of the mother or father is unknown were prorated using the observed distribution. The 2022 data are considered preliminary. The mother's age is that at the child's birth. Starting in 2017, the calculation for Canada excludes Yukon. Sources: Statistics Canada, Canadian Vital Statistics - Birth database (CVSB), Annual Demographic Estimates: Canada, Provinces and Territories. |
|||
From 2019 to 2020, there was a relatively large drop in the proportion of births that were multiples (from 3.1% to 2.9%), followed by a partial rebound in the following year (3.0% in 2021). This dip in 2020 coincided with the temporary closure (Canadian Fertility and Andrology Society, 2020a) and gradual reopening of fertility clinics because of the pandemic (Canadian Fertility and Andrology Society, 2020b). A similar pattern was observed in the United States over the same period: in their analysis of monthly fluctuations in the twin birth rate in the United States, Horon and Martin (2022) found that the timing of the monthly declines in late 2020 coincided with a corresponding conception period at the beginning of the COVID-19 pandemic, when public health measures that temporarily limited fertility treatments and procedures were introduced.
In contrast to the total number of births, which fell by 13.9% from 1991 to 2022, the number of multiple births increased by 33.8% over the same period. Additionally, among births to mothers aged 30 and over, 3.4% were multiple births in 2022, compared with 2.6% of births to mothers aged less than 30, a difference of 0.8 percentage points. This represents a closing of the gap between these age groups in comparison with 2010 (1.7 percentage points), but still larger than in 1991 (0.5 percentage points).
After falling in the 1960s at all ages, fertility rates began rising again among women in their 30s starting in the 1980s
The analysis of fertility rates for different age groups of women of childbearing age reveals notable differences in trends over time. After peaking at 3.94 children per woman in 1959, the TFR’s significant fall up to the mid-1970s was attributable to declines in fertility rates in all age groups (Chart 6). This drop coincided with the introduction of the hormonal birth control pill in 1960, permitted first to regulate menstrual cycles and then as a form of contraception in 1969, when “the pill” and therapeutic abortion were decriminalized with Bill C-150 (Verma Liao and Dollin, 2012; Bishop, 2021). At the same time, women entered the workforce in increasingly larger numbers, in concert with profound social changes, including the feminist movement, technological developments and labour market shortages (Statistics Canada, 2015).
In the second half of the 1970s, the decrease in fertility continued among women aged less than 30. Given their overall weight in the population, the TFR continued to decrease—though at a more modest rate—despite an increase in fertility rates among those aged 30 and over. A slight upturn in fertility rates was observed among all age groups from 1988 to 1991.
The contrasting trends of lowering fertility rates among women aged less than 30 and increasing rates among those aged 30 and over have persisted, leading to a series of milestones in subsequent decades. The fertility rate of women aged 30 to 34 exceeded that of women aged 20 to 24 for the first time in 1990; then, in 2005, the fertility rate among women aged 30 to 34 surpassed that of women aged 25 to 29. Five years later, in 2010, the fertility rate of women aged 35 to 39 first exceeded that of women aged 20 to 24.
Similarly, at the two extremes of the childbearing ages, opposing concurrent patterns have emerged since the turn of the 21st century: fertility rates for teenage mothers have been declining, while those for women aged 40 and over have been increasing. In 2014, the fertility rates of women aged 40 to 44 exceeded those of women aged 15 to 19, the first time this happened since the mid-1940s. Still, fertility rates for women in their 40s remain considerably lower than what was observed early in the 20th century.

Data table for Chart 6
| Year | 15 to 19 years | 20 to 24 years | 25 to 29 years | 30 to 34 years | 35 to 39 years | 40 to 44 years | Total fertility rate |
|---|---|---|---|---|---|---|---|
| number of children per 1,000 women | number of children per woman | ||||||
| 1921 | 36.8 | 162.3 | 185.1 | 154.0 | 108.9 | 45.5 | 3.48 |
| 1922 | 36.5 | 154.7 | 181.1 | 150.4 | 106.2 | 46.0 | 3.40 |
| 1923 | 32.5 | 145.1 | 172.9 | 144.9 | 102.4 | 43.6 | 3.23 |
| 1924 | 33.1 | 144.6 | 171.7 | 145.3 | 100.7 | 43.8 | 3.22 |
| 1925 | 33.4 | 138.8 | 167.6 | 139.7 | 99.3 | 42.5 | 3.13 |
| 1926 | 28.9 | 139.9 | 177.5 | 153.9 | 114.6 | 50.6 | 3.36 |
| 1927 | 29.4 | 140.0 | 173.6 | 151.2 | 113.8 | 49.4 | 3.32 |
| 1928 | 30.1 | 140.4 | 172.8 | 149.9 | 111.0 | 48.7 | 3.30 |
| 1929 | 30.2 | 139.9 | 172.5 | 144.2 | 104.8 | 46.1 | 3.22 |
| 1930 | 30.4 | 143.0 | 176.0 | 148.0 | 106.7 | 46.6 | 3.28 |
| 1931 | 29.7 | 137.2 | 175.2 | 145.3 | 103.1 | 44.0 | 3.20 |
| 1932 | 28.5 | 129.6 | 168.4 | 140.7 | 100.4 | 43.6 | 3.09 |
| 1933 | 27.3 | 117.9 | 155.6 | 132.8 | 94.9 | 39.2 | 2.87 |
| 1934 | 26.0 | 113.2 | 151.2 | 133.1 | 93.0 | 39.1 | 2.80 |
| 1935 | 26.4 | 112.6 | 148.6 | 128.7 | 92.6 | 37.2 | 2.75 |
| 1936 | 25.5 | 112.2 | 144.4 | 126.5 | 90.0 | 36.3 | 2.70 |
| 1937 | 25.5 | 113.7 | 142.2 | 123.5 | 85.3 | 34.6 | 2.64 |
| 1938 | 26.8 | 121.3 | 145.3 | 123.9 | 84.8 | 34.0 | 2.70 |
| 1939 | 27.1 | 119.7 | 144.0 | 120.5 | 83.0 | 32.5 | 2.65 |
| 1940 | 29.2 | 130.3 | 152.6 | 122.8 | 81.7 | 32.6 | 2.76 |
| 1941 | 30.5 | 138.4 | 159.8 | 122.3 | 80.0 | 31.6 | 2.83 |
| 1942 | 31.8 | 145.1 | 168.7 | 128.0 | 83.0 | 32.3 | 2.96 |
| 1943 | 32.0 | 146.8 | 175.5 | 132.0 | 86.5 | 31.8 | 3.03 |
| 1944 | 31.2 | 143.3 | 168.7 | 134.1 | 88.1 | 33.0 | 3.00 |
| 1945 | 31.4 | 143.3 | 166.9 | 134.4 | 90.2 | 33.5 | 3.01 |
| 1946 | 36.2 | 169.6 | 191.4 | 146.1 | 93.1 | 34.4 | 3.36 |
| 1947 | 42.4 | 189.1 | 206.4 | 150.5 | 93.1 | 34.1 | 3.58 |
| 1948 | 43.0 | 181.1 | 197.6 | 141.4 | 89.0 | 32.6 | 3.43 |
| 1949 | 45.0 | 181.5 | 201.3 | 139.8 | 88.8 | 31.5 | 3.44 |
| 1950 | 45.7 | 181.2 | 200.6 | 141.2 | 87.8 | 30.7 | 3.44 |
| 1951 | 47.7 | 188.5 | 198.7 | 144.4 | 86.4 | 30.8 | 3.49 |
| 1952 | 50.0 | 200.8 | 205.1 | 150.7 | 87.3 | 30.6 | 3.63 |
| 1953 | 51.7 | 208.0 | 208.4 | 153.1 | 88.0 | 31.1 | 3.71 |
| 1954 | 53.9 | 217.3 | 213.2 | 156.4 | 88.5 | 32.3 | 3.82 |
| 1955 | 53.8 | 218.0 | 215.1 | 153.7 | 89.6 | 32.1 | 3.82 |
| 1956 | 55.5 | 222.1 | 220.0 | 150.1 | 89.6 | 30.7 | 3.86 |
| 1957 | 59.7 | 226.9 | 224.1 | 149.3 | 90.6 | 30.6 | 3.92 |
| 1958 | 58.7 | 226.3 | 223.2 | 147.8 | 87.5 | 28.8 | 3.88 |
| 1959 | 59.9 | 233.6 | 226.5 | 147.5 | 87.1 | 28.4 | 3.94 |
| 1960 | 59.5 | 233.5 | 224.4 | 146.2 | 84.2 | 28.4 | 3.91 |
| 1961 | 57.8 | 233.6 | 219.2 | 145.0 | 81.1 | 28.5 | 3.86 |
| 1962 | 54.7 | 231.6 | 214.7 | 143.2 | 77.1 | 27.5 | 3.78 |
| 1963 | 52.8 | 226.1 | 210.6 | 140.3 | 75.8 | 25.9 | 3.69 |
| 1964 | 50.0 | 212.8 | 203.1 | 134.9 | 72.0 | 25.1 | 3.52 |
| 1965 | 49.1 | 188.6 | 181.9 | 119.4 | 65.9 | 22.0 | 3.16 |
| 1966 | 48.0 | 169.1 | 163.5 | 103.3 | 57.5 | 19.1 | 2.83 |
| 1967 | 45.0 | 161.4 | 152.6 | 91.8 | 50.9 | 15.9 | 2.60 |
| 1968 | 43.1 | 152.8 | 149.0 | 86.4 | 44.9 | 13.8 | 2.46 |
| 1969 | 42.3 | 147.9 | 150.1 | 85.1 | 42.7 | 12.5 | 2.41 |
| 1970 | 42.9 | 143.5 | 147.4 | 82.0 | 39.1 | 11.3 | 2.34 |
| 1971 | 38.9 | 129.4 | 138.5 | 76.0 | 33.3 | 9.3 | 2.13 |
| 1972 | 37.4 | 118.9 | 130.4 | 70.5 | 28.7 | 7.6 | 1.97 |
| 1973 | 36.4 | 113.5 | 128.6 | 66.0 | 25.4 | 6.3 | 1.88 |
| 1974 | 34.7 | 109.6 | 128.9 | 65.5 | 22.8 | 5.4 | 1.83 |
| 1975 | 34.7 | 109.8 | 130.3 | 65.0 | 21.6 | 4.8 | 1.83 |
| 1976 | 32.9 | 105.8 | 127.6 | 64.5 | 21.0 | 4.4 | 1.78 |
| 1977 | 31.3 | 103.7 | 126.2 | 65.7 | 20.3 | 3.6 | 1.75 |
| 1978 | 29.1 | 99.6 | 124.0 | 65.8 | 18.9 | 3.5 | 1.70 |
| 1979 | 27.3 | 98.1 | 126.0 | 67.2 | 19.1 | 3.3 | 1.70 |
| 1980 | 26.9 | 96.1 | 124.8 | 66.9 | 19.1 | 3.1 | 1.68 |
| 1981 | 25.8 | 92.3 | 123.9 | 67.0 | 19.2 | 3.2 | 1.65 |
| 1982 | 26.0 | 91.3 | 121.1 | 67.6 | 19.9 | 3.1 | 1.63 |
| 1983 | 24.5 | 88.8 | 120.6 | 69.3 | 20.3 | 3.0 | 1.62 |
| 1984 | 23.9 | 85.5 | 121.8 | 71.8 | 21.3 | 3.0 | 1.62 |
| 1985 | 23.2 | 82.1 | 121.4 | 72.7 | 21.6 | 3.0 | 1.61 |
| 1986 | 22.9 | 79.5 | 119.7 | 72.9 | 22.3 | 3.2 | 1.59 |
| 1987 | 22.7 | 76.8 | 117.5 | 73.6 | 23.3 | 3.3 | 1.58 |
| 1988 | 22.9 | 77.4 | 118.5 | 75.7 | 24.8 | 3.6 | 1.60 |
| 1989 | 24.5 | 79.4 | 120.2 | 79.7 | 26.0 | 3.7 | 1.66 |
| 1990 | 25.3 | 80.3 | 123.2 | 83.6 | 27.7 | 3.9 | 1.71 |
| 1991 | 25.8 | 78.9 | 124.2 | 83.9 | 28.2 | 3.9 | 1.72 |
| 1992 | 25.6 | 76.6 | 121.6 | 86.1 | 29.0 | 4.2 | 1.71 |
| 1993 | 25.0 | 74.9 | 118.0 | 86.0 | 29.7 | 4.4 | 1.69 |
| 1994 | 25.1 | 74.0 | 117.6 | 87.0 | 30.5 | 4.7 | 1.69 |
| 1995 | 24.4 | 72.2 | 113.7 | 88.1 | 31.6 | 4.9 | 1.67 |
| 1996 | 22.2 | 68.8 | 110.0 | 87.3 | 32.7 | 5.1 | 1.63 |
| 1997 | 20.1 | 64.7 | 105.5 | 84.9 | 32.6 | 5.2 | 1.57 |
| 1998 | 19.8 | 64.0 | 103.6 | 85.1 | 32.9 | 5.2 | 1.56 |
| 1999 | 18.7 | 61.8 | 102.2 | 86.6 | 33.7 | 5.6 | 1.55 |
| 2000 | 17.2 | 59.3 | 99.6 | 86.2 | 33.8 | 5.8 | 1.51 |
| 2001 | 16.1 | 56.8 | 101.3 | 91.3 | 35.5 | 6.0 | 1.54 |
| 2002 | 15.1 | 54.5 | 99.0 | 91.2 | 36.1 | 6.1 | 1.52 |
| 2003 | 14.4 | 53.2 | 100.6 | 94.6 | 38.6 | 6.5 | 1.55 |
| 2004 | 13.6 | 51.4 | 100.0 | 97.5 | 40.4 | 6.9 | 1.56 |
| 2005 | 13.3 | 51.1 | 99.5 | 101.0 | 42.8 | 7.2 | 1.58 |
| 2006 | 13.7 | 51.9 | 100.9 | 105.0 | 45.9 | 7.4 | 1.63 |
| 2007 | 13.9 | 52.7 | 102.0 | 108.0 | 48.6 | 7.9 | 1.67 |
| 2008 | 14.2 | 53.4 | 102.9 | 110.3 | 50.4 | 8.5 | 1.70 |
| 2009 | 14.1 | 51.7 | 101.7 | 109.9 | 50.8 | 9.3 | 1.69 |
| 2010 | 13.3 | 48.3 | 97.4 | 108.0 | 51.7 | 9.9 | 1.65 |
| 2011 | 12.4 | 46.2 | 96.5 | 107.6 | 52.5 | 10.3 | 1.63 |
| 2012 | 12.1 | 44.7 | 96.4 | 108.5 | 53.4 | 10.7 | 1.63 |
| 2013 | 11.2 | 42.9 | 94.2 | 108.4 | 53.7 | 10.7 | 1.61 |
| 2014 | 10.4 | 42.5 | 94.0 | 109.2 | 54.7 | 10.9 | 1.61 |
| 2015 | 9.5 | 41.0 | 92.4 | 109.9 | 55.6 | 11.4 | 1.60 |
| 2016 | 8.5 | 39.6 | 91.3 | 110.5 | 56.7 | 11.5 | 1.59 |
| 2017 | 7.8 | 37.2 | 87.3 | 108.0 | 57.1 | 11.7 | 1.55 |
| 2018 | 6.7 | 34.2 | 84.0 | 106.8 | 57.3 | 12.1 | 1.51 |
| 2019 | 6.2 | 31.9 | 81.1 | 105.5 | 57.4 | 12.4 | 1.47 |
| 2020 | 5.7 | 29.7 | 76.6 | 101.6 | 55.3 | 12.3 | 1.41 |
| 2021 | 5.1 | 27.5 | 77.2 | 106.9 | 58.1 | 12.3 | 1.44 |
| 2022 | 4.4 | 24.8 | 69.4 | 98.7 | 55.6 | 12.6 | 1.33 |
|
Notes: Births for which the age of the mother is unknown were prorated using the observed distribution. The 2022 data are considered preliminary. Calculations for Canada from 2017 exclude Yukon. Sources: Statistics Canada, Canadian Vital Statistics - Birth database (CVSB), Annual Demographic Estimates: Canada, Provinces and Territories. |
|||||||
The years 2008 and 2009 were marked by a global recession following the collapse of the American housing market. The impact of this shock was relatively modest in Canada because of its strong financial position at the time (Lindquist, 2022). Generally, economic downturns lead to a decline in fertility (Sobotka et al., 2011), with a reversal in trend coinciding with subsequent economic recovery. However, a subsequent upturn in fertility has not been seen in Canada. The same observation was made in Scandinavian countries, despite their generous family policies (Laplante, 2023). More specifically, fertility rates for young women aged 15 to 24 have continued to fall without interruption since 2009, as they have for 25- to 29-year-olds (with the exception of one year). Among 30- to 34-year-old women, the period from 2009 to 2022 was marked by fertility rate decreases in 9 of 14 years.
Greater volatility in age-specific fertility trends since 2020
From 2020 to 2021, fertility rates rebounded slightly among women aged 25 to 29, 30 to 34, 35 to 39 and 40 to 44. This marked the first time since the 2007-to-2008 period that the fertility rate for women aged 25 to 29 increased. The fertility increase from 2020 to 2021 was particularly large among women in their early 30s, following four consecutive years of decline. In sum, despite the sudden increase from 2020 to 2021,Note it appears that, overall, fertility rates among women aged 30 to 34 have established a new decreasing trend.
After a long period of constant annual increases from 1978 to 2019, the fertility rates of women aged 35 to 39 have fallen twice in recent years. The period from 2021 to 2022 saw the largest percentage drop in fertility rates for all age groups from 20 to 39 years over the period from 1979 to 2022. In contrast to younger age groups, fertility rates among women in their 40s did not show the same degree of volatility; this may reflect the fact that postponement of childbearing in response to the pandemic may have been less feasible or desirable at these ages owing to the biological limits of fertility.
Nunavut and Saskatchewan have the highest fertility rates at younger ages
In 2022, Nunavut was the only jurisdiction where the highest age-specific fertility rates were found among women aged 20 to 24 (Table 2). Among all the provinces, fertility rates were highest for women aged 30 to 34, except in New Brunswick, where rates were highest among women aged 25 to 29.
| Geographical region | 15 to 19 years | 20 to 24 years | 25 to 29 years | 30 to 34 years | 35 to 39 years | 40 to 44 years | 45 to 49 years |
|---|---|---|---|---|---|---|---|
| Canada | 4.4 | 24.8 | 69.4 | 98.7 | 55.6 | 12.6 | 0.9 |
| Newfoundland and Labrador | 5.6 | 32.3 | 73.4 | 84.8 | 41.8 | 6.2 | 0.1 |
| Prince Edward Island | 4.9 | 24.1 | 65.6 | 96.7 | 44.4 | 7.8 | 0.6 |
| Nova Scotia | 5.8 | 27.1 | 63.9 | 84.9 | 46.8 | 8.5 | 0.4 |
| New Brunswick | 7.0 | 42.5 | 89.3 | 82.6 | 36.8 | 6.9 | 0.2 |
| Quebec | 4.2 | 31.2 | 90.2 | 106.5 | 53.3 | 12.2 | 0.7 |
| Ontario | 3.0 | 18.6 | 58.7 | 99.5 | 60.0 | 13.7 | 1.0 |
| Manitoba | 9.2 | 35.0 | 79.4 | 99.3 | 51.9 | 10.8 | 0.9 |
| Saskatchewan | 14.4 | 48.5 | 105.0 | 110.5 | 49.3 | 9.9 | 0.6 |
| Alberta | 5.2 | 32.4 | 80.7 | 104.1 | 55.2 | 12.5 | 0.7 |
| British Columbia | 2.7 | 15.8 | 50.0 | 83.4 | 55.6 | 13.7 | 1.1 |
| Northwest Territories | 12.3 | 49.0 | 68.0 | 101.7 | 55.6 | 10.9 | 0.0 |
| Nunavut | 67.2 | 121.3 | 112.4 | 81.0 | 49.2 | 12.1 | 1.0 |
|
Notes: Births for which the age of the mother is unknown were prorated using the observed distribution. The 2022 data are considered preliminary. Starting in 2017, the calculation for Canada excludes Yukon. Sources: Statistics Canada, Canadian Vital Statistics - Birth database (CVSB), Annual Demographic Estimates: Canada, Provinces and Territories. |
|||||||
For all age groups under 30, Nunavut had by far the highest fertility rates in 2022. The teenage fertility rate in Nunavut was 15 times higher than the national average, and the fertility rate among women aged 20 to 24 was almost 5 times the one for Canada as a whole. Among the provinces, Saskatchewan had the highest fertility rates for all age groups less than 35.
Ontario had the highest fertility rate for women aged 35 to 39, while British Columbia had the highest fertility rate for women aged 40 and over, a longstanding pattern.
Cohort fertility and childlessness
In the absence of a very strong rebound in their late 30s, today’s younger cohorts of women are trending towards lower completed fertility than their predecessors
Period fertility measures are highly influenced by changes in the timing (or tempo) of fertility among successive cohorts of women.Note However, the trend of increasing postponement of fertility among women does not necessarily lead to a decrease in their completed fertility if women ultimately compensate for that postponement with sufficiently high fertility at older ages. Unfortunately, a given cohort of women must be past reproductive ages before a clear portrait of their completed (cohort) fertility patterns can be examined. That said, examining the cumulative age-specific fertility rates of each cohort of women reveals insights about their fertility trajectories to date in comparison with previous cohorts.

Data table for Chart 7
| Age | Birth cohort | ||||||||
|---|---|---|---|---|---|---|---|---|---|
| 1960 | 1965 | 1970 | 1975 | 1980 | 1985 | 1990 | 1995 | 2000 | |
| 15 | 0.0074 | 0.0064 | 0.0055 | 0.0059 | 0.0061 | 0.0039 | 0.0027 | 0.0026 | 0.0015 |
| 16 | 0.0243 | 0.0189 | 0.0171 | 0.0189 | 0.0172 | 0.0110 | 0.0088 | 0.0081 | 0.0046 |
| 17 | 0.0543 | 0.0429 | 0.0383 | 0.0439 | 0.0360 | 0.0242 | 0.0209 | 0.0185 | 0.0107 |
| 18 | 0.0955 | 0.0751 | 0.0704 | 0.0791 | 0.0634 | 0.0445 | 0.0409 | 0.0342 | 0.0194 |
| 19 | 0.1483 | 0.1180 | 0.1159 | 0.1267 | 0.1003 | 0.0722 | 0.0697 | 0.0557 | 0.0329 |
| 20 | 0.2139 | 0.1711 | 0.1734 | 0.1820 | 0.1443 | 0.1079 | 0.1033 | 0.0824 | 0.0500 |
| 21 | 0.2921 | 0.2346 | 0.2402 | 0.2425 | 0.1932 | 0.1510 | 0.1408 | 0.1143 | 0.0700 |
| 22 | 0.3859 | 0.3082 | 0.3148 | 0.3070 | 0.2466 | 0.2016 | 0.1848 | 0.1510 | 0.0929 |
| 23 | 0.4897 | 0.3947 | 0.3980 | 0.3794 | 0.3076 | 0.2618 | 0.2335 | 0.1910 | Note ...: not applicable |
| 24 | 0.6046 | 0.4951 | 0.4896 | 0.4574 | 0.3762 | 0.3303 | 0.2913 | 0.2379 | Note ...: not applicable |
| 25 | 0.7261 | 0.6102 | 0.5909 | 0.5436 | 0.4565 | 0.4058 | 0.3589 | 0.2916 | Note ...: not applicable |
| 26 | 0.8499 | 0.7315 | 0.6979 | 0.6382 | 0.5487 | 0.4925 | 0.4380 | 0.3555 | Note ...: not applicable |
| 27 | 0.9744 | 0.8570 | 0.8038 | 0.7398 | 0.6524 | 0.5903 | 0.5257 | 0.4243 | Note ...: not applicable |
| 28 | 1.0947 | 0.9826 | 0.9142 | 0.8485 | 0.7665 | 0.6966 | 0.6221 | Note ...: not applicable | Note ...: not applicable |
| 29 | 1.2113 | 1.1029 | 1.0256 | 0.9667 | 0.8865 | 0.8112 | 0.7261 | Note ...: not applicable | Note ...: not applicable |
| 30 | 1.3237 | 1.2152 | 1.1289 | 1.0883 | 1.0112 | 0.9318 | 0.8292 | Note ...: not applicable | Note ...: not applicable |
| 31 | 1.4216 | 1.3148 | 1.2315 | 1.2021 | 1.1270 | 1.0517 | 0.9422 | Note ...: not applicable | Note ...: not applicable |
| 32 | 1.5072 | 1.4018 | 1.3248 | 1.3107 | 1.2376 | 1.1631 | 1.0435 | Note ...: not applicable | Note ...: not applicable |
| 33 | 1.5789 | 1.4766 | 1.4093 | 1.4109 | 1.3392 | 1.2661 | Note ...: not applicable | Note ...: not applicable | Note ...: not applicable |
| 34 | 1.6407 | 1.5411 | 1.4871 | 1.4990 | 1.4310 | 1.3593 | Note ...: not applicable | Note ...: not applicable | Note ...: not applicable |
| 35 | 1.6911 | 1.5942 | 1.5551 | 1.5762 | 1.5126 | 1.4384 | Note ...: not applicable | Note ...: not applicable | Note ...: not applicable |
| 36 | 1.7318 | 1.6385 | 1.6124 | 1.6399 | 1.5812 | 1.5092 | Note ...: not applicable | Note ...: not applicable | Note ...: not applicable |
| 37 | 1.7631 | 1.6730 | 1.6592 | 1.6923 | 1.6366 | 1.5639 | Note ...: not applicable | Note ...: not applicable | Note ...: not applicable |
| 38 | 1.7865 | 1.7006 | 1.6966 | 1.7334 | 1.6802 | Note ...: not applicable | Note ...: not applicable | Note ...: not applicable | Note ...: not applicable |
| 39 | 1.8030 | 1.7217 | 1.7253 | 1.7643 | 1.7141 | Note ...: not applicable | Note ...: not applicable | Note ...: not applicable | Note ...: not applicable |
| 40 | 1.8154 | 1.7371 | 1.7462 | 1.7878 | 1.7378 | Note ...: not applicable | Note ...: not applicable | Note ...: not applicable | Note ...: not applicable |
| 41 | 1.8234 | 1.7474 | 1.7602 | 1.8031 | 1.7541 | Note ...: not applicable | Note ...: not applicable | Note ...: not applicable | Note ...: not applicable |
| 42 | 1.8284 | 1.7543 | 1.7689 | 1.8127 | 1.7647 | Note ...: not applicable | Note ...: not applicable | Note ...: not applicable | Note ...: not applicable |
| 43 | 1.8313 | 1.7580 | 1.7740 | 1.8191 | Note ...: not applicable | Note ...: not applicable | Note ...: not applicable | Note ...: not applicable | Note ...: not applicable |
| 44 | 1.8330 | 1.7604 | 1.7770 | 1.8227 | Note ...: not applicable | Note ...: not applicable | Note ...: not applicable | Note ...: not applicable | Note ...: not applicable |
| 45 | 1.8338 | 1.7614 | 1.7787 | 1.8246 | Note ...: not applicable | Note ...: not applicable | Note ...: not applicable | Note ...: not applicable | Note ...: not applicable |
| 46 | 1.8342 | 1.7620 | 1.7797 | 1.8256 | Note ...: not applicable | Note ...: not applicable | Note ...: not applicable | Note ...: not applicable | Note ...: not applicable |
| 47 | 1.8344 | 1.7624 | 1.7802 | 1.8263 | Note ...: not applicable | Note ...: not applicable | Note ...: not applicable | Note ...: not applicable | Note ...: not applicable |
| 48 | 1.8345 | 1.7627 | 1.7806 | Note ...: not applicable | Note ...: not applicable | Note ...: not applicable | Note ...: not applicable | Note ...: not applicable | Note ...: not applicable |
| 49 | 1.8346 | 1.7628 | 1.7808 | Note ...: not applicable | Note ...: not applicable | Note ...: not applicable | Note ...: not applicable | Note ...: not applicable | Note ...: not applicable |
|
... not applicable Notes: Births for which the age of the mother is unknown were prorated using the observed distribution. The 2022 data are considered preliminary. Starting in 2017, the calculation for Canada excludes Yukon. Sources: Statistics Canada, Canadian Vital Statistics - Birth database (CVSB), Annual Demographic Estimates: Canada, Provinces and Territories. |
|||||||||
The youngest cohorts of women have been increasingly delaying the onset of childbearing and shifting the bulk of childbearing from occurring in their 20s to in their 30s (Chart 7). Yet this shift in the timing of childbearing does not always ultimately result in lower completed fertility. For example, the cohort of women born in 1975 had lower fertility in their 20s than earlier cohorts of women but it rebounded strongly in their 30s. In the end, the 1975 cohort experienced higher completed cohort fertility than the older 1965 and 1970 cohorts of women.
The rate of childlessness is trending higher
It remains to be seen whether the fertility of women born in the 1980s and 1990s will ultimately “catch up” to the same extent as the 1975 cohort; what is clear is they will have much greater ground to make up given the increasing magnitude of postponement occurring for each successive cohort. It is possible that fertility rates among women in their 40s could rise significantly above their current levels (Billari et al., 2007), but likely not at sufficient levels to completely compensate for all childbearing postponed at younger ages. At the individual level, increasingly pushing the limits of postponement could result in a growing number of women and couples facing age-related infertility and therefore finding themselves unable to achieve their intended family size. While having biological children is not the only route to motherhood,Note the proportion of women aged 50 and over who have no biological children has increased over time, from 14.1% in 1990 to 17.4% in 2022 (Table 3).
| Year | Proportion (%) |
|---|---|
| 1990 | 14.1 |
| 2001 | 14.1 |
| 2006 | 14.4 |
| 2011 | 15.3 |
| 2017 | 16.3 |
| 2022 | 17.4 |
|
Note: The data were weighted to represent the Canadian population. Sources: Statistics Canada, Canadian Social Survey – Well-being and Family Relationships, 2022, General Social Survey, 1990, 2001, 2006, 2011 and 2017. |
|
Conclusion
Situated in a historical perspective, Canada’s record low TFR in 2022 is the continuation of a long-term downward trend. Indeed, taking into account a century of fertility data from 1921 to 2022, the five lowest TFRs on record occurred in the last five years of that period (2018 to 2022). The large decrease in fertility in Canada from 2021 to 2022 was the result of a nearlyNote uniform downward shift in fertility among provinces and territories, and for all ages, except among the oldest age group (40 and over). Canada is also far from alone in this experience: most high-income countries have shown a decreasing pattern in their TFRs in recent years, with substantial drops from 2021 to 2022. As a result, the TFR in Canada continues to hold its longstanding “middle of the pack” position among comparable countries.
The age profile of fertility is also becoming increasingly older, with the average age of childbearing trending steadily upward for more than four decades. At the subnational level, however, a trend of “lower and later” fertility is not always the case: Nunavut’s age-specific fertility rates continue to be exceptionally higher among younger age groups, and New Brunswick and Saskatchewan also continue to post relatively high fertility rates among women in their 20s. Quebec in particular has experienced a fertility evolution unique within Canada, trending “higher and younger” since the mid-2000s.
When the cumulative fertility rates of various cohorts of women are examined, a clear pattern emerges at the national level of increasing postponement of childbearing among young cohorts of women, the youngest among them born in the early 21st century. While increasing postponement does not necessarily lead to lower completed fertility—provided women compensate for that postponement with higher fertility at older ages—the cumulative fertility of Canada’s youngest cohorts of women suggests their fertility is on track to complete at a lower level than that of previous generations.
There has been strong interest in understanding the impact of the COVID-19 pandemic on fertility. Considering seasonality, monthly birth patterns suggest that there was likely a brief period of postponement of new conceptions in the early stages of the pandemic, a pattern observed in many countries over the same period. This was followed by a rebound in those postponed conceptions, which led to a small uptick in births and Canada’s TFR in 2021, and then a resumption of the longer-term downward trend in births and fertility in 2022. This “down-up-down” pattern from 2020 to 2022 was also seen in many other high-income countries, suggesting a widespread behavioural response to the pandemic may have occurred. While Canada’s TFR evolved in a quite erratic manner from 2020 to 2022, other periods in the country’s history have been more volatile, such as during the baby boom and the “baby bust” that followed it. Instead, the distinguishing feature of the last few years is the record-low levels of fertility observed.
Appendix

Data table for Chart 8
| Age | Birth cohort | ||||||||
|---|---|---|---|---|---|---|---|---|---|
| 1960 | 1965 | 1970 | 1975 | 1980 | 1985 | 1990 | 1995 | 2000 | |
| 15 | 0.0029 | 0.0032 | 0.0033 | 0.0031 | 0.0033 | 0.0023 | 0.0017 | 0.0011 | 0.0010 |
| 16 | 0.0113 | 0.0085 | 0.0096 | 0.0093 | 0.0095 | 0.0066 | 0.0046 | 0.0041 | 0.0024 |
| 17 | 0.0265 | 0.0191 | 0.0208 | 0.0231 | 0.0213 | 0.0155 | 0.0113 | 0.0095 | 0.0057 |
| 18 | 0.0507 | 0.0378 | 0.0430 | 0.0490 | 0.0422 | 0.0317 | 0.0259 | 0.0206 | 0.0126 |
| 19 | 0.0876 | 0.0659 | 0.0807 | 0.0895 | 0.0744 | 0.0554 | 0.0523 | 0.0388 | 0.0267 |
| 20 | 0.1390 | 0.1063 | 0.1328 | 0.1398 | 0.1152 | 0.0882 | 0.0815 | 0.0629 | 0.0446 |
| 21 | 0.2052 | 0.1604 | 0.1971 | 0.1999 | 0.1626 | 0.1281 | 0.1176 | 0.0930 | 0.0663 |
| 22 | 0.2896 | 0.2260 | 0.2728 | 0.2664 | 0.2164 | 0.1773 | 0.1619 | 0.1304 | 0.0940 |
| 23 | 0.3848 | 0.3106 | 0.3622 | 0.3435 | 0.2785 | 0.2419 | 0.2146 | 0.1750 | Note ...: not applicable |
| 24 | 0.4939 | 0.4132 | 0.4637 | 0.4263 | 0.3482 | 0.3175 | 0.2799 | 0.2305 | Note ...: not applicable |
| 25 | 0.6115 | 0.5357 | 0.5739 | 0.5210 | 0.4370 | 0.4076 | 0.3598 | 0.2977 | Note ...: not applicable |
| 26 | 0.7302 | 0.6670 | 0.6948 | 0.6257 | 0.5415 | 0.5101 | 0.4557 | 0.3800 | Note ...: not applicable |
| 27 | 0.8479 | 0.8045 | 0.8110 | 0.7364 | 0.6589 | 0.6261 | 0.5596 | 0.4721 | Note ...: not applicable |
| 28 | 0.9601 | 0.9365 | 0.9271 | 0.8554 | 0.7894 | 0.7505 | 0.6743 | Note ...: not applicable | Note ...: not applicable |
| 29 | 1.0726 | 1.0591 | 1.0376 | 0.9732 | 0.9233 | 0.8794 | 0.7945 | Note ...: not applicable | Note ...: not applicable |
| 30 | 1.1790 | 1.1688 | 1.1402 | 1.0915 | 1.0510 | 1.0070 | 0.9130 | Note ...: not applicable | Note ...: not applicable |
| 31 | 1.2741 | 1.2649 | 1.2384 | 1.2116 | 1.1731 | 1.1350 | 1.0377 | Note ...: not applicable | Note ...: not applicable |
| 32 | 1.3536 | 1.3454 | 1.3262 | 1.3211 | 1.2850 | 1.2469 | 1.1466 | Note ...: not applicable | Note ...: not applicable |
| 33 | 1.4183 | 1.4112 | 1.4026 | 1.4204 | 1.3855 | 1.3458 | Note ...: not applicable | Note ...: not applicable | Note ...: not applicable |
| 34 | 1.4730 | 1.4661 | 1.4699 | 1.5071 | 1.4772 | 1.4359 | Note ...: not applicable | Note ...: not applicable | Note ...: not applicable |
| 35 | 1.5170 | 1.5111 | 1.5294 | 1.5804 | 1.5557 | 1.5119 | Note ...: not applicable | Note ...: not applicable | Note ...: not applicable |
| 36 | 1.5518 | 1.5468 | 1.5797 | 1.6408 | 1.6216 | 1.5782 | Note ...: not applicable | Note ...: not applicable | Note ...: not applicable |
| 37 | 1.5765 | 1.5739 | 1.6213 | 1.6908 | 1.6733 | 1.6301 | Note ...: not applicable | Note ...: not applicable | Note ...: not applicable |
| 38 | 1.5952 | 1.5956 | 1.6552 | 1.7302 | 1.7131 | Note ...: not applicable | Note ...: not applicable | Note ...: not applicable | Note ...: not applicable |
| 39 | 1.6078 | 1.6128 | 1.6802 | 1.7594 | 1.7457 | Note ...: not applicable | Note ...: not applicable | Note ...: not applicable | Note ...: not applicable |
| 40 | 1.6175 | 1.6251 | 1.6994 | 1.7829 | 1.7679 | Note ...: not applicable | Note ...: not applicable | Note ...: not applicable | Note ...: not applicable |
| 41 | 1.6236 | 1.6333 | 1.7125 | 1.7977 | 1.7838 | Note ...: not applicable | Note ...: not applicable | Note ...: not applicable | Note ...: not applicable |
| 42 | 1.6272 | 1.6390 | 1.7210 | 1.8069 | 1.7946 | Note ...: not applicable | Note ...: not applicable | Note ...: not applicable | Note ...: not applicable |
| 43 | 1.6294 | 1.6417 | 1.7257 | 1.8134 | Note ...: not applicable | Note ...: not applicable | Note ...: not applicable | Note ...: not applicable | Note ...: not applicable |
| 44 | 1.6305 | 1.6434 | 1.7286 | 1.8168 | Note ...: not applicable | Note ...: not applicable | Note ...: not applicable | Note ...: not applicable | Note ...: not applicable |
| 45 | 1.6309 | 1.6442 | 1.7302 | 1.8185 | Note ...: not applicable | Note ...: not applicable | Note ...: not applicable | Note ...: not applicable | Note ...: not applicable |
| 46 | 1.6311 | 1.6446 | 1.7308 | 1.8192 | Note ...: not applicable | Note ...: not applicable | Note ...: not applicable | Note ...: not applicable | Note ...: not applicable |
| 47 | 1.6312 | 1.6448 | 1.7312 | 1.8196 | Note ...: not applicable | Note ...: not applicable | Note ...: not applicable | Note ...: not applicable | Note ...: not applicable |
| 48 | 1.6313 | 1.6450 | 1.7316 | Note ...: not applicable | Note ...: not applicable | Note ...: not applicable | Note ...: not applicable | Note ...: not applicable | Note ...: not applicable |
| 49 | 1.6314 | 1.6450 | 1.7318 | Note ...: not applicable | Note ...: not applicable | Note ...: not applicable | Note ...: not applicable | Note ...: not applicable | Note ...: not applicable |
|
... not applicable Notes: Births for which the age of the mother is unknown were prorated using the observed distribution. The 2022 data are considered preliminary. Sources: Statistics Canada, Canadian Vital Statistics - Birth database (CVSB), Annual Demographic Estimates: Canada, Provinces and Territories. |
|||||||||
| Year | Canada | France | Germany | Italy | Japan | Netherlands | South Korea | Spain | United Kingdom | United States |
|---|---|---|---|---|---|---|---|---|---|---|
| number of children per woman | ||||||||||
| 2000 | 1.51 | 1.89 | 1.38 | 1.26 | 1.36 | 1.72 | 1.48 | 1.21 | 1.65 | 2.05 |
| 2019 | 1.47 | 1.86 | 1.54 | 1.27 | 1.36 | 1.57 | 0.92 | 1.23 | 1.65 | 1.71 |
| 2020 | 1.41 | 1.82 | 1.53 | 1.24 | 1.33 | 1.55 | 0.84 | 1.18 | 1.58 | 1.64 |
| 2021 | 1.44 | 1.84 | 1.58 | 1.25 | 1.30 | 1.62 | 0.81 | 1.18 | 1.55 | 1.66 |
| 2022 | 1.33 | 1.80 | 1.46 | 1.24 | 1.26 | 1.49 | 0.78 | 1.16 | 1.52 | 1.67 |
| Rank (2022) | 5 | 10 | 6 | 3 | 4 | 7 | 1 | 2 | 8 | 9 |
| Variation (N) | ||||||||||
| 2019 to 2020 | -0.07 | -0.04 | -0.01 | -0.03 | -0.03 | -0.03 | -0.08 | -0.05 | -0.07 | -0.06 |
| 2020 to 2021 | 0.03 | 0.02 | 0.05 | 0.01 | -0.03 | 0.08 | -0.03 | 0.00 | -0.03 | 0.02 |
| 2021 to 2022 | -0.11 | -0.04 | -0.12 | -0.01 | -0.04 | -0.14 | -0.03 | -0.02 | -0.03 | 0.00 |
| 2000 to 2019 | -0.04 | -0.03 | 0.16 | 0.01 | 0.00 | -0.15 | -0.56 | 0.02 | 0.00 | -0.35 |
| 2019 to 2022 | -0.14 | -0.07 | -0.09 | -0.03 | -0.10 | -0.09 | -0.14 | -0.07 | -0.13 | -0.04 |
| Variation (%) | ||||||||||
| 2019 to 2020 | -4.5 | -2.3 | -0.8 | -2.4 | -2.2 | -1.8 | -8.8 | -4.1 | -4.2 | -3.8 |
| 2020 to 2021 | 2.2 | 1.0 | 3.2 | 0.8 | -2.3 | 5.1 | -3.5 | 0.0 | -1.9 | 1.3 |
| 2021 to 2022 | -7.4 | -2.3 | -7.7 | -0.8 | -3.1 | -8.4 | -3.7 | -1.7 | -1.9 | 0.1 |
| 2000 to 2019 | -2.7 | -1.6 | 11.8 | 1.1 | 0.0 | -8.6 | -38.0 | 1.7 | 0.0 | -16.9 |
| 2019 to 2022 | -9.7 | -3.6 | -5.5 | -2.4 | -7.4 | -5.5 | -15.3 | -5.7 | -7.9 | -2.4 |
|
Notes: Rank (2022) refers to the rank of total fertility rate among the 10 selected countries, with rank 1 equalling the lowest rate. For Canada - Births for which the age of the mother is unknown were prorated using the observed distribution. The 2022 data are considered preliminary. Starting in 2017, the calculation for Canada excludes Yukon. Sources: Canada: Statistics Canada, Canadian Vital Statistics - Birth database (CVSB), Annual Demographic Estimates: Canada, Provinces and Territories; France: INSEE, Bilan démographique 2022 (https://www.insee.fr/fr/statistiques/6687000); United States: CDC - National Vital Statistics Reports, Births: Final Data for 2021 (https://www.cdc.gov/nchs/data/nvsr/nvsr72/nvsr72-01.pdf?ftag=MSF0951a18), Vital Statistics Rapid Release, Births: Provisional Data for 2022 (https://www.cdc.gov/nchs/data/vsrr/vsrr028.pdf); Italy: 1) ISTAT, Fertility indicators (http://dati.istat.it/?lang=en#); 2) DEMOGRAPHIC INDICATORS - YEAR 2022 (https://www.istat.it/en/archivio/283234); Spain: Fecundidad. Total Nacional. Ambas nacionalidades (https://www.ine.es/consul/serie.do?d=true&s=IDB72160); United Kingdom: 1) Births in England and Wales: 2022, Summary tables (https://www.ons.gov.uk/peoplepopulationandcommunity/birthsdeathsandmarriages/livebirths/datasets/birthsummarytables); 2) TFR 2022: Principal projection - UK summary, 2020-based interim edition (https://www.ons.gov.uk/peoplepopulationandcommunity/populationandmigration/populationprojections/datasets/tablea11principalprojectionuksummary); Germany: Total fertility rate (https://www.destatis.de/EN/Themes/Society-Environment/Population/_Graphic/_Interactive/total-fertility-rate.html); Japan: Ministry of Health, Labour and Welfare of Japan. Summary of Vital Statistics (rates) (https://www.mhlw.go.jp/english/database/db-hw/populate/dl/E02.pdf); Netherlands: Statistics Netherlands (CBS) (https://opendata.cbs.nl/#/CBS/en/dataset/85722ENG/table); South Korea: Korean Statistical Information Service. Total Fertility Rates and Age-Specific Fertility Rates for Provinces, (https://kosis.kr/statHtml/statHtml.do?orgId=101&tblId=DT_1B81A21&conn_path=I2&language=en). |
||||||||||
Data and methods
Unless otherwise indicated, data used in this analysis come from the Canadian Vital Statistics - Birth database (CVSB) and the Annual Demographic Estimates.
The CVSB is an administrative survey that collects demographic information annually from provincial and territorial vital statistics registries on all live births in Canada. In 2022, in an effort to be timelier, the duration of data collection was shortened compared with previous years. Therefore, the 2022 data are considered preliminary.
During the production of each year’s birth statistics, data from previous years may be revised to reflect any updates or changes that have been received from the provincial and territorial vital statistics registrars. Birth data for 2020 and 2021 were revised on September 26, 2023.
Data on births from 2017 to 2022 that occurred in Yukon are not available. To avoid confusion, data on births to residents of Yukon that occurred in other provinces and territories for these same years were also suppressed.
As a result of delays with birth registrations, fewer births have been captured, to date, for Manitoba in 2022. There were also fewer births captured for Nova Scotia in 2021 because of coverage issues.
The geographic distribution of live births in this table is based on the mother’s usual place of residence.
Demographic estimates by age and sex are used in this article to calculate various types of fertility rates. Postcensal estimates for the years 2016 to 2022 are based on the 2016 Census counts adjusted for census net undercoverage and incompletely enumerated reserves, because these were the most up-to-date estimates at the time of writing of the article.
Concepts
Total fertility rate: An estimate of the average number of live births a woman can be expected to have in her lifetime, based on the age-specific fertility rates of a given year. The total fertility rate is the sum of age-specific fertility rates for a given year, divided by 1,000.
Age-specific fertility rate: The number of live births per 1,000 women in a specific age group. The calculation consists of dividing the number of births to mothers by the population of women, for each unique age, and then multiplying by 1,000. Five-year age groups were used in these tabulations (ranging from 15 to 19 years to 45 to 49 years).
Average age of childbearing: The average (or mean) age of mothers at the birth of their child for a given year. The age of a mother is considered her age attained at her last birthday preceding delivery. Average age is calculated by summing the single-age fertility rates that have been multiplied by the mid-year age, and then dividing this sum by the total fertility rate. Births for which the age of the mother is unknown were prorated using the observed distribution.
Cohort fertility rate: The total number of children women from a specific birth year (cohort) give birth to throughout their lives, expressed per 1,000. The cohort fertility rate cannot be calculated until the cohort of women reaches the end of their childbearing years (generally, at age 50).
Cumulative fertility rate: For a given cohort of women, the sum of their age-specific fertility rates that have been observed as of a specific point in time. This indicator is useful for examining differences in the timing and quantum of childbearing of different cohorts of women who may have not yet reached the end of their childbearing years.
Cohort replacement level: The fertility level, of 2.1 children per woman (or higher), required to replace the population in the absence of migration and taking into account mortality conditions between the ages of 0 and 15, after which the reproductive period usually begins.
Terminology related to gender and sex
Statistics Canada released new statistical standards for sex at birth of person and gender of person in April 2018. Statistical standards are a set of rules used to standardize how data are collected and how statistics are produced and published for a given variable of interest. The 2018 standards were used in the 2021 Census, conducted in May 2021. These statistical standards were updated in October 2021 after extensive engagement and public consultation on sex, gender and self-identification. The changes made to the statistical standards reflect the cultural shift in how sex and gender are understood in Canada. This transition is ongoing and constantly evolving.
In this article, the key data source is the CVSB, an administrative survey that compiles information on birth registrations collected by the provinces and territories. The collection and conceptualization of information on gender and sex in administrative data sources vary from jurisdiction to jurisdiction and over time.
Fertility is innately linked to biological processes. The various indicators used in this analysis utilize demographic estimates by age and sex, because at the time of writing of this article, demographic estimates by gender were not available. For ease of reading, the term “women” is used throughout. The terms “mother” and “father” are also used where relevant, reflecting the terminology used in the CVSB.
Methods
Given that birth data for Yukon are unavailable for the years 2017 to 2022, the calculation of various birth and fertility indicators for Canada excludes Yukon.
Nunavut was officially separated from the Northwest Territories on April 1, 1999. Data for Nunavut and the Northwest Territories are presented individually beginning in 1999.
When examining historical trends, the available reference period varies depending on the type of indicator being examined.
Caution should be used when interpreting synthetic indicators such as the total fertility rate. Period fertility measures are particularly sensitive to shifts in the timing of fertility among successive cohorts of women. Increasing levels of postponement of childbearing for each new cohort of women have been a longstanding trend in Canada. In this context, the (synthetic) total fertility rate tends to be substantially lower than the cohort fertility rate for the most recently completed birth cohort of women. Postponement of childbearing does not necessarily lead to lower fertility overall, provided women ultimately make up for those postponed births at older ages. In contrast to the (period) total fertility rate, the cohort fertility rate tends to be much more stable from year to year and has a much clearer interpretation: it simply reflects the number of children that a given cohort of women has had.
This analysis examines various macro-level indicators of fertility and does not permit us to understand specific fertility behaviours of individuals or different population groups (with the exception of age and province or territory of residence). It is expected that the volatile fertility patterns observed at a macro level in recent years likely reflect the interaction of differential behaviours among various subpopulations. Further disaggregation of the characteristics of those who do (and do not) give birth would greatly improve our understanding of fertility dynamics in Canada.
References
Alderotti, G., Vignoli, D., Baccini, M., & Matysiak, A. (2021). Employment Instability and Fertility in Europe: A Meta-Analysis. Demography, 58(3):871-900.
Bailey, M.J., Bart, L., & Wanner Lang, V. (2022). The missing baby bust: The consequences of the COVID-19 pandemic for contraceptive use, pregnancy and childbirth among low-income women. Population Research and Policy Review, 41(4): 1549-1569.
Beaujot, R., Du, C.J., & Ravanera, Z. (2013). Family policies in Quebec and the rest of Canada: Implications for fertility, child-care, women’s paid work and child development indicators. Canadian Public Policy, 39(2): 221-239.
Beaujot, R., & Wang, J. (2010). Low fertility in Canada: The Nordic model in Quebec and the U.S. model in Alberta. Canadian Studies in Population, 37(3-4):411-443.
Bignami, S. (2021). The burden of COVID-19 in Canada. Canadian Studies in Population, 48:123-129.
Billari, F.C., Kohler, H.P., Andersson, G., & Lundstrom, H. (2007). Approaching the limit: Long-term trends in late and very late fertility. Population and Development Review, 33(1):149-170.
Bishop, M.F. (2021). History of Birth Control in Canada. The Canadian Encyclopedia, 29 January 2021, Historica Canada.
Boberg-Fazlic, N., Ivets, M., Karlsson, M., & Nilsson, T. (2021). Disease and fertility: Evidence from the 1918-19 influenza pandemic in Sweden. Economics and Human Biology, 43:101020.
Brauner-Otto, S.R. (2016). Canadian Fertility Trends and Policies: A Story of Regional Variation. P. 99-130 in Rindfuss, R.R., & Choe, M.K. (editors): Low Fertility, Institutions and their Policies, Springer International Publishing.
Canadian Fertility and Andrology Society. (2020a). CFAS Communication on COVID-19 – CFAS COVID-19 Update #1: March 13, 2020.
Canadian Fertility and Andrology Society. (2020b). CFAS Communication on COVID-19 – CFAS COVID-19 Update #5: April 29, 2020.
Comolli, C.L. (2017). The fertility response to the Great Recession in Europe and the United States: Structural and economic conditions and perceived uncertainty. Demographic Research, 36(51): 1549-1600.
Comolli, C.L., & Vignoli, D. (2021). Spreading uncertainty, shrinking birth rates: A natural experiment for Italy. European Sociological Review, 37(4): 555-570.
Comolli, C.K. (2023). Social climate, uncertainty and fertility intentions: from the Great Recession to the COVID-19 crisis. European Journal of Population, 39(35).
Croisetière, P. (2012). Portraits de politiques familiales — Le Québec et treize pays développés. Ministère de la famille du Québec.
Du, S. and Chan, C-H. (2023). Baby boom or baby bust after the COVID-19 onset in the United States? Evidence from an ARIMA time-series analysis. Population and Research Policy Review, 42, 97.
Fostik, A. (2021). COVID-19 and fertility in Canada: a commentary. Canadian Studies in Population, 48: 217-224.
Fostik, A. & Galbraith, N. (2021). Changes in fertility intentions in response to the COVID-19 pandemic. StatCan COVID-19: Data to Insights for a Better Canada. Statistics Canada catalogue no. 48-28-0001.
Horon, I. & Martin, J.A. (2022). Changes in twin births in the United States, 2019-2021. National Vital Statistics Reports, 71(9).
Human Fertility Database. Max Planck Institute for Demographic Research (Germany) and Vienna Institute of Demography (Austria). Available at Human Fertility Database (data downloaded on December 4, 2023).
Human Multiple Births Database (2023). French Institute for Demographic Studies - INED (distributor). Extracted from: Human Multiple Births Database (11/07/2023).
Human Resources and Skills Development Canada. (2005). Summative Evaluation of EI Parental Benefits: Final Report.
Kearney, M.S., & Levine, P. (2023). US Births are down again, after the COVID baby bust and rebound. The Brookings Institution.
Kulkarni, A.D., Jamieson, D.J., Jones, H.W., et al. (2013). Fertility treatments and multiple births in the United States. New England Journal of Medicine, 369: 2218-2225.
Lapierre-Adamcyk, E. (2010). L’évolution de la fécondité et la politique familiale québécoise. Santé, Société et Solidarité, 2: 63-74.
Laplante, B. (2023). La variation des intentions de fécondité au Canada de 1990 à 2017. Conférence du Partenariat Familles en mouvance. Centre UCS – INRS. September 27, 2023. Montréal, Canada.
Lazarov, S., Lazarov, L., & Lazarov, N. (2016). Multiple pregnancy and birth: twins, triplets and high-order multiples. Overview. Trakia Journal of Sciences, 1: 103-107.
Lindberg, L. D., Vandevusse, A., Mueller, J., & Kirstein, M. (2020). Early Impacts of the COVID-19 Pandemic: Findings from the 2020 Guttmacher Survey of Reproductive Health Experiences. Guttmacher Institute, New York.
Lindquist, E. A. (2022). Canada’s Response to the Global Financial Crisis: Pivoting to the Economic Action Plan.P. 457-477 in Lindquist, E.A. (editor) Policy Success in Canada: Cases, Lessons, Challenges. Oxford University Press.
Luppi, F., Arpino, B., & Rosina, A. (2020). The impact of COVID-19 on fertility plans in Italy, Germany, France, Spain, and the United Kingdom. Demographic Research, 43(47): 1399-1412.
Matysiak, A., Sobotka, T., & Vignoli, D. (2021). The Great Recession and fertility in Europe: A subnational analysis. European Journal of Population, 37: 29-64.
Mooi-Reci, I., Trinh, T.-A., Vera-Toscano, E., & Wooden, M. (2023). The impact of lockdowns during the COVID-19 pandemic on fertility intentions. Economics and Human Biology, 48:101214.
Moyser, M., & Milan, A. (2018). Fertility rates and labour force participation among women in Quebec and Ontario. Insights on Canadian Society. Statistics Canada Catalogue no. 75-006-X.
Newman, J.E., Paul, R.C., & Chambers, G.M. (2023). Assisted reproductive technology in Australia and New Zealand, 2021. Sydney: National Perinatal Epidemiology and Statistics Unit, the University of New South Wales, Sydney.
Piotrowski, M.P., Schmitz, W., & Lu, S. (2021). Lowest-Low Fertility. P. 3020-3024 in Gu, D., & Dupre, M.E. (editors) Encyclopedia of Gerontology and Population Aging, Springer Cham.
Pison, G., Torres, C., Monden, C., & Smits, J. (2022). Peaks in twin births? An international comparison of trends in twinning rates in 30 developed countries. International Union for the Scientific Study of Population International Population Conference 2021. Hyderabad, India, December 2021.
Pomar, L., Favre, G., de Labrusse, C., Contier, A., Boulvain, M., & Baud, D. (2022). Impact of the first wave of the COVID-19 pandemic on birth rates in Europe: a time-series analysis in 24 countries. Human Reproduction, 37(12): 2921-2931.
Rose, R. (2010). La politique familiale au Québec : la recherche d’un équilibre entre différents objectifs. Santé, Société et Solidarité, 2: 31-42.
Sobotka, T., Skirbekk, V., & Philipov, D. (2011). Economic recession and fertility in the developed world. Population and Development Review, 37(2): 267-306.
Sobotka, T., Zeman, K., Jasilioniene, A., Winkler-Dworak, M., Brzozowska, Z., Alustiza-Galarza, A., Németh, L., & Jdanov, D. (2023). Pandemic roller-coaster? Birth trends in higher-income countries during the COVID-19 pandemic. Population and Development Review.
Statistics Canada. (2015). The surge of women in the workforce. Canadian Megatrends. Statistics Canada Catalogue no. 11-630-X2015009.
Statistics Canada. (2021). Projections of the Indigenous populations and households in Canada, 2016 to 2041: Overview of data sources, methods, assumptions and scenarios. Statistics Canada Catalogue no. 17-20-0001.
Statistics Canada. (2022). The Daily — “I don’t”: Historic decline in new marriages during the first year of the pandemic.
Statistics Canada. (2023a). Family matters: Disagreements within couples during the COVID-19 pandemic. Statistics Canada Catalogue no. 11-627-M2023003.
Statistics Canada. (2023b). Family Matters: To have kids or not to have kids: That is the question! Statistics Canada Catalogue no. 11-627-M2023006.
Statistics Canada. Table 11-10-0190-01 Market income, government transfers, total income, income tax and after-tax income by economic family type.
Statistics Canada, Table 98-10-0264-01 Indigenous identity by Registered or Treaty Indian status and residence by Indigenous geography: Canada, provinces and territories.
Torres, C., Caporali, A., & Pison, G. (2023). The Human Multiple Births Database (HMBD): An international database on twin and other multiple births. Demographic Research, 48(4): 89-106.
Verma Liao, P., & Dollin, J. (2012). Half a century of the oral contraceptive pill. Canadian Family Physician, 58(12): e757-e760.
Vilain, A., Rey, S., Le Ray, C., Quantin, C., Zeitlin, J., & Fresson, J. (2022). Impact of the COVID-19 pandemic on induced abortions in France in 2020. American Journal of Obstetrics and Gynecology, 22(6): 739-741.
- Date modified: