
Population Projections for Canada (2018 to 2068), Provinces and Territories (2018 to 2043): Technical Report on Methodology and Assumptions
Chapter 4: Projection of Mortality

Archived Content
Information identified as archived is provided for reference, research or recordkeeping purposes. It is not subject to the Government of Canada Web Standards and has not been altered or updated since it was archived. Please "contact us" to request a format other than those available.
by Yu Zhang, Nora Galbraith and Patrice Dion
Skip to text
Text begins
Introduction
Life expectancy at birth is one of the most commonly-used indicators of societal well-being (Mayhew and Smith 2015a; Hiam et al. 2018; Ho and Hendi 2018). The future outlook of this indicator therefore speaks volumes about the general degree of societal optimism for the coming years at the time the projections were made.
Among the components of population growth, mortality is perhaps the most pertinent for the planning of social welfare programs and public expenditures, particularly public pension and healthcare programs. As evidence of this, following a period of substantial slowdown (and one year of reversal) in the trend of life expectancy improvement in the United Kingdom, the Institute and Faculty of Actuaries recently revised its projection of life expectancy downward,Note potentially reducing the pension liabilities estimate for the United Kingdom by billions of pounds.Note
Unlike immigration and fertility—which tend to fluctuate up and down from year to year—life expectancy at birth in Canada has been increasing nearly unabated for both sexes since 1931 (Figure 4.1). From a broader international perspective, annual fluctuations in life expectancy resulting from specific events such as war, epidemic and economic recession have lessened in recent decades (Cardona and Bishai 2018). This near-steady progress in life expectancy would seemingly make the projection of mortality straightforward. However, as noted by Keilman (2018) and Mayhew and Smith (2015), among others, in the past, demographers have tended to underestimate future gains in life expectancy. This tendency is rooted in some cases, in the belief that there is a maximum ‘ceiling’ to the human lifespan (Olshansky et al. 1990)—an assertion that has been, to date, disputed by best-performance life expectancy patterns (Oeppen and Vaupel 2002). Conservatism in mortality projection assumptions also relates to the fact that the pace of life expectancy improvements have slowed considerably since the “golden age of public health”Note during the mid-20th century (Cardona and Bishai 2018). It is also difficult to envision major technological advancements or changes in health systems which could have a fundamental impact on life expectancy (Kontis 2017), and by some accounts, any such developments are likely to have diminishing returns at best in terms of improving future life expectancy (Cardona and Bishai 2018).

Description for Figure 4.1
| Year | Males | Females |
|---|---|---|
| in years | ||
| 1931 | 60.0 | 62.1 |
| 1941 | 63.0 | 66.3 |
| 1951 | 66.3 | 70.8 |
| 1956 | 67.6 | 72.9 |
| 1961 | 68.4 | 74.2 |
| 1966 | 68.8 | 75.2 |
| 1971 | 69.3 | 76.4 |
| 1976 | 70.2 | 77.5 |
| 1981 | 72.0 | 79.1 |
| 1982 | 72.3 | 79.4 |
| 1983 | 72.7 | 79.6 |
| 1984 | 72.9 | 79.7 |
| 1985 | 73.1 | 79.8 |
| 1986 | 73.3 | 79.9 |
| 1987 | 73.5 | 80.1 |
| 1988 | 73.7 | 80.3 |
| 1989 | 73.9 | 80.5 |
| 1990 | 74.3 | 80.7 |
| 1991 | 74.5 | 80.9 |
| 1992 | 74.7 | 80.9 |
| 1993 | 74.8 | 81.0 |
| 1994 | 74.9 | 80.9 |
| 1995 | 75.2 | 81.0 |
| 1996 | 75.4 | 81.1 |
| 1997 | 75.7 | 81.3 |
| 1998 | 76.0 | 81.4 |
| 1999 | 76.3 | 81.6 |
| 2000 | 76.6 | 81.8 |
| 2001 | 76.9 | 81.9 |
| 2002 | 77.1 | 82.0 |
| 2003 | 77.4 | 82.2 |
| 2004 | 77.6 | 82.3 |
| 2005 | 77.9 | 82.6 |
| 2006 | 78.1 | 82.7 |
| 2007 | 78.3 | 82.9 |
| 2008 | 78.5 | 83.0 |
| 2009 | 78.8 | 83.3 |
| 2010 | 79.1 | 83.5 |
| 2011 | 79.4 | 83.6 |
| 2012 | 79.6 | 83.8 |
| 2013 | 79.7 | 83.9 |
| 2014 | 79.8 | 83.9 |
| 2015 | 79.9 | 84.0 |
| 2016 | 79.9 | 84.0 |
|
Notes: Statistics Canada produces life tables for a three-year reference period. For ease of reading, each stated year refers to the middle of the three-year period. For example, "2016" refers to the period 2015 to 2017. The 2017 data are considered preliminary. The calculation for Canada for 2017 excludes Yukon. Sources: From 1931 to 1976: Official life tables from Statistics Canada. From 1980 onward: Statistics Canada. 2019. Life Tables, Canada, Provinces and Territories, catalogue no. 84-537. |
||
In addition to this general uncertainty about how much further human life expectancy can rise, a recent disruption in international mortality trends has further complicated the process of developing mortality assumptions for both the short and long term future. In 2015, many countries experienced a substantial decrease in their life expectancies at birth compared to the previous year, the first incident of such widespread and substantial mortality increase in decades (Jasilionis 2018). This incident, paired with a general slowing of life expectancy improvements since 2011 in most countries, is likely to further encourage conservative tendencies regarding the future outlook of mortality improvements in many countries.
| Country | Males | Females | ||||
|---|---|---|---|---|---|---|
| 2013 ∕ 2014 | 2014 ∕ 2015 | 2015 ∕ 2016 | 2013 ∕ 2014 | 2014 ∕ 2015 | 2015 ∕ 2016 | |
| percent | ||||||
| Australia | 0.25 | 0.12 | 0.00 | 0.12 | 0.12 | 0.12 |
| Austria | 0.64 | -0.38 | 0.63 | 0.24 | -0.36 | 0.48 |
| Belgium | 0.90 | -0.13 | 0.38 | 0.84 | -0.60 | 0.72 |
| Canada | 0.13 | 0.13 | 0.13 | 0.12 | 0.00 | 0.12 |
| Chile | 0.26 | 0.39 | 0.00 | 0.12 | 0.24 | 0.00 |
| Czech Republic | 0.80 | -0.13 | 0.53 | 0.86 | -0.49 | 0.61 |
| Denmark | 0.51 | 0.13 | 0.25 | 0.49 | -0.12 | 0.12 |
| Estonia | -0.55 | 1.10 | 0.14 | 0.24 | 0.37 | 0.00 |
| Finland | 0.51 | 0.38 | -0.13 | 0.00 | 0.36 | 0.00 |
| France | 0.63 | -0.38 | 0.00 | 0.47 | -0.58 | 0.00 |
| Germany | 0.77 | -0.51 | 0.38 | 0.72 | -0.60 | 0.48 |
| Greece | 0.13 | -0.38 | 0.51 | 0.12 | -0.48 | 0.36 |
| Hungary | 0.14 | 0.00 | 0.41 | 0.38 | -0.50 | 0.89 |
| Iceland | 0.99 | -0.12 | -0.99 | 0.96 | -0.83 | 0.36 |
| Ireland | 0.51 | 0.38 | 0.38 | 0.48 | -0.12 | 0.24 |
| Israel | 0.00 | -0.25 | 0.75 | 0.24 | 0.00 | 0.12 |
| Italy | 0.50 | -0.50 | 0.87 | 0.47 | -0.82 | 0.82 |
| Japan | 0.37 | 0.37 | 0.25 | 0.23 | 0.23 | 0.11 |
| Korea | 0.64 | 0.51 | 0.38 | 0.47 | 0.24 | 0.23 |
| Latvia | -0.29 | 0.87 | 0.14 | 0.63 | 0.13 | 0.13 |
| Lithuania | 1.02 | 0.00 | 0.43 | 0.63 | -0.50 | 0.50 |
| Luxembourg | -0.50 | 0.76 | 0.12 | 1.55 | -0.59 | 0.83 |
| Mexico | 0.56 | 0.28 | 0.41 | 0.13 | 0.26 | 0.13 |
| Netherlands | 0.63 | -0.12 | 0.13 | 0.36 | -0.36 | 0.00 |
| New Zealand | 0.25 | 0.25 | 0.13 | 0.12 | 0.12 | 0.00 |
| Norway | 0.38 | 0.50 | 0.25 | 0.48 | 0.00 | 0.00 |
| Poland | 0.96 | -0.27 | 0.54 | 0.62 | -0.12 | 0.49 |
| Portugal | 0.52 | 0.13 | 0.00 | 0.48 | -0.12 | 0.00 |
| Slovak Republic | 0.55 | -0.27 | 0.96 | 0.50 | -0.37 | 0.62 |
| Slovenia | 1.30 | -0.51 | 0.51 | 0.60 | -0.24 | 0.48 |
| Spain | 0.25 | -0.37 | 0.50 | 0.12 | -0.58 | 0.70 |
| Sweden | 0.25 | 0.00 | 0.25 | 0.48 | -0.12 | 0.00 |
| Switzerland | 0.50 | -0.37 | 1.11 | 0.47 | -0.35 | 0.59 |
| Turkey | 0.00 | 0.00 | 0.00 | 0.00 | 0.00 | 0.00 |
| United Kingdom | 0.38 | -0.38 | 0.25 | 0.36 | -0.48 | 0.24 |
| United States | 0.13 | -0.26 | -0.26 | 0.12 | -0.25 | 0.00 |
|
Note: Canada's life expectancy indicators in this table refer to the last year in a three-year reference period. For example, Canada's "2015" life expectancy value in this table refers to the period 2013/2015. Elsewhere in this chapter, Canada's life expectancy periods are indicated by the central year in a 3-year reference period (that is, "2015" refers to the reference period 2014/2016). Source: Author's calculation using data from OECD, https://stats.oecd.org/index.aspx?queryid=24879. |
||||||
In the following section, recent trends in Canadian and international mortality are reviewed with an emphasis on emerging debates and questions regarding future life expectancy trends. For a detailed analysis of the evolution of Canadian mortality by age, sex, region and cause of death from 1921 to 2011, readers are invited to consult Bourbeau and Ouellette (2016). For more recent developments, Shumanty (2018) describes mortality trends in Canada from 2014 to 2016.
Analysis of trends
The international slowdown or reversal in life expectancy trends in 2015
Among 36 OECD countries, the majority experienced either a decrease or no change in their life expectancies at birth for females and males between 2014 and 2015 (Table 4.1). While small decreases in year-to-year life expectancy at birth have been periodically observed in some of these countries in recent decades, the changes observed between 2014 and 2015 were exceptional in terms of how widespread and substantial they were (Ho and Hendi 2018).
In most countries, the 2015 decline in life expectancy was predominantly due to respiratory-disease-related deaths at older ages, linked directly and indirectly to a particularly severe influenza season that year (Jasilionis 2018)—a phenomenon Raleigh (2018) predicts may occur again in 2018 following a long winter flu season. The declines from 2014 to 2015 were generally followed by a gain or stabilization in life expectancy from 2015 to 2016 with the exception of males in the United States and Iceland.
Canada’s relatively positive trend in recent years compared to other countries may reflect to a large extent differences in measurement: Statistics Canada’s official life tables are released annually but calculated using 3 years of data as opposed to a single year, making it less likely that a single atypical year of mortality trends will impact the life expectancy estimate.
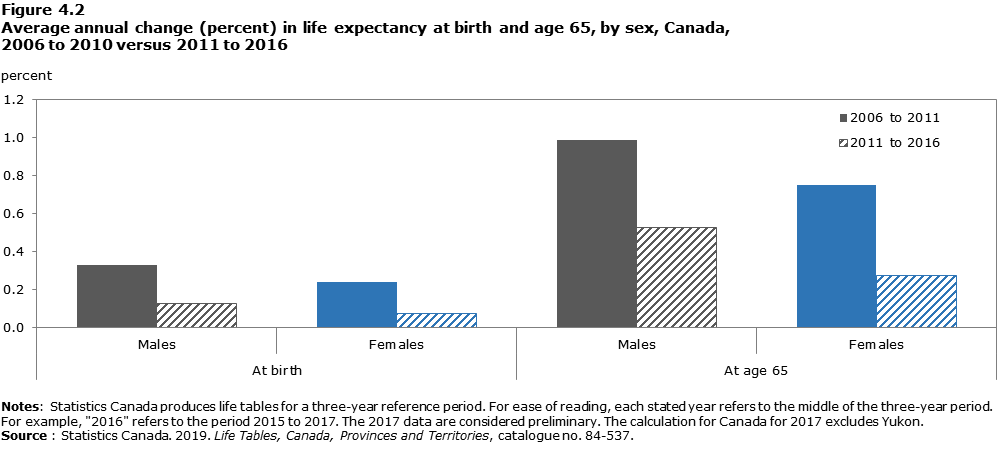
What is apparent is that Canada has experienced a slowdown in life expectancy gains since 2010. This slowdown has occurred for both sexes and whether examined in terms of life expectancy at birth or at age 65 (Figure 4.2). Similar slowdowns in life expectancy improvements, paired with occasional mortality surges concentrated in the older population, have been observed in many countries since 2011 (Office for National Statistics 2018; Hiam et al. 2018; Raleigh 2018). This ‘parallelism’ in life expectancy trends across many high-income countries has been occurring for decades, suggesting that there is no single lifestyle or public health factor driving these patterns (Leon 2011).
Description for Figure 4.2
| Period | At birth | At age 65 | ||
|---|---|---|---|---|
| Males | Females | Males | Females | |
| percent | ||||
| 2006 to 2011 | 0.33 | 0.24 | 0.99 | 0.75 |
| 2011 to 2016 | 0.13 | 0.07 | 0.53 | 0.27 |
|
Notes: Statistics Canada produces life tables for a three-year reference period. For ease of reading, each stated year refers to the middle of the three-year period. For example, "2016" refers to the period 2015 to 2017. The 2017 data are considered preliminary. The calculation for Canada for 2017 excludes Yukon.
Source: Statistics Canada. 2019. Life Tables, Canada, Provinces and Territories, catalogue no. 84-537. |
||||
The near-universal ‘shock’ to mortality trends experienced among high-income countries in 2015 has raised new questions and debates about the future direction of life expectancy in these countries. In the view of Jasilionis (2018), the fact that the advanced health care systems of high income countries were unable to adequately tackle the unanticipated influenza epidemic in 2015 should be carefully considered by projection makers, as it suggests that substantial and perhaps more long-term health crises could occur in the near future. Indeed, Green (2018, page 38) wonders if the world is beginning to transition “from an era of consistently improving population health to a new age characterised by an instability in population health largely dictated by social and political determinants of health”. Yet projection-makers must also attempt to resist “availability bias”—the tendency to give the most weight in their assumption-building process to the most recently-observed trends, ignoring the long-term trend of continual gains in life expectancy (Keilman 2018). The following sections explore some of these debates.
Do the recent slowdowns in life expectancy improvement mean we are approaching the limit of the human lifespan?
While not a new debate, the turnaround in mortality experienced internationally in 2015 has reignited the debate as to the existence of a maximum ‘ceiling’ to human lifespan and whether humanity is quickly approaching it. Dong et al. (2016) suggest the answer to both questions is ‘yes’, given that the age at death of the world’s oldest person has not increased since the 1990s—in their view, likely a result of fixed genetic programs for development and reproduction present in humans. Back in 1990, Olshansky et al. asserted that life expectancy at birth should not exceed 85 years in the absence of major medical breakthroughs which altered the fundamental rate of aging. Yet, despite the absence of such breakthroughs in the decade since, female life expectancy at birth in 2016 equalled or exceeded 85 years in France, Italy, Japan, Korea, Spain and Switzerland.Note
In contrast, many researchers argue that humanity is not approaching a ceiling to life expectancy (Tuljapurkar et al. 2000; Oeppen and Vaupel 2002, 2019; Lenart and Vaupel 2017, Barbi et al. 2018). Following a period of slowdown in its life expectancy improvements, Japan—a world leader in life expectancy—has recently experienced a resurgence in the pace of its life expectancy improvement, seemingly dispelling theories that the country was approaching a limit to human lifespan (Office for National Statistics 2018). This also suggests that countries who have experienced slowdowns in improvement or even reversals in their life expectancy trend can recuperate and continue to make sizeable gains in the future.
Others argue that life expectancy should continue to increase for several decades—particularly in countries with high quality health care systems (Kontis et al. 2017)—but at a much slower pace than what was observed over the 20th century. While new technology progress and health breakthroughs related to advanced-aged conditions are nearly impossible to predict, health care systems have shifted away from a preventative approach in the mid-20th century to a more reactive, treatment-oriented approach, making further gains in life expectancy more difficult to achieve (Cardona and Bishai 2018; Jasilionis 2018).
Could life expectancy decrease in the future for a more sustained period?
The ‘shock’ of 2015’s life expectancy decrease in many countries has raised questions of whether life expectancy could decrease again in the future for a more sustained period. In particular, rising obesity rates and, more recently, deaths associated with drug use and overdose, might lead to decreasing life expectancies in Canada and other countries.
It is difficult to estimate the direct effects of obesity on mortality, and its impact is likely to be more important for healthy (or disability-free) life expectancy as opposed to actual life expectancy (Bourbeau and Ouellette 2016). That said, Preston et al. (2014), in an examination of the United States, conclude that any negative effects on life expectancy resulting from increasing obesity rates will be more than compensated for by simultaneous reductions in smoking. This suggests that in Canada, where obesity rates are considerably lower than in the United States,Note obesity is unlikely to have a substantial impact on the evolution of life expectancy. Yet obesity does appear to have some underlying connection with life expectancy: among OECD countries, several of those having among the lowest six rates of adult obesity in 2016 (Japan, Italy, Switzerland, Sweden, and Norway) were also among the top six countries in terms of life expectancy at birth in the same year.Note
The role of drug use and overdose in excess mortality has become an issue of concern in the United States in particular, who has experienced a growing gap in life expectancy with other high income countries in recent years (Ho and Hendi 2018). Indeed, drug poisoning mortality, mainly related to opioid use, resulted in reduced life expectancy for the non-Hispanic white population in the United States between 2000 and 2014 (Kochanek et al. 2016; Dowell et al. 2017; Hedegaard et al. 2017; Ho and Hendi 2018).
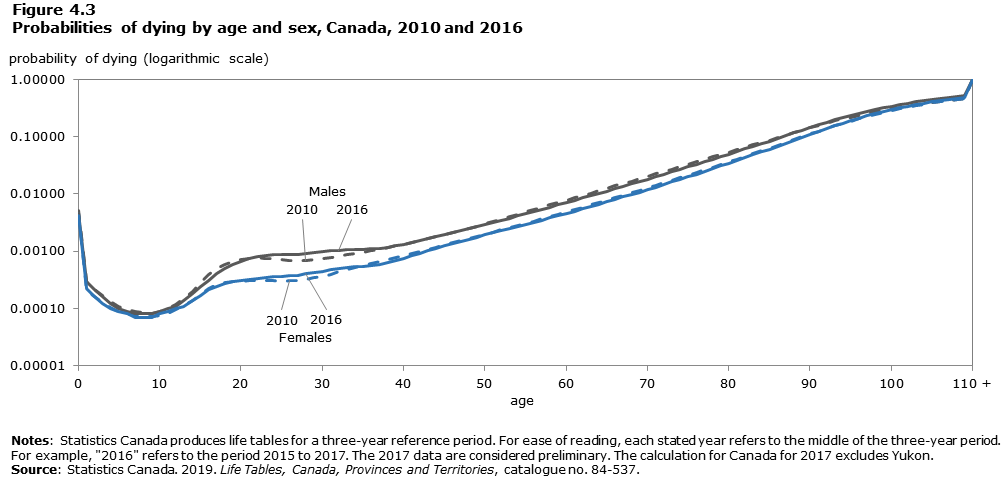
Similar concerns have been raised about the impact of opioid-related deaths on life expectancy in Canada recently (Public Health Agency of Canada 2018). As seen in Figure 4.3, the probability of death among young adults aged 25 to 34 was slightly higher in 2015 than in 2010. Ho and Hendi (2018) find that higher relative levels of drug overdose explained in part the change in Canadian male life expectancy between 2014 and 2015. Opioid-related deaths have also been linked to the decrease in life expectancy in some provinces since 2014 (Ye et al. 2018; Statistics Canada 2019a) and to stagnation of life expectancy at birth between 2016 and 2017 (Statistics Canada 2019a).
Description for Figure 4.3
| Age | 2010 | 2016 | ||
|---|---|---|---|---|
| Males | Females | Males | Females | |
| probability of dying | ||||
| 0 | 0.0052 | 0.0045 | 0.0046 | 0.0042 |
| 1 | 0.0003 | 0.0002 | 0.0003 | 0.0002 |
| 2 | 0.0002 | 0.0002 | 0.0002 | 0.0002 |
| 3 | 0.0002 | 0.0001 | 0.0002 | 0.0001 |
| 4 | 0.0001 | 0.0001 | 0.0001 | 0.0001 |
| 5 | 0.0001 | 0.0001 | 0.0001 | 0.0001 |
| 6 | 0.0001 | 0.0001 | 0.0001 | 0.0001 |
| 7 | 0.0001 | 0.0001 | 0.0001 | 0.0001 |
| 8 | 0.0001 | 0.0001 | 0.0001 | 0.0001 |
| 9 | 0.0001 | 0.0001 | 0.0001 | 0.0001 |
| 10 | 0.0001 | 0.0001 | 0.0001 | 0.0001 |
| 11 | 0.0001 | 0.0001 | 0.0001 | 0.0001 |
| 12 | 0.0001 | 0.0001 | 0.0001 | 0.0001 |
| 13 | 0.0001 | 0.0001 | 0.0001 | 0.0001 |
| 14 | 0.0002 | 0.0001 | 0.0002 | 0.0001 |
| 15 | 0.0003 | 0.0002 | 0.0002 | 0.0002 |
| 16 | 0.0004 | 0.0002 | 0.0003 | 0.0002 |
| 17 | 0.0005 | 0.0003 | 0.0004 | 0.0002 |
| 18 | 0.0006 | 0.0003 | 0.0005 | 0.0003 |
| 19 | 0.0007 | 0.0003 | 0.0006 | 0.0003 |
| 20 | 0.0007 | 0.0003 | 0.0007 | 0.0003 |
| 21 | 0.0007 | 0.0003 | 0.0007 | 0.0003 |
| 22 | 0.0008 | 0.0003 | 0.0008 | 0.0003 |
| 23 | 0.0008 | 0.0003 | 0.0008 | 0.0004 |
| 24 | 0.0007 | 0.0003 | 0.0009 | 0.0004 |
| 25 | 0.0007 | 0.0003 | 0.0009 | 0.0004 |
| 26 | 0.0007 | 0.0003 | 0.0009 | 0.0004 |
| 27 | 0.0007 | 0.0003 | 0.0009 | 0.0004 |
| 28 | 0.0007 | 0.0003 | 0.0009 | 0.0004 |
| 29 | 0.0007 | 0.0003 | 0.0009 | 0.0004 |
| 30 | 0.0007 | 0.0004 | 0.0010 | 0.0004 |
| 31 | 0.0008 | 0.0004 | 0.0010 | 0.0005 |
| 32 | 0.0008 | 0.0004 | 0.0010 | 0.0005 |
| 33 | 0.0009 | 0.0005 | 0.0011 | 0.0005 |
| 34 | 0.0009 | 0.0005 | 0.0011 | 0.0005 |
| 35 | 0.0010 | 0.0006 | 0.0011 | 0.0006 |
| 36 | 0.0010 | 0.0006 | 0.0011 | 0.0006 |
| 37 | 0.0011 | 0.0007 | 0.0011 | 0.0006 |
| 38 | 0.0012 | 0.0007 | 0.0012 | 0.0006 |
| 39 | 0.0012 | 0.0008 | 0.0012 | 0.0007 |
| 40 | 0.0013 | 0.0008 | 0.0013 | 0.0008 |
| 41 | 0.0014 | 0.0009 | 0.0014 | 0.0008 |
| 42 | 0.0015 | 0.0010 | 0.0015 | 0.0009 |
| 43 | 0.0017 | 0.0011 | 0.0017 | 0.0010 |
| 44 | 0.0018 | 0.0012 | 0.0018 | 0.0011 |
| 45 | 0.0019 | 0.0013 | 0.0020 | 0.0012 |
| 46 | 0.0021 | 0.0014 | 0.0021 | 0.0014 |
| 47 | 0.0023 | 0.0015 | 0.0023 | 0.0015 |
| 48 | 0.0025 | 0.0017 | 0.0025 | 0.0016 |
| 49 | 0.0027 | 0.0018 | 0.0027 | 0.0018 |
| 50 | 0.0030 | 0.0020 | 0.0029 | 0.0019 |
| 51 | 0.0033 | 0.0022 | 0.0032 | 0.0021 |
| 52 | 0.0036 | 0.0023 | 0.0035 | 0.0023 |
| 53 | 0.0040 | 0.0026 | 0.0038 | 0.0025 |
| 54 | 0.0044 | 0.0028 | 0.0042 | 0.0027 |
| 55 | 0.0048 | 0.0031 | 0.0045 | 0.0029 |
| 56 | 0.0053 | 0.0034 | 0.0049 | 0.0032 |
| 57 | 0.0059 | 0.0037 | 0.0054 | 0.0035 |
| 58 | 0.0064 | 0.0040 | 0.0059 | 0.0038 |
| 59 | 0.0071 | 0.0044 | 0.0065 | 0.0042 |
| 60 | 0.0078 | 0.0049 | 0.0071 | 0.0046 |
| 61 | 0.0086 | 0.0053 | 0.0078 | 0.0050 |
| 62 | 0.0095 | 0.0059 | 0.0085 | 0.0055 |
| 63 | 0.0104 | 0.0064 | 0.0093 | 0.0060 |
| 64 | 0.0114 | 0.0071 | 0.0103 | 0.0066 |
| 65 | 0.0126 | 0.0078 | 0.0113 | 0.0073 |
| 66 | 0.0139 | 0.0086 | 0.0124 | 0.0081 |
| 67 | 0.0153 | 0.0095 | 0.0136 | 0.0089 |
| 68 | 0.0168 | 0.0105 | 0.0150 | 0.0098 |
| 69 | 0.0185 | 0.0116 | 0.0165 | 0.0108 |
| 70 | 0.0204 | 0.0128 | 0.0182 | 0.0120 |
| 71 | 0.0225 | 0.0142 | 0.0201 | 0.0132 |
| 72 | 0.0247 | 0.0157 | 0.0222 | 0.0147 |
| 73 | 0.0273 | 0.0174 | 0.0245 | 0.0163 |
| 74 | 0.0300 | 0.0193 | 0.0270 | 0.0181 |
| 75 | 0.0331 | 0.0215 | 0.0299 | 0.0201 |
| 76 | 0.0365 | 0.0238 | 0.0331 | 0.0223 |
| 77 | 0.0402 | 0.0265 | 0.0366 | 0.0249 |
| 78 | 0.0443 | 0.0295 | 0.0405 | 0.0277 |
| 79 | 0.0488 | 0.0328 | 0.0449 | 0.0309 |
| 80 | 0.0538 | 0.0365 | 0.0498 | 0.0345 |
| 81 | 0.0593 | 0.0407 | 0.0553 | 0.0386 |
| 82 | 0.0654 | 0.0454 | 0.0614 | 0.0432 |
| 83 | 0.0722 | 0.0507 | 0.0682 | 0.0483 |
| 84 | 0.0796 | 0.0567 | 0.0758 | 0.0542 |
| 85 | 0.0878 | 0.0634 | 0.0843 | 0.0608 |
| 86 | 0.0968 | 0.0709 | 0.0939 | 0.0683 |
| 87 | 0.1068 | 0.0794 | 0.1045 | 0.0768 |
| 88 | 0.1178 | 0.0890 | 0.1165 | 0.0864 |
| 89 | 0.1300 | 0.0998 | 0.1299 | 0.0973 |
| 90 | 0.1434 | 0.1120 | 0.1450 | 0.1098 |
| 91 | 0.1579 | 0.1254 | 0.1615 | 0.1235 |
| 92 | 0.1733 | 0.1399 | 0.1790 | 0.1385 |
| 93 | 0.1893 | 0.1554 | 0.1976 | 0.1545 |
| 94 | 0.2060 | 0.1719 | 0.2170 | 0.1717 |
| 95 | 0.2184 | 0.1885 | 0.2375 | 0.1913 |
| 96 | 0.2354 | 0.2065 | 0.2580 | 0.2106 |
| 97 | 0.2529 | 0.2255 | 0.2792 | 0.2310 |
| 98 | 0.2709 | 0.2453 | 0.3008 | 0.2522 |
| 99 | 0.2893 | 0.2657 | 0.3227 | 0.2742 |
| 100 | 0.3080 | 0.2867 | 0.3447 | 0.2967 |
| 101 | 0.3269 | 0.3081 | 0.3665 | 0.3196 |
| 102 | 0.3458 | 0.3297 | 0.3881 | 0.3426 |
| 103 | 0.3646 | 0.3513 | 0.4093 | 0.3655 |
| 104 | 0.3832 | 0.3728 | 0.4298 | 0.3881 |
| 105 | 0.4015 | 0.3940 | 0.4495 | 0.4102 |
| 106 | 0.4194 | 0.4146 | 0.4684 | 0.4316 |
| 107 | 0.4367 | 0.4346 | 0.4863 | 0.4521 |
| 108 | 0.4535 | 0.4539 | 0.5031 | 0.4717 |
| 109 | 0.4696 | 0.4722 | 0.5188 | 0.4902 |
| 110 + | 1.0000 | 1.0000 | 1.0000 | 1.0000 |
|
Notes: Statistics Canada produces life tables for a three-year reference period. For ease of reading, each stated year refers to the middle of the three-year period. For example, "2016" refers to the period 2015 to 2017. The 2017 data are considered preliminary. The calculation for Canada for 2017 excludes Yukon. Source: Statistics Canada. 2019. Life Tables, Canada, Provinces and Territories, catalogue no. 84-537. |
||||
Jasilionis (2018) and Ho and Hendi (2018) note that growing societal inequality can lead to decreases in life expectancy due to the rise of so-called “deaths of despair” (suicides, accidents and drug overdose). Being the only OECD country without universal health care coverage and high and rising health inequalities, the United States is often given as an example of a country that could experience declining life expectancy in the future due to rising social inequality (Kontis 2017).
Concerns about the impact of growing societal inequality on life expectancy have also been raised in the United Kingdom recently (Bennett et al. 2015; Hiam et al. 2018; Raleigh 2018). Hiam et al. (2018) find that inequalities in life expectancy between local U.K. authorities have widened since 2010, and point to the austerity measures introduced during the period as a possible explanatory factor. Austerity measures have been found to have an overall negative impact on population health in Europe (Green 2018). However, as noted by Raleigh (2018), the slowdown in life expectancy improvements has occurred in numerous countries who did not put similar austerity measures into place, whereas the slowdowns in countries such as Greece, Spain and Portugal – whom implemented more severe austerity measures – were less than that of the United Kingdom over the same period.
In Canada, the inequality gap in life expectancy by socioeconomic status is smaller than that of most other high income countries, but there remains a large gap between the life expectancy of First Nations, Inuit and Métis Peoples and the total population (Public Health Agency of Canada 2018). This health inequality becomes apparent when examining differences in the infant mortality rate and life expectancy at birth of Nunavut (where the vast majority of the population is Inuit) and Canada’s other provinces and territories (Figures 4.4 and 4.5). In recent years, the relative ranking, as well as the gap between the lowest and highest life expectancy among the provinces and territories, have been quite stable.

Description for Figure 4.4
| Region | 2010 | 2016 |
|---|---|---|
| per thousand live births | ||
| Canada | 4.9 | 4.4 |
| N.L. | 5.8 | 4.3 |
| P.E.I. | 3.7 | 3.9 |
| N.S. | 4.3 | 4.2 |
| N.B. | 4.2 | 3.9 |
| Que. | 4.6 | 4.3 |
| Ont. | 4.9 | 4.4 |
| Man. | 6.9 | 6.2 |
| Sask. | 6.5 | 5.9 |
| Alta. | 5.5 | 4.5 |
| B.C. | 3.7 | 3.3 |
| Y.T. | 4.2 | Note ..: not available for a specific reference period |
| N.W.T. | 8.0 | 5.7 |
| Nvt. | 19.2 | 13.1 |
|
.. not available for a specific reference period Notes: Statistics Canada produces life tables for a three-year reference period. For ease of reading, each stated year refers to the middle of the three-year period. For example, "2016" refers to the period 2015 to 2017. At the time of release, death data for 2017 were not available for Yukon; therefore the infant mortality rate for Yukon for 2016 (2015/2017) could not be calculated. The 2017 data are considered preliminary. Source: Statistics Canada. 2019. Life Tables, Canada, Provinces and Territories, catalogue no. 84-537. |
||

Description for Figure 4.5
| Region | 2010 | 2016 |
|---|---|---|
| in years | ||
| Canada | 81.4 | 82.0 |
| N.L. | 79.6 | 79.6 |
| P.E.I. | 80.6 | 82.0 |
| N.S. | 80.2 | 80.4 |
| N.B. | 80.6 | 80.7 |
| Que. | 81.5 | 82.5 |
| Ont. | 81.8 | 82.5 |
| Man. | 79.7 | 80.0 |
| Sask. | 79.6 | 80.2 |
| Alta. | 81.1 | 81.5 |
| B.C. | 82.1 | 82.3 |
| Y.T. | 78.0 | Note ...: not applicable |
| N.W.T. | 77.6 | 77.1 |
| Nvt. | 71.3 | 72.1 |
|
... not applicable Notes: Statistics Canada produces life tables for a three-year reference period. For ease of reading, each stated year refers to the middle of the three-year period. For example, "2016" refers to the period 2015 to 2017. At the time of release, death data for 2017 were not available for Yukon; therefore life expectancy for Yukon for 2016 (2015/2017) could not be calculated. The 2017 data are considered preliminary. Source: Statistics Canada. 2019. Life Tables, Canada, Provinces and Territories, catalogue no. 84-537. |
||
How much further could the gap in female and male life expectancy close in the future?
Beyond differences in mortality by region and socioeconomic characteristics, the gap in life expectancy between the sexes has been a longstanding pattern in Canada and other countries. Following its peak in 1978 (7.4 years), the Canadian female advantage in life expectancy at birth over males decreased fairly steadily in subsequent years—though it has held constant at 4.1 years since 2014 (Figure 4.6). This decrease in the gender life expectancy gap has been attributed mainly to the fact that female lifestyle and behaviours have become more similar to those of men (Bourbeau and Ouellette 2016), a pattern observed in many countries (Mayhew and Smith 2015).

Description for Figure 4.6
| Year | Difference |
|---|---|
| in years | |
| 1945 | 3.5 |
| 1946 | 3.6 |
| 1947 | 4.1 |
| 1948 | 4.1 |
| 1949 | 4.2 |
| 1950 | 4.4 |
| 1951 | 4.4 |
| 1952 | 5.1 |
| 1953 | 5.1 |
| 1954 | 5.1 |
| 1955 | 5.4 |
| 1956 | 5.3 |
| 1957 | 5.7 |
| 1958 | 5.8 |
| 1959 | 5.7 |
| 1960 | 5.9 |
| 1961 | 6.1 |
| 1962 | 6.0 |
| 1963 | 6.1 |
| 1964 | 6.5 |
| 1965 | 6.4 |
| 1966 | 6.6 |
| 1967 | 6.7 |
| 1968 | 6.7 |
| 1969 | 6.8 |
| 1970 | 6.9 |
| 1971 | 7.0 |
| 1972 | 7.1 |
| 1973 | 7.2 |
| 1974 | 7.2 |
| 1975 | 7.2 |
| 1976 | 7.3 |
| 1977 | 7.3 |
| 1978 | 7.4 |
| 1979 | 7.3 |
| 1980 | 7.1 |
| 1981 | 7.1 |
| 1982 | 7.1 |
| 1983 | 6.9 |
| 1984 | 6.8 |
| 1985 | 6.7 |
| 1986 | 6.7 |
| 1987 | 6.6 |
| 1988 | 6.6 |
| 1989 | 6.6 |
| 1990 | 6.4 |
| 1991 | 6.4 |
| 1992 | 6.2 |
| 1993 | 6.2 |
| 1994 | 6.0 |
| 1995 | 5.9 |
| 1996 | 5.7 |
| 1997 | 5.6 |
| 1998 | 5.4 |
| 1999 | 5.3 |
| 2000 | 5.2 |
| 2001 | 5.0 |
| 2002 | 4.9 |
| 2003 | 4.8 |
| 2004 | 4.7 |
| 2005 | 4.7 |
| 2006 | 4.6 |
| 2007 | 4.6 |
| 2008 | 4.5 |
| 2009 | 4.5 |
| 2010 | 4.4 |
| 2011 | 4.3 |
| 2012 | 4.2 |
| 2013 | 4.2 |
| 2014 | 4.1 |
| 2015 | 4.1 |
| 2016 | 4.1 |
|
Notes: Statistics Canada produces life tables for a three-year reference period. For ease of reading, each stated year refers to the middle of the three-year period. For example, "2016" refers to the period 2015 to 2017. The 2017 data are considered preliminary. The calculation for Canada for 2017 excludes Yukon. Sources: From 1945 to 1980: Annual life tables from the Canadian Human Mortality Database. From 1981 to 2016: Statistics Canada. 2019. Life Tables, Canada, Provinces and Territories, catalogue no. 84-537. |
|
The female longevity advantage has been found to be rooted in several phenomenon, including biological, behavioural and environmental differences between men and women (Ortiz-Ospina and Beltekien 2018). However, some researchers argue that current gender differences in life expectancy from external causes and conditions such as cardiovascular disease could be minimized in the future, meaning that the female life expectancy advantage could close considerably (Bennett et al. 2015; Kontis et al. 2017). Critics of these assertions insist that the biological longevity advantage of females could not be altered to such a degree (Peters et al. 2015). To support the idea of the female biological life expectancy advantage, the mortality-morbidity paradox of “men die, women get sick”—in other words, women have lower mortality rates than men throughout their life, but women experience higher rates of physical illness, hospital stays and doctor visits than men—is often raised (Verbrugge and Wingward 1987; Kulminski et al. 2008). Conversely, this paradox may reflect societal gendered norms and not simply biological differences in robustness (Singh-Manoux et al. 2008; Ortiz-Ospina and Beltekian 2018).
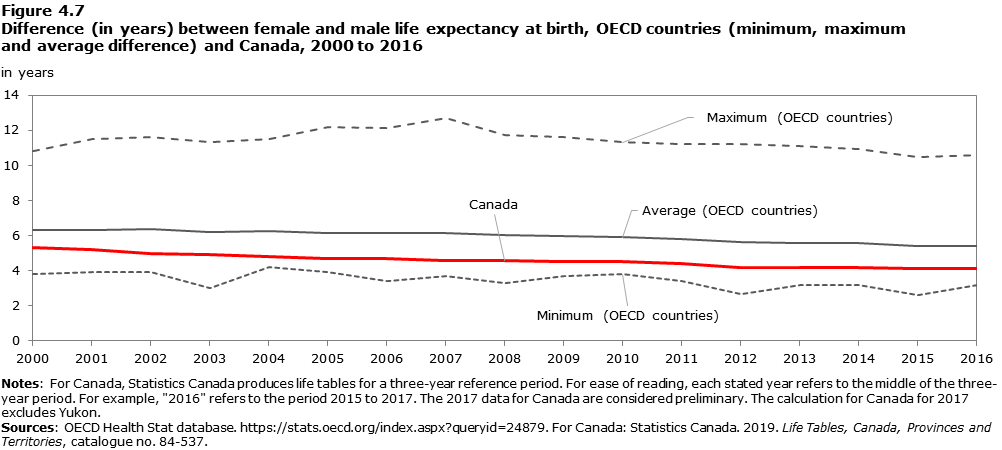
The importance of non-biological factors in the gender gap in life expectancy becomes clear when the gap is compared across countries (Figure 4.7). Among all OECD countries, female life expectancy at birth has consistently been higher than that of males since 2000. However, there is large variation in the magnitude of the gender gap: in 2015, the gap ranged from a difference as small as 2.6 years (Iceland) to as large as 10.5 years (Lithuania). Both Canada and the OECD average life expectancy gap by sex has slowly but steadily diminished since 2000, with Canada’s gap being 4.1 years in 2015, less than the OECD average of 5.4 years that year. In their recent probabilistic projections which take into account uncertainty related to the choice of forecasting model,Note Kontis et al. (2017) estimate that the female life expectancy advantage in Canada will close to approximately 3.1 years by 2030.
Description for Figure 4.7
| Year | OECD countries | Canada | ||
|---|---|---|---|---|
| Minimum | Maximum | Average | ||
| in years | ||||
| 2000 | 3.8 | 10.8 | 6.3 | 5.3 |
| 2001 | 3.9 | 11.5 | 6.3 | 5.2 |
| 2002 | 3.9 | 11.6 | 6.4 | 5.0 |
| 2003 | 3.0 | 11.3 | 6.2 | 4.9 |
| 2004 | 4.2 | 11.5 | 6.2 | 4.8 |
| 2005 | 3.9 | 12.2 | 6.2 | 4.7 |
| 2006 | 3.4 | 12.1 | 6.1 | 4.7 |
| 2007 | 3.7 | 12.7 | 6.1 | 4.6 |
| 2008 | 3.3 | 11.7 | 6.0 | 4.6 |
| 2009 | 3.7 | 11.6 | 6.0 | 4.5 |
| 2010 | 3.8 | 11.3 | 5.9 | 4.5 |
| 2011 | 3.4 | 11.2 | 5.8 | 4.4 |
| 2012 | 2.7 | 11.2 | 5.6 | 4.2 |
| 2013 | 3.2 | 11.1 | 5.6 | 4.2 |
| 2014 | 3.2 | 10.9 | 5.6 | 4.2 |
| 2015 | 2.6 | 10.5 | 5.4 | 4.1 |
| 2016 | 3.2 | 10.6 | 5.4 | 4.1 |
|
Notes: For Canada, Statistics Canada produces life tables for a three-year reference period. For ease of reading, each stated year refers to the middle of the three-year period. For example, "2016" refers to the period 2015 to 2017. The 2017 data for Canada are considered preliminary. The calculation for Canada for 2017 excludes Yukon. Sources: OECD Health Stat database. https://stats.oecd.org/index.aspx?queryid=24879 . For Canada: Statistics Canada. 2019. Life Tables, Canada, Provinces and Territories, catalogue no. 84-537. |
||||
Results of the 2018 Survey of Experts on Future Demographic Trends
In total, 10 Canadian demography experts provided their views on the future evolution of mortality in Canada.Note Experts were first asked to describe the arguments, trends, theories or possibilities they considered when formulating their views about the probable distribution of the life expectancy at birth of males and females in Canada in 2043 (25 years from the time of the survey). Many experts noted the very long-term stable trend of continued increases in life expectancy at birth in Canada, and some suggested that for this reason, the use of time series models might be better suited over expert opinion for the projection of mortality specifically. The most frequently-mentioned opinion expressed by the experts was that life expectancy was expected to continue to increase but at a slower pace in the coming decades, as has been the trend in recent decades.
In terms of factors which could push life expectancy to increase at a faster pace in the coming years, technological medical advancements or breakthroughs were frequently mentioned, along with a shift in the medical focus to preventive care, healthier lifestyles (including reduction in smoking behaviour) and safer working conditions.
In contrast to the positive trends above, experts described numerous factors which could have a negative impact on life expectancy in the future, including: the opioid crisis, rising obesity rates, climate change, unforeseen catastrophes, the recent legalization of cannabis, and the legalization of medically-assisted death.
Regarding differences in life expectancy between the sexes, the experts appeared to unanimously envision continued convergence in the life expectancy of males and females in the future.
Following their qualitative arguments, experts were asked to communicate their views about the likely evolution of the life expectancy at birth of males and females in Canada in 2043 quantitatively; that is, by building a probability distribution that exemplified their opinion, and level of uncertainty, regarding what values life expectancy at birth could take in 25 years. More specifically, each expert was asked to provide the following parameters (for males and females, separately):
- Lower and upper bounds of a range covering nearly all plausible values of life expectancy at birth in Canada in 2043;
- Their level of confidence (expressed in percent, with a minimum of 90% imposed) that the range specified in Step (a) will contain the true value of life expectancy at birth in 2043;
- The median value of the plausible range provided in Step (a), such that they expect an equal (50-50) chance that the true value of life expectancy at birth lies above or below the median;
- Probabilities that life expectancy at birth in 2043 will fall below and above the mid-points between:
- the lower bound of the plausible range provided in Step (a) and the median provided in Step (c); and
- the median provided in Step (c) and the upper bound of the plausible range provided in Step (a).Note
Using these parameters, a visual representation of the resulting probability distribution was displayed to the experts using Keelin’s (2016; 2018) metalog algorithm, and the expert was then encouraged to modify their inputs until they arrived at a satisfactory representation of their beliefs. The individual probability distributions of the 10 experts regarding their views about the probable life expectancy at birth of males and females in Canada in 2043 are displayed in Figure 4.8 (grey lines).

Description for Figure 4.8a
This line graph shows the individual probability distributions (grey lines) and aggregate mixture distribution (red line) of life expectancy at birth of males in Canada in 2043 according to the respondents of the 2018 Survey of Experts on Future Demographic Trends. The horizontal axis plots life expectancy at birth in years. The vertical axis plots the probability density.
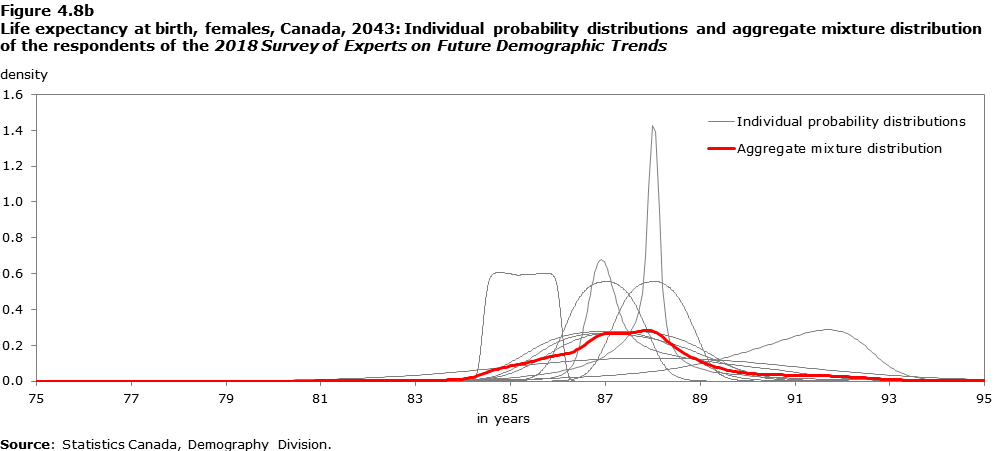
Description for Figure 4.8b
This line graph shows the individual probability distributions (grey lines) and aggregate mixture distribution (red line) of life expectancy at birth of females in Canada in 2043 according to the respondents of the 2018 Survey of Experts on Future Demographic Trends. The horizontal axis plots life expectancy at birth in years. The vertical axis plots the probability density.
The individual probability distributions of the 10 experts were aggregated via a mixture distribution,Note the results of which are shown in the red line of Figure 4.8. For females, this aggregation resulted in a bimodal probability distribution (one peak around 87.2 years and the other at 87.9 years), with a median life expectancy at birth of 87.5 years, and the 10th and 90th percentiles of the distribution represented by 85.4 years and 89.9 years, respectively.
For males, the aggregate probability distribution was left skewed, with a median of 85.3 years, and the 10th and 90th percentiles of the distribution represented by 82.6 years and 87.1 years, respectively.
Taken together, the median estimates for each sex would imply a gap of 2.2 years in the life expectancy at birth of females and males—nearly half its current level (4.1 years in 2016).
Methodology
Overview
As a key part of the population projection, mortality is projected through an extrapolation process. The model was fitted using averaged life table data from 1981 to 2016.Note As in the previous edition, the Li-Lee (2005) adaptation of the Lee-Carter (1992) method for coherent projections was used, but extended it to integrate three components: total population, population by sex, and population by sex and province/territory. These changes were made to obtain coherent results among both the sexes and the provinces/territories.
Inputs for the model are age specific death rates by province and territory, derived from the life tables recently published by Statistics Canada (2019a). Annual death rates from these life tables were computed using three-year averages, and are smoothed using splines. At old ages, death rates are extrapolated using the Kannisto method (Statistics Canada 2019b). Those methods increase the robustness of the mortality trends while also addressing the issues encountered for regions with smaller death or population counts. For the three territories and Prince Edward Island, where there was only abridged life tables available, the age specific death rates were produced using the national age structure as a standard. For Yukon, missing data for year 2017 were imputed based on the trend of change in mortality from 2014 to 2016.
Coherent Projection Methods
When projecting the mortality rates independently for groups (i.e., sex, region) of the population, the projected trends for each group tends to diverge indefinitely over time. However, it is likely that the forces influencing mortality (such as technology evolution, pollution, etc.) are affecting all groups in a similar way. This is supported by the fact that there has not been strong evidence of mortality divergence among different sexes and regions in the past. For this reason, coherent mortality projection methods were used to limit the degree of divergence among the regions and between the sexes.
The Li-Lee method provides a means to forecast coherently across groups while retaining the simplicity and robustness of the Lee-Carter method (Lee and Miller 2001; Booth 2006). In our extended model, an extra component has been added to allow coherent projection not only between the sexes, but also among each different combination of sex and region.
Estimation of parameters
In the new method, the log of age-specific mortality rates is calculated as: where x, t, s, i, represents the age, time, sex, and region factor, respectively. While is the group specific mortality rate, is representing the average of over all the years, represents the common factor applied to all sexes and regions, is the sex specific factor applied to all regions, represents the sex-region specific factor for each sex and region combination, and is the random variance term. Note that the log transformation prevents getting negative mortality values.
To quantify the changes in death rate, each modelling component was decomposed into an age pattern, , and a time pattern, , using singular value decomposition (SVD). This dimensionality reduction technique was used to obtain the first-order vectors and with the constraints that would ensure the uniqueness of the solution: the sum of all age-specific coefficients must equal to one, and the sum of all time-specific coefficients must equal to zero.
The national level factor, , was first obtained by decomposing a data matrix in which each element is the difference of the log of the observed age-specific mortality rates, and the average of these (log) rates over the period, , using SVD. This is the common factor to each combination of sex and region. A sex-specific factor, , was subsequently computed through decomposition of the residuals of the model containing the national factor only, calculated by . The resulting matrix contains only these variations that have not yet been captured by the overall national factor. Similarly, a sex- and region- specific factor,, was obtained by decomposition of the residuals matrix after subtracting the estimated effects in the model for both the overall national factor and the sex-specific factor.
At each level, national, sex-specific, and sex-region specific, the resulting time varying factor were adjusted through an iteration process so that, for each year, the modelled life expectancy match those observed. The gaps are mainly due to the model fitting the logs of death rates rather than the death rates themselves. It is those adjusted time factor that are used for estimation in the subsequent step.
Forecast of the time factors
To forecast future mortality rates, the were extrapolated using a time series model. At the national level, the time pattern is a predictable highly linear series. A Random Walk with Drift (RWD) was used to predict future values. It is calculated as:
where d represents the deterministic drift term reflecting the time trend, is the random walk term, and is a stochastic component representing the standard deviation for the random changes of . Thus, the projection of the age-specific mortality rates at the overall Canada level is calculated as:
Sex-specific factors , and factors for each combination of sex and region, , were forecast using first order auto-regressive time series (AR1) models:
and
In the equation, and are model-specific means and slope coefficients specific to each group, and is the standard deviation. The model allows the sex and sex-region effects to eventually converge to a fixed mean (Li and Lee 2005). So, while the trend projected by the common factor continually evolves over the course of the projection, the specific factors eventually reach a constant level. As a result, those group-specific factors, creating distinct patterns for the mortality trend in each group, would become weaker and weaker over time, yielding a coherent projection among sexes and regions (over time, the projection for each combination of sex and region tends to reflect a common path). Thus, despite the high uncertainty surrounding future mortality levels, the coherent projection method provides a way to project a plausible portrait of anticipated differences in mortality between the sexes and between the provinces and territories in the long-term future.
Adjustments to the age patterns
Adjustments at old ages
As a possible artifact of the life table modelling procedure for old ages, the resulting from the model often yield negative values for ages 90 and over. This could change the shape of the mortality curve and cause old age mortality in the later years of the projection to be higher than those from earlier years in the projection. For this reason, an alternative series of was computed using an exponential approximation of the original (starting at age 80 and over), thus ensuring that all values are positive and converging towards zero as age increases. The starting age for applying this modified to replace the original one was determined based on the distance between the original and the modified value to minimize the gap created. By preventing negative values in , the modified age pattern avoids any cross-over for old age mortalities over the course of the projection.
Rotation of age patterns
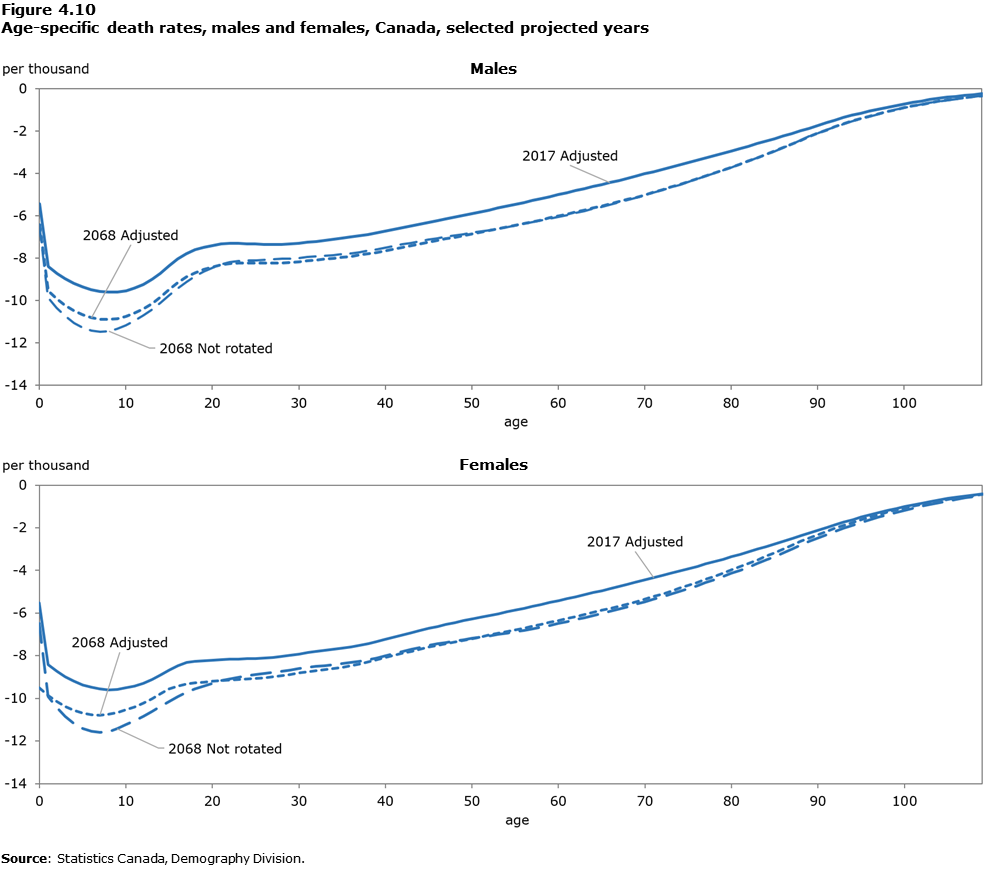
Age-specific rates of mortality decline have been evolving over the last several decades, accelerating at older ages and slowing down at younger ages. However, it is challenging to forecast those changes - consisting of second-order differences - without strong empirical basis. In this context, Li et al. (2013) suggested as a simple prior for the future age schedule of mortality is that it should remain U-shaped. They support this assumption noting that this shape has been persistent over time, holding even in the face of large reductions in infectious diseases, and that it must be influenced by enduring evolutionary forces supporting reproductive fitness. These forces would explain, for example, why survival is relatively high at ages of sexual maturity and at ages where adults can contribute to the reproductive success of adult children. Thus, Li et al. (2013) suggested a “rotational” model of that gradually reaches a smoother shape over time. After performing the rotation, the new ultimate become flatter and contain less and less information on age heterogeneity, as uncertainty increases. Finally, the values were iterated to ensure that the newly projected life expectancy remains the same as those before the rotation. Figure 4.9 contrasts, at Canada level, the ultimate age pattern of change, adjusted for old ages and then rotated based on methodologies from Li et al. (2013), with the original age pattern estimated from SVD.

Description for Figure 4.9
| Age | Original Beta | Ultimate Beta |
|---|---|---|
| beta | ||
| 0 | 0.01081 | 0.01126 |
| 1 | 0.01637 | 0.01126 |
| 2 | 0.01833 | 0.01126 |
| 3 | 0.01985 | 0.01126 |
| 4 | 0.02092 | 0.01126 |
| 5 | 0.02154 | 0.01126 |
| 6 | 0.02171 | 0.01126 |
| 7 | 0.02144 | 0.01126 |
| 8 | 0.02072 | 0.01126 |
| 9 | 0.01955 | 0.01126 |
| 10 | 0.01829 | 0.01126 |
| 11 | 0.01726 | 0.01126 |
| 12 | 0.01648 | 0.01126 |
| 13 | 0.01595 | 0.01126 |
| 14 | 0.01566 | 0.01126 |
| 15 | 0.01561 | 0.01126 |
| 16 | 0.01548 | 0.01126 |
| 17 | 0.01493 | 0.01126 |
| 18 | 0.01395 | 0.01126 |
| 19 | 0.01282 | 0.01126 |
| 20 | 0.01182 | 0.01126 |
| 21 | 0.01093 | 0.01126 |
| 22 | 0.01017 | 0.01126 |
| 23 | 0.00952 | 0.01126 |
| 24 | 0.00899 | 0.01126 |
| 25 | 0.00858 | 0.01126 |
| 26 | 0.00825 | 0.01126 |
| 27 | 0.00802 | 0.01126 |
| 28 | 0.00789 | 0.01126 |
| 29 | 0.00786 | 0.01126 |
| 30 | 0.00791 | 0.01126 |
| 31 | 0.00802 | 0.01126 |
| 32 | 0.00812 | 0.01126 |
| 33 | 0.00822 | 0.01126 |
| 34 | 0.00832 | 0.01126 |
| 35 | 0.00842 | 0.01126 |
| 36 | 0.00851 | 0.01126 |
| 37 | 0.00858 | 0.01126 |
| 38 | 0.00864 | 0.01126 |
| 39 | 0.00868 | 0.01126 |
| 40 | 0.00870 | 0.01126 |
| 41 | 0.00873 | 0.01126 |
| 42 | 0.00879 | 0.01126 |
| 43 | 0.00887 | 0.01126 |
| 44 | 0.00897 | 0.01126 |
| 45 | 0.00910 | 0.01126 |
| 46 | 0.00926 | 0.01126 |
| 47 | 0.00944 | 0.01126 |
| 48 | 0.00965 | 0.01126 |
| 49 | 0.00988 | 0.01126 |
| 50 | 0.01014 | 0.01126 |
| 51 | 0.01040 | 0.01126 |
| 52 | 0.01064 | 0.01126 |
| 53 | 0.01086 | 0.01126 |
| 54 | 0.01105 | 0.01126 |
| 55 | 0.01123 | 0.01126 |
| 56 | 0.01138 | 0.01126 |
| 57 | 0.01151 | 0.01126 |
| 58 | 0.01162 | 0.01126 |
| 59 | 0.01171 | 0.01126 |
| 60 | 0.01178 | 0.01126 |
| 61 | 0.01183 | 0.01126 |
| 62 | 0.01185 | 0.01126 |
| 63 | 0.01186 | 0.01126 |
| 64 | 0.01184 | 0.01126 |
| 65 | 0.01180 | 0.01126 |
| 66 | 0.01175 | 0.01126 |
| 67 | 0.01167 | 0.01126 |
| 68 | 0.01156 | 0.01126 |
| 69 | 0.01144 | 0.01126 |
| 70 | 0.01130 | 0.01126 |
| 71 | 0.01113 | 0.01110 |
| 72 | 0.01095 | 0.01091 |
| 73 | 0.01074 | 0.01071 |
| 74 | 0.01051 | 0.01048 |
| 75 | 0.01026 | 0.01023 |
| 76 | 0.00999 | 0.00996 |
| 77 | 0.00970 | 0.00967 |
| 78 | 0.00939 | 0.00936 |
| 79 | 0.00905 | 0.00902 |
| 80 | 0.00870 | 0.00867 |
| 81 | 0.00832 | 0.00829 |
| 82 | 0.00792 | 0.00789 |
| 83 | 0.00749 | 0.00747 |
| 84 | 0.00705 | 0.00702 |
| 85 | 0.00658 | 0.00656 |
| 86 | 0.00608 | 0.00606 |
| 87 | 0.00556 | 0.00555 |
| 88 | 0.00502 | 0.00500 |
| 89 | 0.00445 | 0.00435 |
| 90 | 0.00385 | 0.00401 |
| 91 | 0.00325 | 0.00370 |
| 92 | 0.00267 | 0.00341 |
| 93 | 0.00212 | 0.00314 |
| 94 | 0.00159 | 0.00289 |
| 95 | 0.00077 | 0.00267 |
| 96 | 0.00030 | 0.00246 |
| 97 | -0.00015 | 0.00227 |
| 98 | -0.00056 | 0.00209 |
| 99 | -0.00094 | 0.00193 |
| 100 | -0.00129 | 0.00177 |
| 101 | -0.00160 | 0.00164 |
| 102 | -0.00188 | 0.00151 |
| 103 | -0.00212 | 0.00139 |
| 104 | -0.00233 | 0.00128 |
| 105 | -0.00249 | 0.00118 |
| 106 | -0.00263 | 0.00109 |
| 107 | -0.00273 | 0.00100 |
| 108 | -0.00279 | 0.00092 |
| 109 | -0.00283 | 0.00085 |
| 110 | -0.00284 | 0.00079 |
| Source: Statistics Canada, Demography Division. | ||
Figure 4.10 shows the age-specific death rates for years 2017, 2043, and 2068. The dashed lines represent the projected mortality curves using the original age pattern, adjusted for old ages, and the solid lines present the curves projected with the rotational age patterns. As the forecast time horizon increases, there tends to be more and more uncertainty and variations in the projected curves. However, the rotation model smooths out those variations and better preserves the checkmark shape of the mortality rates.
Description for Figure 4.10
| Age | Males | Females | ||||
|---|---|---|---|---|---|---|
| 2017 Adjusted | 2068 | 2017 Adjusted | 2068 | |||
| Not rotated | Adjusted | Not rotated | Adjusted | |||
| per thousand | ||||||
| 0 | -5.4 | -6.4 | -6.4 | -5.5 | -6.5 | -6.5 |
| 1 | -8.4 | -9.9 | -9.6 | -8.4 | -9.9 | -9.5 |
| 2 | -8.7 | -10.3 | -9.9 | -8.7 | -10.4 | -9.9 |
| 3 | -9.0 | -10.7 | -10.2 | -9.0 | -10.9 | -10.2 |
| 4 | -9.2 | -11.0 | -10.5 | -9.2 | -11.2 | -10.4 |
| 5 | -9.4 | -11.3 | -10.7 | -9.4 | -11.4 | -10.6 |
| 6 | -9.5 | -11.4 | -10.8 | -9.5 | -11.6 | -10.7 |
| 7 | -9.6 | -11.5 | -10.9 | -9.6 | -11.6 | -10.8 |
| 8 | -9.6 | -11.4 | -10.9 | -9.6 | -11.6 | -10.8 |
| 9 | -9.6 | -11.3 | -10.8 | -9.6 | -11.4 | -10.7 |
| 10 | -9.5 | -11.2 | -10.7 | -9.5 | -11.2 | -10.7 |
| 11 | -9.4 | -10.9 | -10.6 | -9.4 | -11.0 | -10.6 |
| 12 | -9.2 | -10.7 | -10.4 | -9.3 | -10.8 | -10.4 |
| 13 | -9.0 | -10.4 | -10.1 | -9.1 | -10.6 | -10.2 |
| 14 | -8.7 | -10.1 | -9.8 | -8.9 | -10.4 | -10.0 |
| 15 | -8.4 | -9.8 | -9.5 | -8.7 | -10.1 | -9.8 |
| 16 | -8.0 | -9.4 | -9.2 | -8.5 | -9.9 | -9.6 |
| 17 | -7.8 | -9.1 | -8.9 | -8.3 | -9.7 | -9.4 |
| 18 | -7.6 | -8.8 | -8.7 | -8.3 | -9.6 | -9.3 |
| 19 | -7.5 | -8.6 | -8.5 | -8.2 | -9.4 | -9.3 |
| 20 | -7.4 | -8.4 | -8.4 | -8.2 | -9.3 | -9.2 |
| 21 | -7.3 | -8.3 | -8.3 | -8.2 | -9.2 | -9.2 |
| 22 | -7.3 | -8.2 | -8.3 | -8.2 | -9.1 | -9.2 |
| 23 | -7.3 | -8.1 | -8.2 | -8.1 | -9.0 | -9.1 |
| 24 | -7.3 | -8.1 | -8.2 | -8.1 | -8.9 | -9.1 |
| 25 | -7.3 | -8.1 | -8.2 | -8.1 | -8.9 | -9.1 |
| 26 | -7.3 | -8.1 | -8.2 | -8.1 | -8.8 | -9.1 |
| 27 | -7.3 | -8.1 | -8.2 | -8.1 | -8.8 | -9.0 |
| 28 | -7.3 | -8.0 | -8.2 | -8.0 | -8.7 | -9.0 |
| 29 | -7.3 | -8.0 | -8.2 | -8.0 | -8.7 | -8.9 |
| 30 | -7.3 | -8.0 | -8.2 | -7.9 | -8.6 | -8.9 |
| 31 | -7.2 | -7.9 | -8.1 | -7.9 | -8.6 | -8.8 |
| 32 | -7.2 | -7.9 | -8.1 | -7.8 | -8.5 | -8.8 |
| 33 | -7.2 | -7.9 | -8.0 | -7.7 | -8.5 | -8.7 |
| 34 | -7.1 | -7.8 | -8.0 | -7.7 | -8.4 | -8.6 |
| 35 | -7.1 | -7.8 | -8.0 | -7.6 | -8.4 | -8.6 |
| 36 | -7.0 | -7.8 | -7.9 | -7.6 | -8.3 | -8.5 |
| 37 | -6.9 | -7.7 | -7.9 | -7.5 | -8.3 | -8.5 |
| 38 | -6.9 | -7.6 | -7.8 | -7.4 | -8.2 | -8.4 |
| 39 | -6.8 | -7.6 | -7.7 | -7.3 | -8.1 | -8.3 |
| 40 | -6.7 | -7.5 | -7.6 | -7.2 | -8.0 | -8.2 |
| 41 | -6.6 | -7.4 | -7.6 | -7.1 | -7.9 | -8.1 |
| 42 | -6.6 | -7.3 | -7.5 | -7.0 | -7.8 | -8.0 |
| 43 | -6.5 | -7.3 | -7.4 | -6.9 | -7.7 | -7.9 |
| 44 | -6.4 | -7.2 | -7.3 | -6.8 | -7.6 | -7.8 |
| 45 | -6.3 | -7.1 | -7.2 | -6.7 | -7.5 | -7.7 |
| 46 | -6.2 | -7.1 | -7.2 | -6.6 | -7.4 | -7.6 |
| 47 | -6.1 | -7.0 | -7.1 | -6.5 | -7.4 | -7.5 |
| 48 | -6.1 | -6.9 | -7.0 | -6.5 | -7.3 | -7.4 |
| 49 | -6.0 | -6.9 | -6.9 | -6.4 | -7.2 | -7.4 |
| 50 | -5.9 | -6.8 | -6.9 | -6.3 | -7.2 | -7.3 |
| 51 | -5.8 | -6.7 | -6.8 | -6.2 | -7.1 | -7.2 |
| 52 | -5.7 | -6.7 | -6.7 | -6.1 | -7.1 | -7.1 |
| 53 | -5.6 | -6.6 | -6.6 | -6.0 | -7.0 | -7.0 |
| 54 | -5.5 | -6.5 | -6.5 | -5.9 | -6.9 | -7.0 |
| 55 | -5.5 | -6.5 | -6.4 | -5.9 | -6.9 | -6.9 |
| 56 | -5.4 | -6.4 | -6.4 | -5.8 | -6.8 | -6.8 |
| 57 | -5.3 | -6.3 | -6.3 | -5.7 | -6.7 | -6.7 |
| 58 | -5.2 | -6.2 | -6.2 | -5.6 | -6.7 | -6.6 |
| 59 | -5.1 | -6.1 | -6.1 | -5.5 | -6.6 | -6.5 |
| 60 | -5.0 | -6.0 | -6.0 | -5.4 | -6.5 | -6.4 |
| 61 | -4.9 | -6.0 | -5.9 | -5.3 | -6.4 | -6.3 |
| 62 | -4.8 | -5.9 | -5.8 | -5.2 | -6.3 | -6.3 |
| 63 | -4.7 | -5.8 | -5.7 | -5.1 | -6.2 | -6.2 |
| 64 | -4.6 | -5.7 | -5.6 | -5.0 | -6.1 | -6.1 |
| 65 | -4.5 | -5.6 | -5.5 | -4.9 | -6.0 | -6.0 |
| 66 | -4.4 | -5.5 | -5.4 | -4.9 | -5.9 | -5.9 |
| 67 | -4.3 | -5.4 | -5.3 | -4.8 | -5.8 | -5.8 |
| 68 | -4.2 | -5.3 | -5.2 | -4.7 | -5.7 | -5.7 |
| 69 | -4.1 | -5.1 | -5.1 | -4.6 | -5.6 | -5.6 |
| 70 | -4.0 | -5.0 | -5.0 | -4.5 | -5.5 | -5.5 |
| 71 | -3.9 | -4.9 | -4.9 | -4.4 | -5.4 | -5.3 |
| 72 | -3.8 | -4.8 | -4.8 | -4.2 | -5.2 | -5.2 |
| 73 | -3.7 | -4.7 | -4.7 | -4.1 | -5.1 | -5.1 |
| 74 | -3.6 | -4.5 | -4.5 | -4.0 | -5.0 | -5.0 |
| 75 | -3.5 | -4.4 | -4.4 | -3.9 | -4.9 | -4.8 |
| 76 | -3.4 | -4.3 | -4.3 | -3.8 | -4.7 | -4.7 |
| 77 | -3.3 | -4.1 | -4.1 | -3.7 | -4.6 | -4.6 |
| 78 | -3.2 | -4.0 | -4.0 | -3.6 | -4.4 | -4.4 |
| 79 | -3.1 | -3.9 | -3.8 | -3.5 | -4.3 | -4.3 |
| 80 | -2.9 | -3.7 | -3.7 | -3.4 | -4.1 | -4.1 |
| 81 | -2.8 | -3.6 | -3.6 | -3.2 | -4.0 | -4.0 |
| 82 | -2.7 | -3.4 | -3.4 | -3.1 | -3.8 | -3.8 |
| 83 | -2.6 | -3.3 | -3.3 | -3.0 | -3.7 | -3.7 |
| 84 | -2.5 | -3.1 | -3.1 | -2.9 | -3.5 | -3.5 |
| 85 | -2.4 | -2.9 | -2.9 | -2.8 | -3.3 | -3.3 |
| 86 | -2.2 | -2.8 | -2.8 | -2.6 | -3.2 | -3.2 |
| 87 | -2.1 | -2.6 | -2.6 | -2.5 | -3.0 | -3.0 |
| 88 | -2.0 | -2.4 | -2.4 | -2.4 | -2.8 | -2.8 |
| 89 | -1.9 | -2.3 | -2.2 | -2.2 | -2.6 | -2.6 |
| 90 | -1.7 | -2.1 | -2.1 | -2.1 | -2.5 | -2.5 |
| 91 | -1.6 | -1.9 | -1.9 | -2.0 | -2.3 | -2.3 |
| 92 | -1.5 | -1.8 | -1.8 | -1.9 | -2.2 | -2.2 |
| 93 | -1.4 | -1.7 | -1.7 | -1.7 | -2.0 | -2.0 |
| 94 | -1.3 | -1.5 | -1.5 | -1.6 | -1.9 | -1.9 |
| 95 | -1.2 | -1.4 | -1.4 | -1.5 | -1.8 | -1.7 |
| 96 | -1.1 | -1.3 | -1.3 | -1.4 | -1.6 | -1.6 |
| 97 | -1.0 | -1.2 | -1.2 | -1.3 | -1.5 | -1.5 |
| 98 | -0.9 | -1.1 | -1.1 | -1.2 | -1.4 | -1.4 |
| 99 | -0.8 | -1.0 | -1.0 | -1.1 | -1.3 | -1.3 |
| 100 | -0.7 | -0.9 | -0.9 | -1.0 | -1.2 | -1.2 |
| 101 | -0.6 | -0.8 | -0.8 | -0.9 | -1.1 | -1.1 |
| 102 | -0.6 | -0.7 | -0.7 | -0.8 | -1.0 | -1.0 |
| 103 | -0.5 | -0.7 | -0.7 | -0.8 | -0.9 | -0.9 |
| 104 | -0.5 | -0.6 | -0.6 | -0.7 | -0.8 | -0.8 |
| 105 | -0.4 | -0.5 | -0.5 | -0.6 | -0.7 | -0.7 |
| 106 | -0.4 | -0.5 | -0.5 | -0.6 | -0.7 | -0.7 |
| 107 | -0.3 | -0.4 | -0.4 | -0.5 | -0.6 | -0.6 |
| 108 | -0.3 | -0.4 | -0.4 | -0.5 | -0.5 | -0.5 |
| 109 | -0.2 | -0.3 | -0.3 | -0.4 | -0.5 | -0.5 |
| 110 | -0.2 | -0.3 | -0.3 | -0.4 | -0.4 | -0.4 |
| Source: Statistics Canada, Demography Division. | ||||||
Dealing with uncertainty
An important aspect of the Lee-Carter approach is that it is a probabilistic approach, from which some measurements of uncertainty can be obtained based on statistical fitting. Indeed, alternative assumptions can be constructed using the prediction interval of , obtained from the RWD forecast. However, because it contains only a limited number of parameters and excludes information from other sources, the model tends to underestimate uncertainty (D’Amato et al. 2011; Liu and Braun 2010; Koissi et al. 2006). For this reason, the assumption building process was complemented by integrating results of the 2018 Survey of Experts on Future Demographic Trends. This was done in five steps:
- Project life expectancy (LE) for a low and high assumption using the original Lee-Carter approach.
- Compute low and high LE targets in 2043 for each sex at the national level using an 80% confidence band from the results of the survey.
- Derive low and high LE targets for each province and territory based on those obtained at the national level in 2043. This was done by applying the ratio of a region’s projected LE to Canada’s projected LE in 2043, as both calculated in Step 1, to the new Canadian LE target computed from the survey in Step 2.
- Interpolate the target LE from 2017 to 2042 so it gradually and smoothly reaches the newly adjusted target in 2043. The target LEs for 2043 onward were calculated by keeping the distance between the new and the original LE, from Step 1, constant and equal to those created in 2043.
- Iterate the values obtained in Step 1 so that the projection yields the LE targets computed in Step 3. Note that this stage, the original vector has been transformed into 26 distinct vectors, one for each combination of sex and region.
- Run the projections using the new iterated values.
Unlike a direct forecast of life expectancy values, the Lee-Carter approach is sensitive to the distinct traits that regions may have such as their age structures and the way their mortality rates evolved in the past. For instance, regions with relatively high mortality rates at younger ages have more room for improvements at those ages and as a result, show more variation in forecasted life expectancy than other regions do. On the other hand, adjusting the results using values from the expert survey provides a wider and more reasonable level of uncertainty that is not based solely on historical data. It also offers a consistent way of handling uncertainty from one projection component to the next, since data from the survey were also used for other components of the projection such as fertility, immigration, non-permanent resident and emigration. The chosen approach combines the strength of the original Lee-Carter approach with those from using expert opinion.
Mortality assumptions
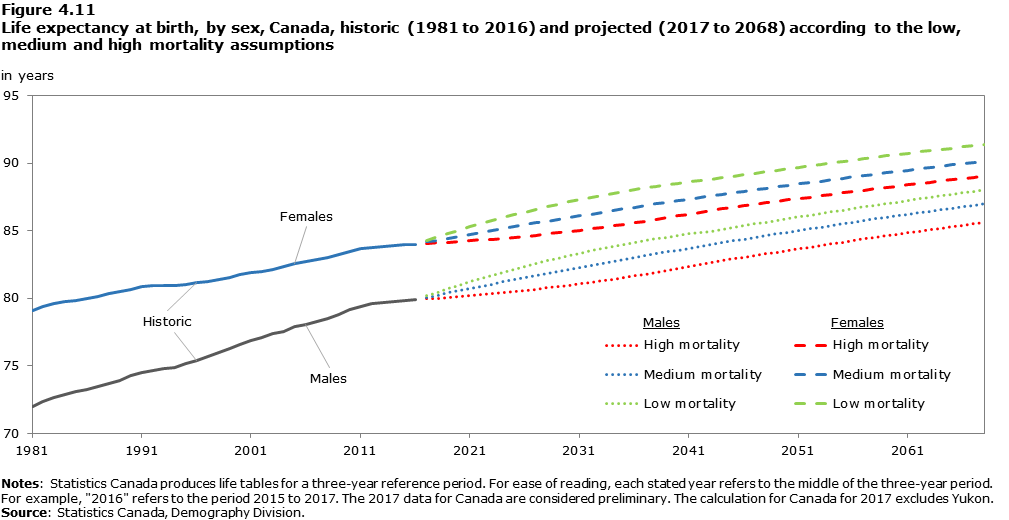
In all three mortality assumptions, life expectancy at birth for all provinces and territories and for both sexes is projected to increase, though at different rates, while the gap in life expectancy between males and females would continue to decrease. Figure 4.11 shows both observed and projected life expectancy at birth at Canada level, for males and females separately, from year 1981 to 2068.
Description for Figure 4.11
| Year | Males | Females | ||||||
|---|---|---|---|---|---|---|---|---|
| Historic | Projected | Historic | Projected | |||||
| Low mortality | Medium mortality | High mortality | Low mortality | Medium mortality | High mortality | |||
| in years | ||||||||
| 1981 | 72.0 | Note ..: not available for a specific reference period | Note ..: not available for a specific reference period | Note ..: not available for a specific reference period | 79.1 | Note ..: not available for a specific reference period | Note ..: not available for a specific reference period | Note ..: not available for a specific reference period |
| 1982 | 72.3 | Note ..: not available for a specific reference period | Note ..: not available for a specific reference period | Note ..: not available for a specific reference period | 79.4 | Note ..: not available for a specific reference period | Note ..: not available for a specific reference period | Note ..: not available for a specific reference period |
| 1983 | 72.7 | Note ..: not available for a specific reference period | Note ..: not available for a specific reference period | Note ..: not available for a specific reference period | 79.6 | Note ..: not available for a specific reference period | Note ..: not available for a specific reference period | Note ..: not available for a specific reference period |
| 1984 | 72.9 | Note ..: not available for a specific reference period | Note ..: not available for a specific reference period | Note ..: not available for a specific reference period | 79.7 | Note ..: not available for a specific reference period | Note ..: not available for a specific reference period | Note ..: not available for a specific reference period |
| 1985 | 73.1 | Note ..: not available for a specific reference period | Note ..: not available for a specific reference period | Note ..: not available for a specific reference period | 79.8 | Note ..: not available for a specific reference period | Note ..: not available for a specific reference period | Note ..: not available for a specific reference period |
| 1986 | 73.3 | Note ..: not available for a specific reference period | Note ..: not available for a specific reference period | Note ..: not available for a specific reference period | 79.9 | Note ..: not available for a specific reference period | Note ..: not available for a specific reference period | Note ..: not available for a specific reference period |
| 1987 | 73.5 | Note ..: not available for a specific reference period | Note ..: not available for a specific reference period | Note ..: not available for a specific reference period | 80.1 | Note ..: not available for a specific reference period | Note ..: not available for a specific reference period | Note ..: not available for a specific reference period |
| 1988 | 73.7 | Note ..: not available for a specific reference period | Note ..: not available for a specific reference period | Note ..: not available for a specific reference period | 80.3 | Note ..: not available for a specific reference period | Note ..: not available for a specific reference period | Note ..: not available for a specific reference period |
| 1989 | 73.9 | Note ..: not available for a specific reference period | Note ..: not available for a specific reference period | Note ..: not available for a specific reference period | 80.5 | Note ..: not available for a specific reference period | Note ..: not available for a specific reference period | Note ..: not available for a specific reference period |
| 1990 | 74.3 | Note ..: not available for a specific reference period | Note ..: not available for a specific reference period | Note ..: not available for a specific reference period | 80.7 | Note ..: not available for a specific reference period | Note ..: not available for a specific reference period | Note ..: not available for a specific reference period |
| 1991 | 74.5 | Note ..: not available for a specific reference period | Note ..: not available for a specific reference period | Note ..: not available for a specific reference period | 80.9 | Note ..: not available for a specific reference period | Note ..: not available for a specific reference period | Note ..: not available for a specific reference period |
| 1992 | 74.7 | Note ..: not available for a specific reference period | Note ..: not available for a specific reference period | Note ..: not available for a specific reference period | 80.9 | Note ..: not available for a specific reference period | Note ..: not available for a specific reference period | Note ..: not available for a specific reference period |
| 1993 | 74.8 | Note ..: not available for a specific reference period | Note ..: not available for a specific reference period | Note ..: not available for a specific reference period | 81.0 | Note ..: not available for a specific reference period | Note ..: not available for a specific reference period | Note ..: not available for a specific reference period |
| 1994 | 74.9 | Note ..: not available for a specific reference period | Note ..: not available for a specific reference period | Note ..: not available for a specific reference period | 80.9 | Note ..: not available for a specific reference period | Note ..: not available for a specific reference period | Note ..: not available for a specific reference period |
| 1995 | 75.1 | Note ..: not available for a specific reference period | Note ..: not available for a specific reference period | Note ..: not available for a specific reference period | 81.0 | Note ..: not available for a specific reference period | Note ..: not available for a specific reference period | Note ..: not available for a specific reference period |
| 1996 | 75.4 | Note ..: not available for a specific reference period | Note ..: not available for a specific reference period | Note ..: not available for a specific reference period | 81.1 | Note ..: not available for a specific reference period | Note ..: not available for a specific reference period | Note ..: not available for a specific reference period |
| 1997 | 75.7 | Note ..: not available for a specific reference period | Note ..: not available for a specific reference period | Note ..: not available for a specific reference period | 81.3 | Note ..: not available for a specific reference period | Note ..: not available for a specific reference period | Note ..: not available for a specific reference period |
| 1998 | 75.9 | Note ..: not available for a specific reference period | Note ..: not available for a specific reference period | Note ..: not available for a specific reference period | 81.4 | Note ..: not available for a specific reference period | Note ..: not available for a specific reference period | Note ..: not available for a specific reference period |
| 1999 | 76.3 | Note ..: not available for a specific reference period | Note ..: not available for a specific reference period | Note ..: not available for a specific reference period | 81.6 | Note ..: not available for a specific reference period | Note ..: not available for a specific reference period | Note ..: not available for a specific reference period |
| 2000 | 76.6 | Note ..: not available for a specific reference period | Note ..: not available for a specific reference period | Note ..: not available for a specific reference period | 81.8 | Note ..: not available for a specific reference period | Note ..: not available for a specific reference period | Note ..: not available for a specific reference period |
| 2001 | 76.9 | Note ..: not available for a specific reference period | Note ..: not available for a specific reference period | Note ..: not available for a specific reference period | 81.9 | Note ..: not available for a specific reference period | Note ..: not available for a specific reference period | Note ..: not available for a specific reference period |
| 2002 | 77.1 | Note ..: not available for a specific reference period | Note ..: not available for a specific reference period | Note ..: not available for a specific reference period | 82.0 | Note ..: not available for a specific reference period | Note ..: not available for a specific reference period | Note ..: not available for a specific reference period |
| 2003 | 77.4 | Note ..: not available for a specific reference period | Note ..: not available for a specific reference period | Note ..: not available for a specific reference period | 82.2 | Note ..: not available for a specific reference period | Note ..: not available for a specific reference period | Note ..: not available for a specific reference period |
| 2004 | 77.6 | Note ..: not available for a specific reference period | Note ..: not available for a specific reference period | Note ..: not available for a specific reference period | 82.3 | Note ..: not available for a specific reference period | Note ..: not available for a specific reference period | Note ..: not available for a specific reference period |
| 2005 | 77.9 | Note ..: not available for a specific reference period | Note ..: not available for a specific reference period | Note ..: not available for a specific reference period | 82.6 | Note ..: not available for a specific reference period | Note ..: not available for a specific reference period | Note ..: not available for a specific reference period |
| 2006 | 78.1 | Note ..: not available for a specific reference period | Note ..: not available for a specific reference period | Note ..: not available for a specific reference period | 82.7 | Note ..: not available for a specific reference period | Note ..: not available for a specific reference period | Note ..: not available for a specific reference period |
| 2007 | 78.3 | Note ..: not available for a specific reference period | Note ..: not available for a specific reference period | Note ..: not available for a specific reference period | 82.9 | Note ..: not available for a specific reference period | Note ..: not available for a specific reference period | Note ..: not available for a specific reference period |
| 2008 | 78.5 | Note ..: not available for a specific reference period | Note ..: not available for a specific reference period | Note ..: not available for a specific reference period | 83.0 | Note ..: not available for a specific reference period | Note ..: not available for a specific reference period | Note ..: not available for a specific reference period |
| 2009 | 78.8 | Note ..: not available for a specific reference period | Note ..: not available for a specific reference period | Note ..: not available for a specific reference period | 83.2 | Note ..: not available for a specific reference period | Note ..: not available for a specific reference period | Note ..: not available for a specific reference period |
| 2010 | 79.1 | Note ..: not available for a specific reference period | Note ..: not available for a specific reference period | Note ..: not available for a specific reference period | 83.5 | Note ..: not available for a specific reference period | Note ..: not available for a specific reference period | Note ..: not available for a specific reference period |
| 2011 | 79.4 | Note ..: not available for a specific reference period | Note ..: not available for a specific reference period | Note ..: not available for a specific reference period | 83.7 | Note ..: not available for a specific reference period | Note ..: not available for a specific reference period | Note ..: not available for a specific reference period |
| 2012 | 79.6 | Note ..: not available for a specific reference period | Note ..: not available for a specific reference period | Note ..: not available for a specific reference period | 83.8 | Note ..: not available for a specific reference period | Note ..: not available for a specific reference period | Note ..: not available for a specific reference period |
| 2013 | 79.7 | Note ..: not available for a specific reference period | Note ..: not available for a specific reference period | Note ..: not available for a specific reference period | 83.9 | Note ..: not available for a specific reference period | Note ..: not available for a specific reference period | Note ..: not available for a specific reference period |
| 2014 | 79.8 | Note ..: not available for a specific reference period | Note ..: not available for a specific reference period | Note ..: not available for a specific reference period | 83.9 | Note ..: not available for a specific reference period | Note ..: not available for a specific reference period | Note ..: not available for a specific reference period |
| 2015 | 79.9 | Note ..: not available for a specific reference period | Note ..: not available for a specific reference period | Note ..: not available for a specific reference period | 83.9 | Note ..: not available for a specific reference period | Note ..: not available for a specific reference period | Note ..: not available for a specific reference period |
| 2016 | 79.9 | Note ..: not available for a specific reference period | Note ..: not available for a specific reference period | Note ..: not available for a specific reference period | 84.0 | Note ..: not available for a specific reference period | Note ..: not available for a specific reference period | Note ..: not available for a specific reference period |
| 2017 | Note ..: not available for a specific reference period | 80.2 | 80.1 | 80.0 | Note ..: not available for a specific reference period | 84.3 | 84.2 | 84.1 |
| 2018 | Note ..: not available for a specific reference period | 80.5 | 80.2 | 80.0 | Note ..: not available for a specific reference period | 84.5 | 84.3 | 84.1 |
| 2019 | Note ..: not available for a specific reference period | 80.7 | 80.4 | 80.1 | Note ..: not available for a specific reference period | 84.8 | 84.5 | 84.1 |
| 2020 | Note ..: not available for a specific reference period | 81.0 | 80.6 | 80.1 | Note ..: not available for a specific reference period | 85.0 | 84.6 | 84.2 |
| 2021 | Note ..: not available for a specific reference period | 81.2 | 80.7 | 80.2 | Note ..: not available for a specific reference period | 85.3 | 84.7 | 84.3 |
| 2022 | Note ..: not available for a specific reference period | 81.5 | 80.9 | 80.3 | Note ..: not available for a specific reference period | 85.5 | 84.9 | 84.3 |
| 2023 | Note ..: not available for a specific reference period | 81.7 | 81.0 | 80.3 | Note ..: not available for a specific reference period | 85.7 | 85.0 | 84.4 |
| 2024 | Note ..: not available for a specific reference period | 81.9 | 81.2 | 80.4 | Note ..: not available for a specific reference period | 86.0 | 85.2 | 84.4 |
| 2025 | Note ..: not available for a specific reference period | 82.2 | 81.4 | 80.5 | Note ..: not available for a specific reference period | 86.2 | 85.3 | 84.5 |
| 2026 | Note ..: not available for a specific reference period | 82.4 | 81.5 | 80.6 | Note ..: not available for a specific reference period | 86.4 | 85.4 | 84.6 |
| 2027 | Note ..: not available for a specific reference period | 82.6 | 81.7 | 80.7 | Note ..: not available for a specific reference period | 86.6 | 85.6 | 84.7 |
| 2028 | Note ..: not available for a specific reference period | 82.8 | 81.8 | 80.8 | Note ..: not available for a specific reference period | 86.8 | 85.7 | 84.8 |
| 2029 | Note ..: not available for a specific reference period | 83.0 | 82.0 | 80.9 | Note ..: not available for a specific reference period | 87.0 | 85.8 | 84.9 |
| 2030 | Note ..: not available for a specific reference period | 83.2 | 82.1 | 81.0 | Note ..: not available for a specific reference period | 87.1 | 86.0 | 84.9 |
| 2031 | Note ..: not available for a specific reference period | 83.3 | 82.3 | 81.1 | Note ..: not available for a specific reference period | 87.3 | 86.1 | 85.0 |
| 2032 | Note ..: not available for a specific reference period | 83.5 | 82.4 | 81.2 | Note ..: not available for a specific reference period | 87.5 | 86.2 | 85.1 |
| 2033 | Note ..: not available for a specific reference period | 83.7 | 82.6 | 81.3 | Note ..: not available for a specific reference period | 87.6 | 86.4 | 85.2 |
| 2034 | Note ..: not available for a specific reference period | 83.8 | 82.7 | 81.4 | Note ..: not available for a specific reference period | 87.8 | 86.5 | 85.4 |
| 2035 | Note ..: not available for a specific reference period | 84.0 | 82.9 | 81.5 | Note ..: not available for a specific reference period | 87.9 | 86.6 | 85.5 |
| 2036 | Note ..: not available for a specific reference period | 84.1 | 83.0 | 81.7 | Note ..: not available for a specific reference period | 88.0 | 86.7 | 85.6 |
| 2037 | Note ..: not available for a specific reference period | 84.3 | 83.1 | 81.8 | Note ..: not available for a specific reference period | 88.2 | 86.9 | 85.7 |
| 2038 | Note ..: not available for a specific reference period | 84.4 | 83.3 | 81.9 | Note ..: not available for a specific reference period | 88.3 | 87.0 | 85.8 |
| 2039 | Note ..: not available for a specific reference period | 84.5 | 83.4 | 82.1 | Note ..: not available for a specific reference period | 88.4 | 87.1 | 86.0 |
| 2040 | Note ..: not available for a specific reference period | 84.6 | 83.6 | 82.2 | Note ..: not available for a specific reference period | 88.5 | 87.2 | 86.1 |
| 2041 | Note ..: not available for a specific reference period | 84.8 | 83.7 | 82.3 | Note ..: not available for a specific reference period | 88.6 | 87.3 | 86.2 |
| 2042 | Note ..: not available for a specific reference period | 84.9 | 83.8 | 82.5 | Note ..: not available for a specific reference period | 88.7 | 87.5 | 86.4 |
| 2043 | Note ..: not available for a specific reference period | 85.0 | 84.0 | 82.6 | Note ..: not available for a specific reference period | 88.8 | 87.6 | 86.5 |
| 2044 | Note ..: not available for a specific reference period | 85.1 | 84.1 | 82.8 | Note ..: not available for a specific reference period | 88.9 | 87.7 | 86.6 |
| 2045 | Note ..: not available for a specific reference period | 85.2 | 84.2 | 82.9 | Note ..: not available for a specific reference period | 89.0 | 87.8 | 86.7 |
| 2046 | Note ..: not available for a specific reference period | 85.4 | 84.4 | 83.0 | Note ..: not available for a specific reference period | 89.1 | 87.9 | 86.8 |
| 2047 | Note ..: not available for a specific reference period | 85.5 | 84.5 | 83.2 | Note ..: not available for a specific reference period | 89.3 | 88.0 | 87.0 |
| 2048 | Note ..: not available for a specific reference period | 85.6 | 84.6 | 83.3 | Note ..: not available for a specific reference period | 89.4 | 88.1 | 87.1 |
| 2049 | Note ..: not available for a specific reference period | 85.8 | 84.8 | 83.4 | Note ..: not available for a specific reference period | 89.5 | 88.2 | 87.2 |
| 2050 | Note ..: not available for a specific reference period | 85.9 | 84.9 | 83.5 | Note ..: not available for a specific reference period | 89.6 | 88.4 | 87.3 |
| 2051 | Note ..: not available for a specific reference period | 86.0 | 85.0 | 83.7 | Note ..: not available for a specific reference period | 89.7 | 88.5 | 87.4 |
| 2052 | Note ..: not available for a specific reference period | 86.1 | 85.1 | 83.8 | Note ..: not available for a specific reference period | 89.8 | 88.6 | 87.5 |
| 2053 | Note ..: not available for a specific reference period | 86.3 | 85.3 | 83.9 | Note ..: not available for a specific reference period | 89.9 | 88.7 | 87.6 |
| 2054 | Note ..: not available for a specific reference period | 86.4 | 85.4 | 84.0 | Note ..: not available for a specific reference period | 90.0 | 88.8 | 87.7 |
| 2055 | Note ..: not available for a specific reference period | 86.5 | 85.5 | 84.2 | Note ..: not available for a specific reference period | 90.1 | 88.9 | 87.8 |
| 2056 | Note ..: not available for a specific reference period | 86.6 | 85.6 | 84.3 | Note ..: not available for a specific reference period | 90.2 | 89.0 | 87.9 |
| 2057 | Note ..: not available for a specific reference period | 86.8 | 85.8 | 84.4 | Note ..: not available for a specific reference period | 90.3 | 89.1 | 88.0 |
| 2058 | Note ..: not available for a specific reference period | 86.9 | 85.9 | 84.5 | Note ..: not available for a specific reference period | 90.4 | 89.2 | 88.1 |
| 2059 | Note ..: not available for a specific reference period | 87.0 | 86.0 | 84.6 | Note ..: not available for a specific reference period | 90.5 | 89.3 | 88.2 |
| 2060 | Note ..: not available for a specific reference period | 87.1 | 86.1 | 84.7 | Note ..: not available for a specific reference period | 90.6 | 89.4 | 88.3 |
| 2061 | Note ..: not available for a specific reference period | 87.2 | 86.2 | 84.9 | Note ..: not available for a specific reference period | 90.7 | 89.5 | 88.4 |
| 2062 | Note ..: not available for a specific reference period | 87.4 | 86.3 | 85.0 | Note ..: not available for a specific reference period | 90.8 | 89.6 | 88.5 |
| 2063 | Note ..: not available for a specific reference period | 87.5 | 86.5 | 85.1 | Note ..: not available for a specific reference period | 90.9 | 89.7 | 88.6 |
| 2064 | Note ..: not available for a specific reference period | 87.6 | 86.6 | 85.2 | Note ..: not available for a specific reference period | 91.0 | 89.8 | 88.7 |
| 2065 | Note ..: not available for a specific reference period | 87.7 | 86.7 | 85.3 | Note ..: not available for a specific reference period | 91.1 | 89.9 | 88.8 |
| 2066 | Note ..: not available for a specific reference period | 87.8 | 86.8 | 85.4 | Note ..: not available for a specific reference period | 91.2 | 90.0 | 88.9 |
| 2067 | Note ..: not available for a specific reference period | 87.9 | 86.9 | 85.5 | Note ..: not available for a specific reference period | 91.3 | 90.0 | 89.0 |
| 2068 | Note ..: not available for a specific reference period | 88.0 | 87.0 | 85.6 | Note ..: not available for a specific reference period | 91.4 | 90.1 | 89.1 |
|
.. not available for a specific reference period Notes: Statistics Canada produces life tables for a three-year reference period. For ease of reading, each stated year refers to the middle of the three-year period. For example, "2016" refers to the period 2015 to 2017. The 2017 data for Canada are considered preliminary. The calculation for Canada for 2017 excludes Yukon. Source: Statistics Canada, Demography Division. |
||||||||
In Canada, life expectancy at birth for males is projected to increase from 79.9 years in 2016 to 83.9 years in 2043 and 87.0 years in 2068 under the medium mortality assumption. Under the high mortality assumption, male life expectancy is projected to reach 82.6 years in 2043 and 85.6 years in 2068. In contrast, male life expectancy would reach 84.9 years in 2043 and 88.0 years in 2068 under low mortality assumption.
Female life expectancy is projected to increase from 84.0 years in 2016 to 87.5 years in 2043 and 90.1 years in 2068 under the medium mortality assumption. Under the high mortality assumption, female life expectancy would reach 86.4 in 2043 and 89.0 years in 2068, in comparison to 88.7 and 91.3 years, respectively, in the low mortality assumption. Projected life expectancies at birth by sex and province/territory for selected years according to the low, medium and high mortality assumptions are shown in tables 4.2, 4.3 and 4.4.
| Sex / Region | 1981 | 1986 | 1991 | 1996 | 2001 | 2006 | 2011 | 2016 | 2017/ 2018 |
2022/ 2023 |
2027/ 2028 |
2032/ 2033 |
2037/ 2038 |
2042/ 2043 |
2047/ 2048 |
2052/ 2053 |
2057/ 2058 |
2062/ 2063 |
2067/ 2068 |
|---|---|---|---|---|---|---|---|---|---|---|---|---|---|---|---|---|---|---|---|
| in years | |||||||||||||||||||
| Males | |||||||||||||||||||
| Canada | 72.0 | 73.3 | 74.5 | 75.4 | 76.9 | 78.1 | 79.4 | 79.9 | 80.2 | 81.0 | 81.7 | 82.5 | 83.2 | 83.9 | 84.6 | 85.2 | 85.8 | 86.4 | 87.0 |
| N.L. | 71.9 | 72.9 | 73.7 | 74.4 | 75.3 | 75.7 | 77.3 | 77.5 | 77.8 | 78.8 | 79.7 | 80.6 | 81.4 | 82.2 | 83.0 | 83.7 | 84.4 | 85.0 | 85.7 |
| P.E.I. | 72.9 | 73.7 | 74.6 | 75.6 | 76.6 | 77.6 | 78.8 | 80.0 | 80.2 | 81.0 | 81.9 | 82.6 | 83.4 | 84.1 | 84.7 | 85.4 | 86.0 | 86.6 | 87.1 |
| N.S. | 71.0 | 72.4 | 73.7 | 74.8 | 76.2 | 76.9 | 78.1 | 78.2 | 78.5 | 79.5 | 80.4 | 81.3 | 82.1 | 82.9 | 83.6 | 84.3 | 85.0 | 85.6 | 86.2 |
| N.B. | 71.1 | 72.6 | 74.2 | 74.8 | 76.2 | 77.4 | 78.4 | 78.6 | 78.9 | 79.9 | 80.8 | 81.6 | 82.5 | 83.2 | 83.9 | 84.6 | 85.3 | 85.9 | 86.5 |
| Que. | 71.2 | 72.2 | 73.7 | 74.6 | 76.3 | 78.0 | 79.5 | 80.6 | 80.9 | 81.6 | 82.4 | 83.1 | 83.8 | 84.4 | 85.1 | 85.7 | 86.3 | 86.8 | 87.4 |
| Ont. | 72.4 | 73.7 | 74.9 | 75.8 | 77.3 | 78.5 | 79.8 | 80.4 | 80.6 | 81.4 | 82.2 | 82.9 | 83.7 | 84.4 | 85.0 | 85.7 | 86.3 | 86.8 | 87.4 |
| Man. | 72.3 | 73.3 | 74.6 | 75.2 | 75.6 | 76.7 | 77.8 | 77.9 | 78.2 | 79.2 | 80.1 | 81.0 | 81.8 | 82.6 | 83.4 | 84.1 | 84.8 | 85.5 | 86.1 |
| Sask. | 72.5 | 73.8 | 75.3 | 75.4 | 76.2 | 76.9 | 77.5 | 77.9 | 78.2 | 79.2 | 80.1 | 81.0 | 81.9 | 82.7 | 83.5 | 84.2 | 85.0 | 85.6 | 86.3 |
| Alta. | 72.2 | 73.7 | 75.0 | 75.9 | 77.1 | 77.9 | 79.1 | 79.2 | 79.5 | 80.4 | 81.3 | 82.1 | 82.9 | 83.7 | 84.4 | 85.1 | 85.7 | 86.4 | 86.9 |
| B.C. | 72.8 | 74.4 | 75.2 | 76.1 | 78.0 | 78.7 | 80.3 | 80.1 | 80.5 | 81.6 | 82.5 | 83.2 | 83.9 | 84.6 | 85.2 | 85.8 | 86.4 | 87.0 | 87.5 |
| Y.T. | 67.2 | 68.2 | 69.3 | 70.5 | 71.6 | 72.9 | 74.1 | 75.5 | 75.8 | 76.8 | 77.9 | 78.8 | 79.8 | 80.7 | 81.5 | 82.3 | 83.1 | 83.9 | 84.6 |
| N.W.T. | Note ..: not available for a specific reference period | Note ..: not available for a specific reference period | Note ..: not available for a specific reference period | Note ..: not available for a specific reference period | 73.0 | 73.7 | 74.5 | 75.2 | 75.5 | 76.6 | 77.7 | 78.6 | 79.6 | 80.5 | 81.4 | 82.2 | 83.0 | 83.7 | 84.4 |
| Nvt. | Note ..: not available for a specific reference period | Note ..: not available for a specific reference period | Note ..: not available for a specific reference period | Note ..: not available for a specific reference period | 67.0 | 68.2 | 69.6 | 71.0 | 71.4 | 72.6 | 73.8 | 74.9 | 75.9 | 76.9 | 77.9 | 78.8 | 79.7 | 80.6 | 81.4 |
| Females | |||||||||||||||||||
| Canada | 79.1 | 79.9 | 80.9 | 81.1 | 81.9 | 82.7 | 83.7 | 84.0 | 84.2 | 85.0 | 85.6 | 86.3 | 86.9 | 87.5 | 88.1 | 88.6 | 89.1 | 89.6 | 90.1 |
| N.L. | 78.8 | 79.2 | 79.5 | 80.2 | 80.6 | 80.7 | 82.1 | 81.7 | 82.0 | 82.9 | 83.7 | 84.5 | 85.3 | 86.0 | 86.7 | 87.3 | 87.9 | 88.4 | 89.0 |
| P.E.I. | 80.5 | 80.9 | 81.4 | 81.8 | 82.3 | 82.8 | 83.3 | 83.8 | 84.1 | 84.8 | 85.5 | 86.2 | 86.9 | 87.5 | 88.1 | 88.6 | 89.2 | 89.7 | 90.2 |
| N.S. | 78.5 | 79.4 | 80.2 | 80.5 | 81.1 | 81.9 | 82.5 | 82.6 | 82.8 | 83.7 | 84.5 | 85.3 | 86.0 | 86.7 | 87.3 | 87.9 | 88.5 | 89.0 | 89.5 |
| N.B. | 79.1 | 80.1 | 80.8 | 81.2 | 81.8 | 82.3 | 83.2 | 82.9 | 83.2 | 84.0 | 84.8 | 85.6 | 86.2 | 86.9 | 87.5 | 88.1 | 88.7 | 89.2 | 89.7 |
| Que. | 78.8 | 79.6 | 80.8 | 81.0 | 81.9 | 82.8 | 83.6 | 84.2 | 84.4 | 85.1 | 85.7 | 86.3 | 86.9 | 87.4 | 88.0 | 88.5 | 89.0 | 89.4 | 89.9 |
| Ont. | 79.1 | 80.0 | 80.9 | 81.2 | 82.0 | 83.0 | 84.0 | 84.4 | 84.6 | 85.1 | 85.8 | 86.4 | 87.0 | 87.6 | 88.2 | 88.8 | 89.3 | 89.8 | 90.2 |
| Man. | 78.9 | 79.9 | 80.7 | 80.5 | 81.1 | 81.6 | 82.1 | 82.1 | 82.4 | 83.3 | 84.1 | 84.9 | 85.6 | 86.3 | 87.0 | 87.6 | 88.2 | 88.8 | 89.3 |
| Sask. | 79.9 | 80.6 | 81.6 | 81.4 | 81.5 | 81.8 | 82.3 | 82.7 | 82.9 | 83.8 | 84.6 | 85.3 | 86.0 | 86.7 | 87.3 | 87.9 | 88.5 | 89.1 | 89.6 |
| Alta. | 79.2 | 80.2 | 81.1 | 81.3 | 81.9 | 82.7 | 83.6 | 83.8 | 84.0 | 84.9 | 85.6 | 86.3 | 87.0 | 87.6 | 88.2 | 88.8 | 89.3 | 89.8 | 90.3 |
| B.C. | 79.7 | 80.7 | 81.4 | 81.8 | 82.6 | 83.2 | 84.3 | 84.6 | 84.8 | 85.5 | 86.2 | 86.9 | 87.5 | 88.0 | 88.6 | 89.1 | 89.6 | 90.1 | 90.5 |
| Y.T. | 73.5 | 74.6 | 75.7 | 76.9 | 78.1 | 79.4 | 80.7 | 82.0 | 82.2 | 82.7 | 83.4 | 84.1 | 84.7 | 85.4 | 86.0 | 86.6 | 87.2 | 87.7 | 88.2 |
| N.W.T. | Note ..: not available for a specific reference period | Note ..: not available for a specific reference period | Note ..: not available for a specific reference period | Note ..: not available for a specific reference period | 78.2 | 78.5 | 78.9 | 79.3 | 79.6 | 80.5 | 81.4 | 82.3 | 83.1 | 83.9 | 84.7 | 85.4 | 86.0 | 86.7 | 87.3 |
| Nvt. | Note ..: not available for a specific reference period | Note ..: not available for a specific reference period | Note ..: not available for a specific reference period | Note ..: not available for a specific reference period | 70.7 | 71.6 | 72.5 | 73.5 | 73.9 | 75.0 | 76.1 | 77.1 | 78.1 | 79.1 | 80.0 | 80.9 | 81.7 | 82.6 | 83.3 |
|
.. not available for a specific reference period Notes: Statistics Canada produces life tables for a three-year reference period. For ease of reading, each stated year refers to the middle of the three-year period. For example, "2016" refers to the period 2015 to 2017. The 2017 data are considered preliminary. The calculation for Canada for 2016 (2015/2017) excludes Yukon. The numbers for Yukon in 2016 are projected. Sources: Statistics Canada. 2019. Life Tables, Canada, Provinces and Territories, catalogue no. 84-537 and Demography Division. |
|||||||||||||||||||
| Sex / Region | 1981 | 1986 | 1991 | 1996 | 2001 | 2006 | 2011 | 2016 | 2017/ 2018 |
2022/ 2023 |
2027/ 2028 |
2032/ 2033 |
2037/ 2038 |
2042/ 2043 |
2047/ 2048 |
2052/ 2053 |
2057/ 2058 |
2062/ 2063 |
2067/ 2068 |
|---|---|---|---|---|---|---|---|---|---|---|---|---|---|---|---|---|---|---|---|
| Males | in years | ||||||||||||||||||
| Canada | 72.0 | 73.3 | 74.5 | 75.4 | 76.9 | 78.1 | 79.4 | 79.9 | 80.0 | 80.3 | 80.7 | 81.2 | 81.9 | 82.6 | 83.2 | 83.8 | 84.4 | 85.0 | 85.6 |
| N.L. | 71.9 | 72.9 | 73.7 | 74.4 | 75.3 | 75.7 | 77.3 | 77.5 | 77.6 | 77.9 | 78.3 | 78.9 | 79.5 | 80.2 | 80.9 | 81.6 | 82.3 | 83.0 | 83.6 |
| P.E.I. | 72.9 | 73.7 | 74.6 | 75.6 | 76.6 | 77.6 | 78.8 | 80.0 | 80.0 | 80.2 | 80.5 | 80.9 | 81.4 | 82.1 | 82.7 | 83.3 | 83.9 | 84.5 | 85.1 |
| N.S. | 71.0 | 72.4 | 73.7 | 74.8 | 76.2 | 76.9 | 78.1 | 78.2 | 78.3 | 78.6 | 79.0 | 79.5 | 80.1 | 80.8 | 81.6 | 82.3 | 82.9 | 83.5 | 84.2 |
| N.B. | 71.1 | 72.6 | 74.2 | 74.8 | 76.2 | 77.4 | 78.4 | 78.6 | 78.6 | 79.0 | 79.4 | 79.9 | 80.5 | 81.2 | 81.9 | 82.6 | 83.2 | 83.9 | 84.5 |
| Que. | 71.2 | 72.2 | 73.7 | 74.6 | 76.3 | 78.0 | 79.5 | 80.6 | 80.7 | 80.8 | 81.1 | 81.4 | 81.9 | 82.4 | 83.0 | 83.6 | 84.2 | 84.8 | 85.3 |
| Ont. | 72.4 | 73.7 | 74.9 | 75.8 | 77.3 | 78.5 | 79.8 | 80.4 | 80.4 | 80.6 | 80.9 | 81.3 | 81.8 | 82.3 | 83.0 | 83.6 | 84.2 | 84.8 | 85.3 |
| Man. | 72.3 | 73.3 | 74.6 | 75.2 | 75.6 | 76.7 | 77.8 | 77.9 | 78.0 | 78.3 | 78.7 | 79.3 | 79.9 | 80.6 | 81.4 | 82.1 | 82.8 | 83.4 | 84.1 |
| Sask. | 72.5 | 73.8 | 75.3 | 75.4 | 76.2 | 76.9 | 77.5 | 77.9 | 78.0 | 78.3 | 78.8 | 79.3 | 79.9 | 80.7 | 81.5 | 82.2 | 82.9 | 83.6 | 84.2 |
| Alta. | 72.2 | 73.7 | 75.0 | 75.9 | 77.1 | 77.9 | 79.1 | 79.2 | 79.3 | 79.5 | 79.9 | 80.4 | 81.0 | 81.6 | 82.3 | 83.0 | 83.7 | 84.3 | 84.9 |
| B.C. | 72.8 | 74.4 | 75.2 | 76.1 | 78.0 | 78.7 | 80.3 | 80.1 | 80.2 | 80.4 | 80.8 | 81.3 | 81.9 | 82.6 | 83.2 | 83.8 | 84.4 | 84.9 | 85.5 |
| Y.T. | 67.2 | 68.2 | 69.3 | 70.5 | 71.6 | 72.9 | 74.1 | 75.5 | 75.6 | 76.0 | 76.5 | 77.1 | 77.8 | 78.6 | 79.5 | 80.3 | 81.1 | 81.8 | 82.5 |
| N.W.T. | Note ..: not available for a specific reference period | Note ..: not available for a specific reference period | Note ..: not available for a specific reference period | Note ..: not available for a specific reference period | 73.0 | 73.7 | 74.5 | 75.2 | 75.3 | 75.7 | 76.3 | 76.9 | 77.6 | 78.5 | 79.3 | 80.1 | 80.9 | 81.6 | 82.4 |
| Nvt. | Note ..: not available for a specific reference period | Note ..: not available for a specific reference period | Note ..: not available for a specific reference period | Note ..: not available for a specific reference period | 67.0 | 68.2 | 69.6 | 71.0 | 71.1 | 71.7 | 72.3 | 73.1 | 74.0 | 74.9 | 75.9 | 76.8 | 77.7 | 78.5 | 79.3 |
| Females | |||||||||||||||||||
| Canada | 79.1 | 79.9 | 80.9 | 81.1 | 81.9 | 82.7 | 83.7 | 84.0 | 84.1 | 84.3 | 84.7 | 85.2 | 85.8 | 86.4 | 87.0 | 87.5 | 88.1 | 88.5 | 89.0 |
| N.L. | 78.8 | 79.2 | 79.5 | 80.2 | 80.6 | 80.7 | 82.1 | 81.7 | 81.7 | 82.1 | 82.5 | 83.0 | 83.6 | 84.4 | 85.0 | 85.6 | 86.2 | 86.8 | 87.3 |
| P.E.I. | 80.5 | 80.9 | 81.4 | 81.8 | 82.3 | 82.8 | 83.3 | 83.8 | 83.9 | 84.1 | 84.4 | 84.8 | 85.2 | 85.8 | 86.4 | 87.0 | 87.5 | 88.0 | 88.5 |
| N.S. | 78.5 | 79.4 | 80.2 | 80.5 | 81.1 | 81.9 | 82.5 | 82.6 | 82.6 | 82.9 | 83.3 | 83.8 | 84.4 | 85.0 | 85.7 | 86.3 | 86.8 | 87.3 | 87.9 |
| N.B. | 79.1 | 80.1 | 80.8 | 81.2 | 81.8 | 82.3 | 83.2 | 82.9 | 83.0 | 83.3 | 83.6 | 84.1 | 84.6 | 85.3 | 85.9 | 86.5 | 87.0 | 87.5 | 88.0 |
| Que. | 78.8 | 79.6 | 80.8 | 81.0 | 81.9 | 82.8 | 83.6 | 84.2 | 84.2 | 84.4 | 84.6 | 84.9 | 85.3 | 85.8 | 86.3 | 86.8 | 87.3 | 87.8 | 88.3 |
| Ont. | 79.1 | 80.0 | 80.9 | 81.2 | 82.0 | 83.0 | 84.0 | 84.4 | 84.4 | 84.5 | 84.8 | 85.1 | 85.5 | 86.0 | 86.6 | 87.1 | 87.6 | 88.1 | 88.6 |
| Man. | 78.9 | 79.9 | 80.7 | 80.5 | 81.1 | 81.6 | 82.1 | 82.1 | 82.2 | 82.5 | 82.9 | 83.4 | 84.0 | 84.7 | 85.3 | 85.9 | 86.5 | 87.1 | 87.6 |
| Sask. | 79.9 | 80.6 | 81.6 | 81.4 | 81.5 | 81.8 | 82.3 | 82.7 | 82.7 | 83.0 | 83.4 | 83.8 | 84.4 | 85.0 | 85.7 | 86.3 | 86.8 | 87.4 | 87.9 |
| Alta. | 79.2 | 80.2 | 81.1 | 81.3 | 81.9 | 82.7 | 83.6 | 83.8 | 83.8 | 84.0 | 84.4 | 84.8 | 85.3 | 86.0 | 86.6 | 87.1 | 87.6 | 88.1 | 88.6 |
| B.C. | 79.7 | 80.7 | 81.4 | 81.8 | 82.6 | 83.2 | 84.3 | 84.6 | 84.6 | 84.8 | 85.0 | 85.4 | 85.8 | 86.4 | 86.9 | 87.5 | 88.0 | 88.4 | 88.9 |
| Y.T. | 73.5 | 74.6 | 75.7 | 76.9 | 78.1 | 79.4 | 80.7 | 82.0 | 82.0 | 82.2 | 82.4 | 82.8 | 83.2 | 83.8 | 84.4 | 84.9 | 85.5 | 86.0 | 86.6 |
| N.W.T. | Note ..: not available for a specific reference period | Note ..: not available for a specific reference period | Note ..: not available for a specific reference period | Note ..: not available for a specific reference period | 78.2 | 78.5 | 78.9 | 79.3 | 79.4 | 79.8 | 80.2 | 80.8 | 81.5 | 82.2 | 83.0 | 83.7 | 84.4 | 85.0 | 85.6 |
| Nvt. | Note ..: not available for a specific reference period | Note ..: not available for a specific reference period | Note ..: not available for a specific reference period | Note ..: not available for a specific reference period | 70.7 | 71.6 | 72.5 | 73.5 | 73.7 | 74.2 | 74.9 | 75.6 | 76.5 | 77.4 | 78.3 | 79.2 | 80.0 | 80.8 | 81.6 |
|
.. not available for a specific reference period Notes: Statistics Canada produces life tables for a three-year reference period. For ease of reading, each stated year refers to the middle of the three-year period. For example, "2016" refers to the period 2015 to 2017. The 2017 data are considered preliminary. The calculation for Canada for 2016 (2015/2017) excludes Yukon. The numbers for Yukon in 2016 are projected. Sources: Statistics Canada. 2019. Life Tables, Canada, Provinces and Territories, catalogue no. 84-537 and Demography Division. |
|||||||||||||||||||
| Sex / Region | 1981 | 1986 | 1991 | 1996 | 2001 | 2006 | 2011 | 2016 | 2017/ 2018 |
2022/ 2023 |
2027/ 2028 |
2032/ 2033 |
2037/ 2038 |
2042/ 2043 |
2047/ 2048 |
2052/ 2053 |
2057/ 2058 |
2062/ 2063 |
2067/ 2068 |
|---|---|---|---|---|---|---|---|---|---|---|---|---|---|---|---|---|---|---|---|
| Males | in years | ||||||||||||||||||
| Canada | 72.0 | 73.3 | 74.5 | 75.4 | 76.9 | 78.1 | 79.4 | 79.9 | 80.3 | 81.6 | 82.7 | 83.6 | 84.3 | 84.9 | 85.6 | 86.2 | 86.8 | 87.4 | 88.0 |
| N.L. | 71.9 | 72.9 | 73.7 | 74.4 | 75.3 | 75.7 | 77.3 | 77.5 | 78.0 | 79.4 | 80.6 | 81.6 | 82.5 | 83.2 | 84.0 | 84.7 | 85.4 | 86.1 | 86.7 |
| P.E.I. | 72.9 | 73.7 | 74.6 | 75.6 | 76.6 | 77.6 | 78.8 | 80.0 | 80.4 | 81.7 | 82.8 | 83.7 | 84.5 | 85.1 | 85.7 | 86.4 | 87.0 | 87.6 | 88.1 |
| N.S. | 71.0 | 72.4 | 73.7 | 74.8 | 76.2 | 76.9 | 78.1 | 78.2 | 78.7 | 80.1 | 81.3 | 82.3 | 83.2 | 83.9 | 84.6 | 85.3 | 86.0 | 86.6 | 87.3 |
| N.B. | 71.1 | 72.6 | 74.2 | 74.8 | 76.2 | 77.4 | 78.4 | 78.6 | 79.0 | 80.4 | 81.6 | 82.7 | 83.5 | 84.2 | 85.0 | 85.7 | 86.3 | 87.0 | 87.6 |
| Que. | 71.2 | 72.2 | 73.7 | 74.6 | 76.3 | 78.0 | 79.5 | 80.6 | 81.0 | 82.3 | 83.3 | 84.2 | 84.9 | 85.4 | 86.1 | 86.7 | 87.3 | 87.8 | 88.4 |
| Ont. | 72.4 | 73.7 | 74.9 | 75.8 | 77.3 | 78.5 | 79.8 | 80.4 | 80.8 | 82.1 | 83.1 | 84.1 | 84.8 | 85.4 | 86.0 | 86.7 | 87.3 | 87.9 | 88.4 |
| Man. | 72.3 | 73.3 | 74.6 | 75.2 | 75.6 | 76.7 | 77.8 | 77.9 | 78.4 | 79.8 | 81.0 | 82.1 | 82.9 | 83.7 | 84.4 | 85.2 | 85.9 | 86.6 | 87.2 |
| Sask. | 72.5 | 73.8 | 75.3 | 75.4 | 76.2 | 76.9 | 77.5 | 77.9 | 78.4 | 79.8 | 81.1 | 82.1 | 83.0 | 83.8 | 84.5 | 85.3 | 86.0 | 86.7 | 87.3 |
| Alta. | 72.2 | 73.7 | 75.0 | 75.9 | 77.1 | 77.9 | 79.1 | 79.2 | 79.6 | 81.0 | 82.2 | 83.2 | 84.0 | 84.7 | 85.4 | 86.1 | 86.8 | 87.4 | 88.0 |
| B.C. | 72.8 | 74.4 | 75.2 | 76.1 | 78.0 | 78.7 | 80.3 | 80.1 | 80.5 | 81.9 | 83.1 | 84.1 | 84.9 | 85.6 | 86.2 | 86.8 | 87.4 | 88.0 | 88.5 |
| Y.T. | 67.2 | 68.2 | 69.3 | 70.5 | 71.6 | 72.9 | 74.1 | 75.5 | 76.0 | 77.5 | 78.8 | 79.9 | 80.9 | 81.7 | 82.6 | 83.4 | 84.2 | 85.0 | 85.7 |
| N.W.T. | Note ..: not available for a specific reference period | Note ..: not available for a specific reference period | Note ..: not available for a specific reference period | Note ..: not available for a specific reference period | 73.0 | 73.7 | 74.5 | 75.2 | 75.7 | 77.2 | 78.6 | 79.7 | 80.7 | 81.5 | 82.4 | 83.2 | 84.0 | 84.8 | 85.5 |
| Nvt. | Note ..: not available for a specific reference period | Note ..: not available for a specific reference period | Note ..: not available for a specific reference period | Note ..: not available for a specific reference period | 67.0 | 68.2 | 69.6 | 71.0 | 71.5 | 73.2 | 74.6 | 76.0 | 77.1 | 78.0 | 79.0 | 79.9 | 80.8 | 81.7 | 82.5 |
| Females | |||||||||||||||||||
| Canada | 79.1 | 79.9 | 80.9 | 81.1 | 81.9 | 82.7 | 83.7 | 84.0 | 84.4 | 85.6 | 86.7 | 87.5 | 88.2 | 88.7 | 89.3 | 89.9 | 90.4 | 90.9 | 91.3 |
| N.L. | 78.8 | 79.2 | 79.5 | 80.2 | 80.6 | 80.7 | 82.1 | 81.7 | 82.1 | 83.5 | 84.7 | 85.7 | 86.6 | 87.2 | 87.9 | 88.5 | 89.1 | 89.7 | 90.2 |
| P.E.I. | 80.5 | 80.9 | 81.4 | 81.8 | 82.3 | 82.8 | 83.3 | 83.8 | 84.2 | 85.5 | 86.6 | 87.5 | 88.2 | 88.7 | 89.3 | 89.9 | 90.4 | 90.9 | 91.4 |
| N.S. | 78.5 | 79.4 | 80.2 | 80.5 | 81.1 | 81.9 | 82.5 | 82.6 | 83.0 | 84.3 | 85.5 | 86.5 | 87.3 | 87.9 | 88.6 | 89.2 | 89.7 | 90.3 | 90.8 |
| N.B. | 79.1 | 80.1 | 80.8 | 81.2 | 81.8 | 82.3 | 83.2 | 82.9 | 83.4 | 84.7 | 85.8 | 86.8 | 87.5 | 88.2 | 88.8 | 89.4 | 89.9 | 90.5 | 91.0 |
| Que. | 78.8 | 79.6 | 80.8 | 81.0 | 81.9 | 82.8 | 83.6 | 84.2 | 84.6 | 85.8 | 86.7 | 87.5 | 88.2 | 88.6 | 89.2 | 89.7 | 90.2 | 90.7 | 91.1 |
| Ont. | 79.1 | 80.0 | 80.9 | 81.2 | 82.0 | 83.0 | 84.0 | 84.4 | 84.8 | 86.0 | 87.0 | 87.8 | 88.4 | 88.9 | 89.4 | 90.0 | 90.5 | 91.0 | 91.5 |
| Man. | 78.9 | 79.9 | 80.7 | 80.5 | 81.1 | 81.6 | 82.1 | 82.1 | 82.6 | 83.9 | 85.1 | 86.1 | 86.9 | 87.6 | 88.2 | 88.9 | 89.5 | 90.1 | 90.6 |
| Sask. | 79.9 | 80.6 | 81.6 | 81.4 | 81.5 | 81.8 | 82.3 | 82.7 | 83.1 | 84.4 | 85.6 | 86.5 | 87.3 | 87.9 | 88.6 | 89.2 | 89.8 | 90.3 | 90.9 |
| Alta. | 79.2 | 80.2 | 81.1 | 81.3 | 81.9 | 82.7 | 83.6 | 83.8 | 84.2 | 85.5 | 86.6 | 87.5 | 88.3 | 88.9 | 89.5 | 90.0 | 90.6 | 91.1 | 91.5 |
| B.C. | 79.7 | 80.7 | 81.4 | 81.8 | 82.6 | 83.2 | 84.3 | 84.6 | 85.0 | 86.2 | 87.2 | 88.1 | 88.8 | 89.3 | 89.8 | 90.4 | 90.9 | 91.3 | 91.8 |
| Y.T. | 73.5 | 74.6 | 75.7 | 76.9 | 78.1 | 79.4 | 80.7 | 82.0 | 82.4 | 83.6 | 84.6 | 85.5 | 86.1 | 86.6 | 87.2 | 87.8 | 88.4 | 89.0 | 89.5 |
| N.W.T. | Note ..: not available for a specific reference period | Note ..: not available for a specific reference period | Note ..: not available for a specific reference period | Note ..: not available for a specific reference period | 78.2 | 78.5 | 78.9 | 79.3 | 79.8 | 81.2 | 82.5 | 83.5 | 84.4 | 85.2 | 85.9 | 86.7 | 87.3 | 88.0 | 88.6 |
| Nvt. | Note ..: not available for a specific reference period | Note ..: not available for a specific reference period | Note ..: not available for a specific reference period | Note ..: not available for a specific reference period | 70.7 | 71.6 | 72.5 | 73.5 | 74.1 | 75.7 | 77.1 | 78.4 | 79.5 | 80.4 | 81.4 | 82.2 | 83.1 | 83.9 | 84.7 |
|
.. not available for a specific reference period Notes: Statistics Canada produces life tables for a three-year reference period. For ease of reading, each stated year refers to the middle of the three-year period. For example, "2016" refers to the period 2015 to 2017. The 2017 data are considered preliminary. The calculation for Canada for 2016 (2015/2017) excludes Yukon. The numbers for Yukon in 2016 are projected. Sources: Statistics Canada. 2019. Life Tables, Canada, Provinces and Territories, catalogue no. 84-537 and Demography Division. |
|||||||||||||||||||
Globally, the projected life expectancies show distinct paths by sex and between the provinces and territories in the short-term but the divergences tend to fade over time, as a result of the coherent projection model. As a result, the projected gap in life expectancy between males and females diminish over time, but male life expectancy never surpasses female life expectancy. The same coherence is observed between the provinces and territories, meaning historical differences between the jurisdictions are maintained.Note
References
Barbi, E., F. Lagona, M. Marsili, J.W. Vaupel and K.W. Wachter. 2018. “The plateau of human mortality: Demography of longevity pioneers”, Science, volume 360, pages 1,459 to 1,461.
Bennett, J.E., G. Li, K. Foreman, N. Best, V. Kontis, C. Pearson, P. Hambly and M. Ezzati. 2015. “The future of life expectancy and life expectancy inequalities in England and Wales: Bayesian spatiotemporal forecasting”, The Lancet, volume 386, pages 163 to 170.
Booth, H. 2006. “Demographic forecasting: 1980 to 2005 in review”, Working Papers in Demography, number 100, The Australian National University, Canberra.
Bourbeau, R. and N. Ouellette. 2016. “Trends, patterns and differentials in Canadian mortality over nearly a century (1921-2011)”, Canadian Studies in Population, volume 43, issue 1-2, pages 48 to 77.
Cardona, C. and D. Bishai. 2018. “The slowing pace of life expectancy gains since 1950” BMC Public Health, volume 18, issue 151.
D’Amato, V., G. Piscopo and M. Russolillio. 2011. “The mortality of the Italian population: Smoothing techniques on the Lee-Carter model”, The Annals of Applied Statistics, volume 5, issue 2A, pages 705 to 724.
Dong, X., B. Milholland and J. Vijg. 2016. “Evidence for a limit to human lifespan”, Nature, volume 538, pages 257 to 259.
Dowell, D., E. Arias, K. Kochanek, R. Anderson, G.P. Guy Jr., J.L. Losby and G. Baldwin. 2017. “Contribution of Opioid-Involved Poisoning to the Change in Life Expectancy in the United States, 2000-2015”, Journal of the American Medical Association, volume 318, issue 11, pages 1,065 to 1,067.
Green, M.A. 2018. “Austerity and the new age of population health?”, Scandinavian Journal of Public Health, volume 46, pages 38 to 41.
Hedegaard, H., M. Warner and A.M. Minino. 2017. “Drug overdose deaths in the United States, 1999-2016”, NCHS Data Brief, Number 294, December 2017.
Hiam, L., D. Harrison, M. McKee and D. Dorling. 2018. “Why is life expectancy in England and Wales ‘stalling’?”, Journal of Epidemiology and Community Health, Epub: doi: 10.1136/jech-2017-210401.
Ho, J.Y. and A.S. Hendi. 2018. “Recent trends in life expectancy across high income countries: retrospective observational study”, British Medical Journal, volume 35, issue K2562.
Jasilionis, D. 2018. “Reversals in life expectancy in high income countries?” British Medical Journal, volume 362, issue K3399.
Keelin, T.W. 2016. “The Metalog Distributions”, Decision Analysis, volume 13, issue 4.
Keelin, T.W. 2018. “The Metalog Distributions – Excel workbook”. http://www.metalogdistributions.com/excelworkbooks.html.
Keilman, N. 2018. “Increasing (but insufficient?) optimism about future life expectancy”, N-IUSSP, October 15 2018, http://www.niussp.org/article/increasing-but-insufficient-optimism-about-future-life/.
Kochanek, K.D., E.A. Arias and B.A. Bastian. 2016. “The effect of changes in selected age-specific causes of death on non-Hispanic white life expectancy between 2000 and 2014”, NCHS Data Brief, number 250, National Center for Health Statistics, June 2016.
Koissi, M.C., A.F. Shapiro and G. Hognas. 2006. “Evaluating and extending Lee-Carter model for mortality forecasting: Bootstrap confidence intervals”, Insurance Mathematics and Economics, volume 38, pages 1 to 20.
Kontis, V., J.E. Bennett, C.D. Mathers, G. Li, K. Foreman and M. Ezzati. 2017. “Future life expectancy in 35 industrialized countries: projections with a Bayesian model ensemble”, The Lancet, volume 389, pages 1,323 to 1,335.
Kulminiski, A.M., I.V. Culminskaya, S.V. Ukrainsteva, K.G. Arbeev, K.C. Land and A.I. Yashin. 2008. “Sex-specific health deterioration and mortality: the morbidity-mortality paradox over age and time”, Experimental Gerontology, volume 43, issue 12, pages 1,052 to 1,057.
Lee, R.D. and L. Carter. 1992. “Modeling and forecasting the time series of U.S. mortality”, Journal of the American Statistical Association, volume 87, pages 659 to 671.
Lee, R. and T. Miller. 2001. “Evaluating the performance of the Lee-Carter method for forecasting mortality”, Demography, volume 38, pages 537 to 549.
Leon, D.A. 2011. “Editorial: Trends in European life expectancy: A salutary view,” International Journal of Epidemiology, volume 40, pages 271 to 277.
Lenart, A. and J.W. Vaupel. 2017. “Questionable evidence for a limit to the human lifespan”, Nature, volume 546, E13-E14.
Li, N. and R. Lee. 2005. “Coherent mortality forecasts for a group of populations: An extension of the Lee-Carter method”, Demography, volume 42, pages 575 to 594.
Liu, X. and W.J. Braun. 2010. “Investigating mortality uncertainty using the block bootstrap”, Journal of Probability and Statistics, volume 2010, pages 1 to 15.
Mayhew, L. and D. Smith, 2015. “On the decomposition of life expectancy and limits to life”, Population Studies, volume 69, issue 1, pages 73 to 89.
Oeppen, J. and J.W. Vaupel. 2002. “Broken limits to life expectancy”, Science, volume 296, issue 70, pages 1,029 to 1,031.
Oeppen, J. and J.W. Vaupel. 2019. “The linear rise in the number of our days”, Old and New Perspectives on Mortality Forecasting, Springer Open Access Books, pages 159 to 166.
Office for National Statistics. 2018. “Changing trends in mortality: an international comparison: 2000 to 2016”, August 7 2018.
Olshansky, S.J., B.A. Carnes and C. Cassel. 1990. “In Search of Methuselah: Estimating the Upper Limits to Human Longevity”, Science, volume 250, pages 634 to 640.
Ortiz-Ospina, E. and D. Beltekian. 2018. “Why do women live longer than men?”, Our World in Data: Blog, https://ourworldindata.org/why-do-women-live-longer-than-men.
Peters, F., C. Bohk-Ewald and R. Rau. 2015. “Correspondence: Future inequalities in life expectancy in England and Wales”, The Lancet, volume 386, page 2,391.
Preston, S.H., A. Stokes, N.K. Mehta and B. Cao. 2014. “Projecting the effect of changes in smoking and obesity on future life expectancy in the United States”, Demography, volume 51, issue 1, pages 27 to 49.
Public Health Agency of Canada. 2018. The Chief Public Health Officer’s Report on the State of Public Health in Canada 2018: Preventing Problematic Substance Use in Youth.
Raleigh, V.S. 2018. “Stalling life expectancy in the UK” British Medical Journal, volume 362, issue K4050.
Shumanty, R. 2018. “Mortality: Overview, 2014 to 2016”, Report on the Demographic Situation in Canada, Statistics Canada catalogue no. 91-209-X.
Singh-Manoux, A., A. Guéguen, J. Ferrie, M. Shipley, P. Martikainen, S. Bonenfant, M. Goldberg and M. Marmot. 2008. “Gender differences in the association between morbidity and mortality among middle-aged men and women”, American Journal of Public Health, volume 98, issue 12, pages 2,251 to 2,257.
Statistics Canada. 2019a. “Changes in life expectancy by selected causes of death, 2017”, The Daily, May 30 2019, https://www150.statcan.gc.ca/n1/daily-quotidien/190530/dq190530d-eng.htm.
Statistics Canada. 2019b. Methods for constructing life tables for Canada, provinces and territories Statistics Canada catalogue no. 84-538-X.
Tuljapurkar, S., N. Li and C. Boe. 2000. “A universal pattern of mortality decline in the G7 countries”, Nature, volume 405, pages 789 to 792.
Vaupel, J., K. Manton and E. Stallard. 1979. “The Impact of Heterogeneity in Individual Frailty on the Dynamics of Mortality”, Demography, volume 16, pages 439 to 454.
Verbrugge, L.M. and D.L. Wingward. 1987. “Sex differentials in health and mortality”, Women and Health Review, volume 12, issue 2, pages 103 to 145.
Ye, X., J. Sutherland, B. Henry, M. Tyndall and P.R.W. Kendall. 2018 “Impact of drug overdose-related deaths on life expectancy at birth in British Columbia”,At-a-Glance, Health Promotion and Chronic Disease Prevention in Canada, volume 38,issue 6, pages 248 to 251.
- Date modified: