
Population Projections for Canada (2018 to 2068), Provinces and Territories (2018 to 2043): Technical Report on Methodology and Assumptions
Chapter 1: General Approach to Assumption Building

Archived Content
Information identified as archived is provided for reference, research or recordkeeping purposes. It is not subject to the Government of Canada Web Standards and has not been altered or updated since it was archived. Please "contact us" to request a format other than those available.
by Patrice Dion and Elham Sirag
Skip to text
Text begins
Introduction
This chapter describes the general approach used to derive projection assumptions for the majority of the demographic components: fertility, immigration, emigration, and non-permanent residents.Note This approach was based around three general goals:
- To take into consideration both short-term and long-term future outcomes in building projection assumptions;
- To allow each province and territory to follow its own specific path in the short term, based on its own recent past;
- To ensure that the provinces and territories follow a convergent pattern in the long term, reflecting the fact that despite differences in year-to-year trends, Canada’s provinces and territories tend to follow a similar pattern over a long-term horizon.
The approach adopted permits each province and territory to follow their own individual assumptions in the short-term, then gradually converge toward the Canada-level long-term assumptions over the span of the projection horizon. This progression is intended to mimic the way demographic components within a country typically evolve over time: over a short horizon, differences between regions may be more pronounced, resulting in (potential) divergences in regional trends; while when observed over a longer period of time, these trends tend to converge more than they diverge.
This method is consistent with the traditional “hybrid bottom-up” approach often used in population projections: assumptions specific to each province and territory are constructed from assumptions initially developed at the national level, but the Canada-level projections exist only by summing the results for the provinces and territories individually. However, in comparison to previous editions, more consideration is given to the way provinces and territories attain the national targets over the course of the projection.
The next sections describe this method in greater detail.
Building medium assumptions
Briefly, medium assumptions for each component are derived as follows:
- Two distinct linear trajectories are produced for the period 2018 to 2043 for each of the provinces and territories: (1) a short-term trajectory based on the examination of historical trends, and (2) a long-term trajectory based on the results from the 2018 Survey of Experts on Future Demographic Trends;
- These two linear trajectories are combined to obtain a single medium assumption, with the use of a logarithmic interpolation technique that allows for a smooth transition.
Short-term trajectory
The short-term trajectory assumes that recent year-to-year changes observed for a given demographic indicator over the last 10 years continue to apply in the future. More specifically, a weighted average of the year-to-year changes throughout the selected reference period (generally, 2007/2008 to 2017/2018) is computed, and is applied over the first 25 years of the projection (2018/2019 to 2042/2043). The weights were set to increase linearly so that the weight applied to the most recent year is twice that of the weight applied to the first year of the selected reference period. This allows changes in more recent years to have a larger influence on expected changes in the near future. This ‘increasing’ weighting scheme was also found to perform slightly better than no weighting in terms of short-term accuracy. Depending on whether the cumulative change is positive or negative, the projected indicator—for example, the projected period total fertility rate (PTFR)—follows either a linearly increasing or linearly decreasing path over the span of the 25-year projection period.
Long-term Trajectory
For the long-term trajectory, results from the 2018 Survey of Experts on Future Demographic TrendsNote are used to obtain medium target values of the PTFR, immigration and emigration rates and the stock of non-permanent residents in 2043. Targets consistent with each of the assumptions are derived in a way that makes use of the probabilistic nature of the information obtained from the survey. For each component, medium targets in 2043 are obtained by taking the median (50th percentile) of the aggregate probability distribution from the survey for that indicator. Values for the intermediary projection years (from 2019 to 2042) are the result of a linear interpolation between current levels and the medium targets in 2043.
Targets are obtained for values at the Canada-level only, which are then used to derive the same proportional medium long-term targets, in terms of percentage growth, for each of the provinces and territories.
Final Assumptions
Final medium assumptions for the provinces and territories are obtained by combining the short- and long-term trajectories. Logarithmic interpolation of the two curves yields a single assumption, with weights selected so that the curve based on the short-term trajectory is given more weight earlier on in the projection years, and the curve based on the long-term trajectory is given more weight in the latter years.Note The consequence is that in the short-term, assumptions for a given province will reflect mostly recently observed trends, whereas in the long-term, they will be more influenced by beliefs about future trends at the Canada-level. Using logarithmic interpolation, instead of linear interpolation for example, ensures that the short-term trajectory fades relatively quickly in favor of the long-term trajectory. This was deemed preferable given the generally poor performance of time series model in the long-term for demographic forecasting. After 2043, assumptions are held constant for the remainder of the projection (to 2068).
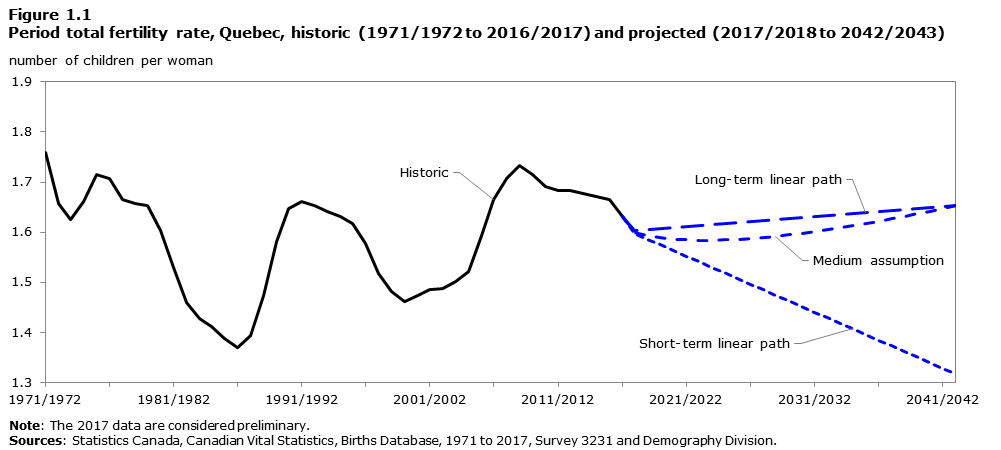
Figure 1.1 provides an example of the projected PTFR in Quebec according to the short-term trajectory, long-term trajectory and final medium assumption. The short-term trajectory projects a linear decrease in the PTFR based on the decreasing trend observed in the historical reference period. In the long-term trajectory, results from the 2018 Survey of Experts on Future Demographic Trends indicate an expected increase in the PTFR for Canada as a whole in the long term; this expected increase is applied in proportion to Quebec. The final medium assumption reflects both of these possible trajectories with varying weights—in the short term, the assumption is more influenced by the decrease observed in the short-term curve, while in the medium- to long-term, it rises to reflect the anticipated increase envisioned by the experts.
Description for Figure 1.1
| Period | Historic | Projected | ||
|---|---|---|---|---|
| Short-term linear path | Long-term linear path | Medium assumption | ||
| number of children per woman | ||||
| 1971/1972 | 1.76 | Note ..: not available for a specific reference period | Note ..: not available for a specific reference period | Note ..: not available for a specific reference period |
| 1972/1973 | 1.66 | Note ..: not available for a specific reference period | Note ..: not available for a specific reference period | Note ..: not available for a specific reference period |
| 1973/1974 | 1.63 | Note ..: not available for a specific reference period | Note ..: not available for a specific reference period | Note ..: not available for a specific reference period |
| 1974/1975 | 1.66 | Note ..: not available for a specific reference period | Note ..: not available for a specific reference period | Note ..: not available for a specific reference period |
| 1975/1976 | 1.71 | Note ..: not available for a specific reference period | Note ..: not available for a specific reference period | Note ..: not available for a specific reference period |
| 1976/1977 | 1.71 | Note ..: not available for a specific reference period | Note ..: not available for a specific reference period | Note ..: not available for a specific reference period |
| 1977/1978 | 1.67 | Note ..: not available for a specific reference period | Note ..: not available for a specific reference period | Note ..: not available for a specific reference period |
| 1978/1979 | 1.66 | Note ..: not available for a specific reference period | Note ..: not available for a specific reference period | Note ..: not available for a specific reference period |
| 1979/1980 | 1.65 | Note ..: not available for a specific reference period | Note ..: not available for a specific reference period | Note ..: not available for a specific reference period |
| 1980/1981 | 1.60 | Note ..: not available for a specific reference period | Note ..: not available for a specific reference period | Note ..: not available for a specific reference period |
| 1981/1982 | 1.53 | Note ..: not available for a specific reference period | Note ..: not available for a specific reference period | Note ..: not available for a specific reference period |
| 1982/1983 | 1.46 | Note ..: not available for a specific reference period | Note ..: not available for a specific reference period | Note ..: not available for a specific reference period |
| 1983/1984 | 1.43 | Note ..: not available for a specific reference period | Note ..: not available for a specific reference period | Note ..: not available for a specific reference period |
| 1984/1985 | 1.41 | Note ..: not available for a specific reference period | Note ..: not available for a specific reference period | Note ..: not available for a specific reference period |
| 1985/1986 | 1.39 | Note ..: not available for a specific reference period | Note ..: not available for a specific reference period | Note ..: not available for a specific reference period |
| 1986/1987 | 1.37 | Note ..: not available for a specific reference period | Note ..: not available for a specific reference period | Note ..: not available for a specific reference period |
| 1987/1988 | 1.39 | Note ..: not available for a specific reference period | Note ..: not available for a specific reference period | Note ..: not available for a specific reference period |
| 1988/1989 | 1.47 | Note ..: not available for a specific reference period | Note ..: not available for a specific reference period | Note ..: not available for a specific reference period |
| 1989/1990 | 1.58 | Note ..: not available for a specific reference period | Note ..: not available for a specific reference period | Note ..: not available for a specific reference period |
| 1990/1991 | 1.65 | Note ..: not available for a specific reference period | Note ..: not available for a specific reference period | Note ..: not available for a specific reference period |
| 1991/1992 | 1.66 | Note ..: not available for a specific reference period | Note ..: not available for a specific reference period | Note ..: not available for a specific reference period |
| 1992/1993 | 1.65 | Note ..: not available for a specific reference period | Note ..: not available for a specific reference period | Note ..: not available for a specific reference period |
| 1993/1994 | 1.64 | Note ..: not available for a specific reference period | Note ..: not available for a specific reference period | Note ..: not available for a specific reference period |
| 1994/1995 | 1.63 | Note ..: not available for a specific reference period | Note ..: not available for a specific reference period | Note ..: not available for a specific reference period |
| 1995/1996 | 1.62 | Note ..: not available for a specific reference period | Note ..: not available for a specific reference period | Note ..: not available for a specific reference period |
| 1996/1997 | 1.58 | Note ..: not available for a specific reference period | Note ..: not available for a specific reference period | Note ..: not available for a specific reference period |
| 1997/1998 | 1.52 | Note ..: not available for a specific reference period | Note ..: not available for a specific reference period | Note ..: not available for a specific reference period |
| 1998/1999 | 1.48 | Note ..: not available for a specific reference period | Note ..: not available for a specific reference period | Note ..: not available for a specific reference period |
| 1999/2000 | 1.46 | Note ..: not available for a specific reference period | Note ..: not available for a specific reference period | Note ..: not available for a specific reference period |
| 2000/2001 | 1.47 | Note ..: not available for a specific reference period | Note ..: not available for a specific reference period | Note ..: not available for a specific reference period |
| 2001/2002 | 1.48 | Note ..: not available for a specific reference period | Note ..: not available for a specific reference period | Note ..: not available for a specific reference period |
| 2002/2003 | 1.49 | Note ..: not available for a specific reference period | Note ..: not available for a specific reference period | Note ..: not available for a specific reference period |
| 2003/2004 | 1.50 | Note ..: not available for a specific reference period | Note ..: not available for a specific reference period | Note ..: not available for a specific reference period |
| 2004/2005 | 1.52 | Note ..: not available for a specific reference period | Note ..: not available for a specific reference period | Note ..: not available for a specific reference period |
| 2005/2006 | 1.59 | Note ..: not available for a specific reference period | Note ..: not available for a specific reference period | Note ..: not available for a specific reference period |
| 2006/2007 | 1.66 | Note ..: not available for a specific reference period | Note ..: not available for a specific reference period | Note ..: not available for a specific reference period |
| 2007/2008 | 1.71 | Note ..: not available for a specific reference period | Note ..: not available for a specific reference period | Note ..: not available for a specific reference period |
| 2008/2009 | 1.73 | Note ..: not available for a specific reference period | Note ..: not available for a specific reference period | Note ..: not available for a specific reference period |
| 2009/2010 | 1.71 | Note ..: not available for a specific reference period | Note ..: not available for a specific reference period | Note ..: not available for a specific reference period |
| 2010/2011 | 1.69 | Note ..: not available for a specific reference period | Note ..: not available for a specific reference period | Note ..: not available for a specific reference period |
| 2011/2012 | 1.68 | Note ..: not available for a specific reference period | Note ..: not available for a specific reference period | Note ..: not available for a specific reference period |
| 2012/2013 | 1.68 | Note ..: not available for a specific reference period | Note ..: not available for a specific reference period | Note ..: not available for a specific reference period |
| 2013/2014 | 1.68 | Note ..: not available for a specific reference period | Note ..: not available for a specific reference period | Note ..: not available for a specific reference period |
| 2014/2015 | 1.67 | Note ..: not available for a specific reference period | Note ..: not available for a specific reference period | Note ..: not available for a specific reference period |
| 2015/2016 | 1.67 | Note ..: not available for a specific reference period | Note ..: not available for a specific reference period | Note ..: not available for a specific reference period |
| 2016/2017 | 1.63 | Note ..: not available for a specific reference period | Note ..: not available for a specific reference period | Note ..: not available for a specific reference period |
| 2017/2018 | Note ..: not available for a specific reference period | 1.60 | 1.60 | 1.60 |
| 2018/2019 | Note ..: not available for a specific reference period | 1.59 | 1.61 | 1.59 |
| 2019/2020 | Note ..: not available for a specific reference period | 1.57 | 1.61 | 1.59 |
| 2020/2021 | Note ..: not available for a specific reference period | 1.56 | 1.61 | 1.59 |
| 2021/2022 | Note ..: not available for a specific reference period | 1.55 | 1.61 | 1.58 |
| 2022/2023 | Note ..: not available for a specific reference period | 1.54 | 1.61 | 1.58 |
| 2023/2024 | Note ..: not available for a specific reference period | 1.53 | 1.62 | 1.58 |
| 2024/2025 | Note ..: not available for a specific reference period | 1.52 | 1.62 | 1.58 |
| 2025/2026 | Note ..: not available for a specific reference period | 1.51 | 1.62 | 1.59 |
| 2026/2027 | Note ..: not available for a specific reference period | 1.50 | 1.62 | 1.59 |
| 2027/2028 | Note ..: not available for a specific reference period | 1.49 | 1.62 | 1.59 |
| 2028/2029 | Note ..: not available for a specific reference period | 1.47 | 1.63 | 1.59 |
| 2029/2030 | Note ..: not available for a specific reference period | 1.46 | 1.63 | 1.59 |
| 2030/2031 | Note ..: not available for a specific reference period | 1.45 | 1.63 | 1.60 |
| 2031/2032 | Note ..: not available for a specific reference period | 1.44 | 1.63 | 1.60 |
| 2032/2033 | Note ..: not available for a specific reference period | 1.43 | 1.63 | 1.60 |
| 2033/2034 | Note ..: not available for a specific reference period | 1.42 | 1.64 | 1.61 |
| 2034/2035 | Note ..: not available for a specific reference period | 1.41 | 1.64 | 1.61 |
| 2035/2036 | Note ..: not available for a specific reference period | 1.40 | 1.64 | 1.62 |
| 2036/2037 | Note ..: not available for a specific reference period | 1.38 | 1.64 | 1.62 |
| 2037/2038 | Note ..: not available for a specific reference period | 1.37 | 1.64 | 1.63 |
| 2038/2039 | Note ..: not available for a specific reference period | 1.36 | 1.65 | 1.63 |
| 2039/2040 | Note ..: not available for a specific reference period | 1.35 | 1.65 | 1.64 |
| 2040/2041 | Note ..: not available for a specific reference period | 1.34 | 1.65 | 1.64 |
| 2041/2042 | Note ..: not available for a specific reference period | 1.33 | 1.65 | 1.65 |
| 2042/2043 | Note ..: not available for a specific reference period | 1.32 | 1.65 | 1.65 |
|
.. not available for a specific reference period Note: The 2017 data are considered preliminary. Sources: Statistics Canada, Canadian Vital Statistics, Births Database, 1971 to 2017, Survey 3231 and Demography Division. |
||||
Building low and high assumptions
Low and high assumptions were built based on the medium assumption described above and targets reflecting the uncertainty of experts. The low assumption long-term target (for 2043), was computed by taking the 10th percentile of the aggregate probability distribution of experts, and the high long-term target, was computed by taking the 90th percentile. Thus, low and high long-term targets represent the bounds of an 80% prediction interval around the medium long-term target. To construct trajectories for the low and high assumptions, the medium assumption was modified to reach the desired target in 2043 so that the distance from the medium path increases following a logarithmic curve; faster at the beginning of the projection and slower as the projection advances. This approach was used to better mimic how uncertainty unveils in the short-term.Note
Evolution of age-and-sex-specific rates
Historical data were not used solely to project the global path of a demographic indicator (e.g., PTFR), but also to project changes in the age- and sex- schedule of rates, or, in the case of immigration, in the geographic distribution of new immigrants. It is easy to translate the changes in the projected demographic indicators into changes at age-specific values because the former is simply the sum of the latter (for instance, the PTFR is the sum of age-specific fertility rates). Age-specific values are projected by forecasting age-specific patterns of changes in a manner so as to reflect historical changes in the beginning of the projection but becoming less and less informative over time and thus, restricting the extent of changes to the age schedule over the course of the projection. This means, for instance, that aging of the fertility schedule observed in recent years continues up to a point in the projection but does not continue indefinitely. This was done by using a logarithmic interpolation of two distinct vectors of age-specific patterns of change, similarly to the method used for construction of the medium assumption: one reflecting ten years of historical change, and one that is proportional to the age schedule of the rates. The result is that recent historical changes leave a diminishing mark on projected rates over time. Again, this method was used to take into account information from the recent past without giving it overdue importance for the long-term.Note
Advantages of the current approach
One of the key advantages of this new approach to assumption-building is its consistency across components; with the exception of mortality and interprovincial migration, assumptions for all other demographic components are built in the exact same manner.Note This leads to greater coherence in the resulting projection scenarios (which combine assumptions about the various components). For instance, across the majority of components, the long-term projection assumptions share the same probabilistic meaning: the “high” assumption represents the 90th percentile of the aggregate probability distribution of plausible future values for that indicator according to the experts who responded to the survey; the “medium” assumption represents the 50th percentile, and the “low” assumption the 10th percentile.
Another advantage of the current approach is that the way assumptions are derived in the short-term results in more plausible short-term evolutions for the individual provinces and territories, and evolutions of the patterns by age and sex. This follows best practices in projections (UNECE 2018) and results in more relevant projections for users most interested in projections of the short-term future and/or of a particular province or territory. By allowing for the continuation of recent provincial and territorial trends in the short term, with gradual convergence toward national targets in the long-term, the potential occurrence of “shocks”— i.e., abrupt changes in demographic behaviour such as sharp increases or decreases necessary to bring provincial/territorial levels toward national targets over the span of the projection horizon—is greatly reduced. As a result, individual provinces and territories experience more plausible transitions over the course of the projection.
The approach also offers an improved representation of the uncertainty of the projections. Despite the fact that these projections are not probabilistic, the construction of deterministic low and high assumptions uses fully probabilistic information from the expert survey. The resulting range between low and high values reflect expert’s possibly asymmetric views of their uncertainty about the future evolution of a demographic indicator. The methods implemented for these projections therefore provide an enriched and more plausible representation of uncertainty propagation for the different demographic components of growth.
Finally, the current approach facilitates the production of annual projection updates, a product which are in high demand by projection users. Every year, an additional year of historical data would simply shift the 10-year reference period forward one year, and the same long-term low, medium and high targets obtained from the 2018 survey could be applied one year later in the projection span. The re-computation of intermediary targets is straightforward, and follows exactly as is outlined above. This method thus allows for consistency in the way projections are produced on a quinquennial versus annual basis.
References
Lee, R.D. 1998. “Probabilistic approaches to population forecasting”, Population and Development Review, volume 24, pages 156 to 190.
United Nations Economic Commission for Europe. 2018. “Recommendations on Communicating Population Projections”, prepared by the Task Force on Population Projections, United Nations, New York and Geneva.
- Date modified: