
Annual Demographic Estimates: Canada, Provinces and Territories, 2020
Analysis: Population by age and sex
Skip to text
Text begins
The first case of COVID-19 in Canada was confirmed in late January 2020. The pandemic then gained momentum and led to the introduction of international border restrictions beginning in mid-March. Given that the reference period for the most recent annual estimates is from July 1, 2019, to June 30, 2020, the last three months of the period were mostly affected by the COVID-19 pandemic, particularly international migration and, to a lesser degree, deaths.
To understand the potential effects of the COVID-19 pandemic, a more in-depth analysis of the age–sex structure of immigrants and non-permanent residents was done. The age pyramids of these subpopulations remained similar to the previous year, as did their average ages, which follow the trends of recent years.
Special attention was also given to the population aged 80 and older, given that 72% (6,164)Note 1 of Canadians whose death was related to COVID-19 were in this age group. By comparison, 50.2% of deaths estimated in 2019/2020 were in the 80-and-over group. Despite the excess mortality observed among the very elderly as a result of the pandemic,Note 2 the estimated population aged 80 and older rose by 38,758 to 1,663,666 on July 1, 2020. This growth is driven by the large number of people aged 79 on July 1, 2019, who were still alive the following year (188,994), which considerably exceeded the number of estimated deaths among people aged 80 and older during the same period (150,609). In addition, the average age (86.1 years) of those 80 and over has remained stable over the past four years. Since international migration is less common at these ages, it does not have a strong impact on the growth of the population aged 80 and older. In short, the excess mortality among people 80 years and older did not cause a decline in their population, because the growth of the cohorts due to aging was greater than the impact of the excess deaths.
Lastly, despite the direct and indirect effects of the COVID-19 pandemic on several factors of the population growth (see the section Analysis: Total population), the average age of the Canadian population in 2020 followed the same upward trend as found in the population aging process.
In sum, COVID-19 had a limited impact on the age and sex profile of the population of Canada for the year 2019/2020.
For the purposes of this article, various indicators are used to measure population aging. These include the number, proportion and distribution of the population aged 0 to 14 years and 65 years and older, the demographic dependency ratio, and the average age. The average age of a population is the average age of all its members.
This section presents an analysis of the population estimates by age and sex for Canada, the provinces and territories on July 1, 2020, compared with July 1 estimates in previous years.
The aging of baby boomers accelerates Canada’s population aging
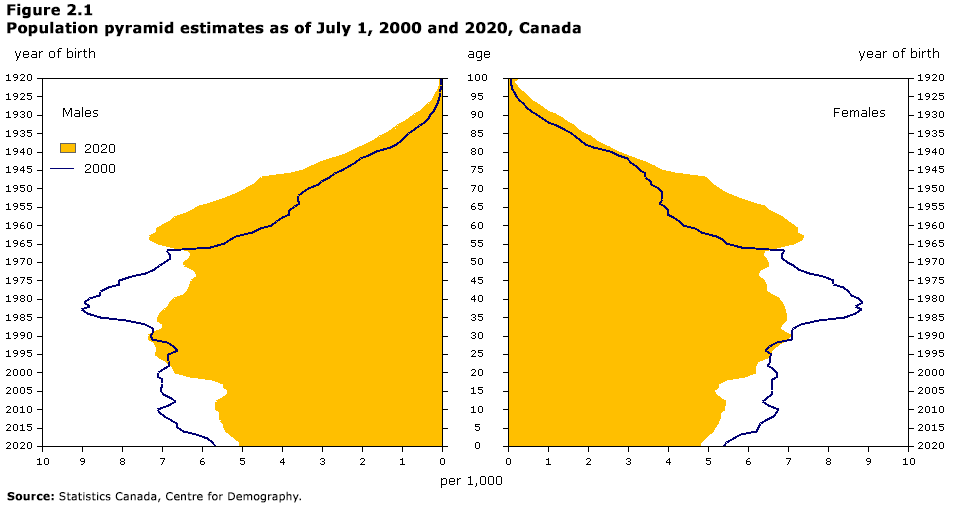
Population aging represents one of the major changes associated with Canada’s age–sex structure, and it continues to shape Canada’s society and economy. It is the result of baby boomers—cohorts born between 1946 and 1965—reaching more advanced ages, combined with a fertility rate below the replacement level (2.1 children per woman) since 1972Note 3 and a quasi-continuous increase in life expectancy for both men and women.Note 4
The population pyramid opposite (Figure 2.1) shows the aging of Canada’s population in recent decades by comparing the age–sex structure of the Canadian population on July 1 of 2000 and 2020. On July 1, 2000, baby boomers were in their 30s to mid-50s, as can be seen in the bulge in the pyramid at these ages. On July 1, 2020, individuals in the baby boom generation were between 54 and 74 years of age, as illustrated by the upward shift in the largest bulge in the pyramid observed 20 years earlier. Therefore, the number of people aged 54 and over was proportionally higher in 2020 (33.3%) than in 2000 (22.9%). In contrast, the number of younger people particularly people in their mid-30s to late 40s, as well as individuals aged 0 to 19, has proportionally decreased.
Description for Figure 2.1
This stacked column graph or population pyramid compares the age structure of the 2000 and the 2020 population at July 1st in relative value.
The left side shows males and the right side shows females.
The horizontal axis shows the population in relative value and the vertical axis shows age.
| Age | 2000 | 2020 | ||
|---|---|---|---|---|
| Males | Females | Males | Females | |
| per thousand | ||||
| 0 | 5.7 | 5.4 | 5.0 | 4.8 |
| 1 | 5.7 | 5.5 | 5.0 | 4.8 |
| 2 | 5.9 | 5.6 | 5.2 | 4.9 |
| 3 | 6.1 | 5.8 | 5.3 | 5.0 |
| 4 | 6.5 | 6.2 | 5.4 | 5.1 |
| 5 | 6.6 | 6.3 | 5.4 | 5.2 |
| 6 | 6.6 | 6.3 | 5.5 | 5.2 |
| 7 | 6.8 | 6.4 | 5.5 | 5.3 |
| 8 | 6.9 | 6.6 | 5.5 | 5.3 |
| 9 | 7.1 | 6.7 | 5.5 | 5.3 |
| 10 | 7.1 | 6.8 | 5.6 | 5.4 |
| 11 | 6.8 | 6.5 | 5.7 | 5.4 |
| 12 | 6.7 | 6.4 | 5.6 | 5.4 |
| 13 | 6.8 | 6.5 | 5.5 | 5.3 |
| 14 | 7.0 | 6.6 | 5.4 | 5.2 |
| 15 | 7.0 | 6.6 | 5.3 | 5.1 |
| 16 | 7.0 | 6.6 | 5.4 | 5.2 |
| 17 | 7.0 | 6.6 | 5.5 | 5.3 |
| 18 | 7.0 | 6.6 | 5.7 | 5.5 |
| 19 | 7.1 | 6.7 | 6.3 | 5.9 |
| 20 | 7.1 | 6.7 | 6.7 | 6.2 |
| 21 | 6.9 | 6.6 | 6.7 | 6.2 |
| 22 | 6.8 | 6.5 | 6.8 | 6.2 |
| 23 | 6.8 | 6.6 | 6.9 | 6.2 |
| 24 | 6.8 | 6.5 | 7.1 | 6.5 |
| 25 | 6.8 | 6.6 | 7.2 | 6.6 |
| 26 | 6.6 | 6.4 | 7.1 | 6.6 |
| 27 | 6.7 | 6.5 | 7.1 | 6.7 |
| 28 | 6.9 | 6.7 | 7.2 | 6.8 |
| 29 | 7.2 | 7.1 | 7.3 | 7.0 |
| 30 | 7.3 | 7.1 | 7.3 | 7.1 |
| 31 | 7.2 | 7.1 | 7.1 | 6.9 |
| 32 | 7.2 | 7.1 | 7.0 | 6.8 |
| 33 | 7.4 | 7.3 | 7.0 | 6.8 |
| 34 | 7.9 | 7.8 | 7.1 | 6.9 |
| 35 | 8.5 | 8.4 | 7.1 | 7.0 |
| 36 | 8.9 | 8.7 | 7.0 | 6.9 |
| 37 | 9.0 | 8.8 | 6.9 | 6.9 |
| 38 | 8.8 | 8.7 | 6.8 | 6.9 |
| 39 | 8.9 | 8.9 | 6.8 | 6.8 |
| 40 | 8.8 | 8.8 | 6.7 | 6.8 |
| 41 | 8.6 | 8.6 | 6.5 | 6.6 |
| 42 | 8.5 | 8.5 | 6.4 | 6.5 |
| 43 | 8.3 | 8.4 | 6.3 | 6.5 |
| 44 | 8.1 | 8.1 | 6.3 | 6.4 |
| 45 | 8.1 | 8.1 | 6.3 | 6.4 |
| 46 | 7.8 | 7.9 | 6.1 | 6.3 |
| 47 | 7.4 | 7.5 | 6.1 | 6.2 |
| 48 | 7.2 | 7.3 | 6.2 | 6.3 |
| 49 | 7.1 | 7.1 | 6.4 | 6.5 |
| 50 | 6.9 | 7.0 | 6.4 | 6.5 |
| 51 | 6.8 | 6.9 | 6.3 | 6.4 |
| 52 | 6.8 | 6.8 | 6.3 | 6.4 |
| 53 | 6.9 | 6.9 | 6.3 | 6.4 |
| 54 | 5.8 | 5.8 | 6.7 | 6.7 |
| 55 | 5.4 | 5.5 | 7.1 | 7.1 |
| 56 | 5.3 | 5.4 | 7.3 | 7.3 |
| 57 | 5.2 | 5.2 | 7.3 | 7.4 |
| 58 | 4.7 | 4.8 | 7.1 | 7.2 |
| 59 | 4.5 | 4.7 | 7.1 | 7.2 |
| 60 | 4.3 | 4.4 | 7.0 | 7.1 |
| 61 | 4.1 | 4.3 | 6.8 | 7.0 |
| 62 | 4.0 | 4.1 | 6.7 | 6.9 |
| 63 | 3.8 | 4.0 | 6.5 | 6.7 |
| 64 | 3.8 | 4.0 | 6.2 | 6.5 |
| 65 | 3.7 | 3.9 | 6.1 | 6.4 |
| 66 | 3.6 | 3.8 | 5.8 | 6.1 |
| 67 | 3.6 | 3.9 | 5.5 | 5.8 |
| 68 | 3.6 | 3.9 | 5.2 | 5.6 |
| 69 | 3.5 | 3.9 | 5.1 | 5.4 |
| 70 | 3.3 | 3.8 | 4.9 | 5.3 |
| 71 | 3.1 | 3.6 | 4.7 | 5.1 |
| 72 | 3.0 | 3.6 | 4.6 | 5.0 |
| 73 | 2.8 | 3.4 | 4.5 | 4.9 |
| 74 | 2.7 | 3.4 | 3.8 | 4.2 |
| 75 | 2.5 | 3.3 | 3.5 | 3.8 |
| 76 | 2.3 | 3.2 | 3.3 | 3.7 |
| 77 | 2.2 | 3.1 | 3.0 | 3.4 |
| 78 | 2.0 | 3.0 | 2.7 | 3.2 |
| 79 | 1.8 | 2.8 | 2.5 | 3.0 |
| 80 | 1.6 | 2.6 | 2.3 | 2.7 |
| 81 | 1.3 | 2.1 | 2.1 | 2.5 |
| 82 | 1.1 | 1.9 | 1.9 | 2.4 |
| 83 | 1.0 | 1.8 | 1.7 | 2.2 |
| 84 | 0.9 | 1.7 | 1.6 | 2.1 |
| 85 | 0.8 | 1.6 | 1.4 | 1.9 |
| 86 | 0.7 | 1.4 | 1.2 | 1.7 |
| 87 | 0.6 | 1.2 | 1.1 | 1.6 |
| 88 | 0.4 | 1.0 | 1.0 | 1.5 |
| 89 | 0.3 | 0.9 | 0.8 | 1.4 |
| 90 | 0.3 | 0.7 | 0.7 | 1.2 |
| 91 | 0.2 | 0.6 | 0.5 | 1.0 |
| 92 | 0.2 | 0.5 | 0.4 | 0.9 |
| 93 | 0.1 | 0.4 | 0.3 | 0.7 |
| 94 | 0.1 | 0.3 | 0.2 | 0.6 |
| 95 | 0.1 | 0.2 | 0.2 | 0.5 |
| 96 | 0.0 | 0.2 | 0.1 | 0.4 |
| 97 | 0.0 | 0.1 | 0.1 | 0.3 |
| 98 | 0.0 | 0.1 | 0.1 | 0.2 |
| 99 | 0.0 | 0.1 | 0.0 | 0.1 |
| 100 and older | 0.0 | 0.1 | 0.1 | 0.2 |
| Source: Statistics Canada, Centre for Demography. | ||||
The gap widens between children and seniors
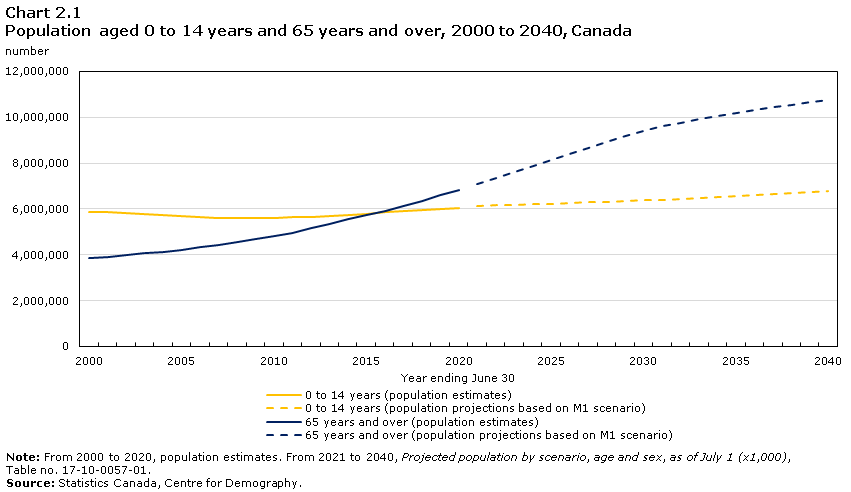
Since 2011, baby boomers have played a significant role in shifting the number of people aged 65 and older upward. In fact, people aged 65 and older outnumbered children aged 0 to 14 between July 1, 2015, and July 1, 2016. During the last annual period, the gap between these two age groups continued to widen. On July 1, 2020, a record number of Canadians (6,835,866, or 18.0% of the population) was at least 65 years of age.
By comparison, there were 6,038,647 children aged 0 to 14 (15.9%) in Canada. This number is increasing, but since the number of seniors is growing faster than the number of children, the population share of children has decreased in recent years. By comparison, prior to 1987, there were two to three times more children aged 0 to 14 than people aged 65 and older. According to the medium growth (M1) scenario in the most recent population projections,Note 5 the proportion of people aged 65 and older should exceed 20% between July 1, 2024, and July 1, 2025, and reach 25% in 2058/2059, while the proportion of children aged 0 to 14 should remain relatively stable at around 15% to 16% over the same period.
Data table for Chart 2.1
| Year ending June 30 | 0 to 14 years (population estimates) | 0 to 14 years (population projections based on M1 scenario) | 65 years and over (population estimates) | 65 years and over (population projections based on M1 scenario) |
|---|---|---|---|---|
| number | ||||
| 2000 | 5,883,491 | Note ..: not available for a specific reference period | 3,851,253 | Note ..: not available for a specific reference period |
| 2001 | 5,851,142 | Note ..: not available for a specific reference period | 3,921,849 | Note ..: not available for a specific reference period |
| 2002 | 5,826,792 | Note ..: not available for a specific reference period | 3,989,384 | Note ..: not available for a specific reference period |
| 2003 | 5,792,083 | Note ..: not available for a specific reference period | 4,060,711 | Note ..: not available for a specific reference period |
| 2004 | 5,751,912 | Note ..: not available for a specific reference period | 4,136,349 | Note ..: not available for a specific reference period |
| 2005 | 5,697,557 | Note ..: not available for a specific reference period | 4,213,993 | Note ..: not available for a specific reference period |
| 2006 | 5,648,161 | Note ..: not available for a specific reference period | 4,318,906 | Note ..: not available for a specific reference period |
| 2007 | 5,621,320 | Note ..: not available for a specific reference period | 4,421,379 | Note ..: not available for a specific reference period |
| 2008 | 5,616,339 | Note ..: not available for a specific reference period | 4,541,116 | Note ..: not available for a specific reference period |
| 2009 | 5,620,154 | Note ..: not available for a specific reference period | 4,669,325 | Note ..: not available for a specific reference period |
| 2010 | 5,622,173 | Note ..: not available for a specific reference period | 4,804,015 | Note ..: not available for a specific reference period |
| 2011 | 5,628,821 | Note ..: not available for a specific reference period | 4,955,235 | Note ..: not available for a specific reference period |
| 2012 | 5,660,294 | Note ..: not available for a specific reference period | 5,154,937 | Note ..: not available for a specific reference period |
| 2013 | 5,704,052 | Note ..: not available for a specific reference period | 5,352,983 | Note ..: not available for a specific reference period |
| 2014 | 5,752,008 | Note ..: not available for a specific reference period | 5,542,326 | Note ..: not available for a specific reference period |
| 2015 | 5,793,833 | Note ..: not available for a specific reference period | 5,722,237 | Note ..: not available for a specific reference period |
| 2016 | 5,865,824 | Note ..: not available for a specific reference period | 5,920,968 | Note ..: not available for a specific reference period |
| 2017 | 5,912,118 | Note ..: not available for a specific reference period | 6,135,028 | Note ..: not available for a specific reference period |
| 2018 | 5,966,263 | Note ..: not available for a specific reference period | 6,355,561 | Note ..: not available for a specific reference period |
| 2019 | 6,006,483 | Note ..: not available for a specific reference period | 6,595,070 | Note ..: not available for a specific reference period |
| 2020 | 6,038,647 | Note ..: not available for a specific reference period | 6,835,866 | Note ..: not available for a specific reference period |
| 2021 | Note ..: not available for a specific reference period | 6,118,900 | Note ..: not available for a specific reference period | 7,081,700 |
| 2022 | Note ..: not available for a specific reference period | 6,155,600 | Note ..: not available for a specific reference period | 7,337,300 |
| 2023 | Note ..: not available for a specific reference period | 6,181,400 | Note ..: not available for a specific reference period | 7,599,500 |
| 2024 | Note ..: not available for a specific reference period | 6,205,900 | Note ..: not available for a specific reference period | 7,861,600 |
| 2025 | Note ..: not available for a specific reference period | 6,230,700 | Note ..: not available for a specific reference period | 8,129,500 |
| 2026 | Note ..: not available for a specific reference period | 6,261,300 | Note ..: not available for a specific reference period | 8,398,400 |
| 2027 | Note ..: not available for a specific reference period | 6,289,600 | Note ..: not available for a specific reference period | 8,657,400 |
| 2028 | Note ..: not available for a specific reference period | 6,317,900 | Note ..: not available for a specific reference period | 8,921,500 |
| 2029 | Note ..: not available for a specific reference period | 6,347,400 | Note ..: not available for a specific reference period | 9,175,300 |
| 2030 | Note ..: not available for a specific reference period | 6,377,800 | Note ..: not available for a specific reference period | 9,406,700 |
| 2031 | Note ..: not available for a specific reference period | 6,409,000 | Note ..: not available for a specific reference period | 9,600,000 |
| 2032 | Note ..: not available for a specific reference period | 6,443,000 | Note ..: not available for a specific reference period | 9,761,600 |
| 2033 | Note ..: not available for a specific reference period | 6,476,100 | Note ..: not available for a specific reference period | 9,911,500 |
| 2034 | Note ..: not available for a specific reference period | 6,513,800 | Note ..: not available for a specific reference period | 10,057,400 |
| 2035 | Note ..: not available for a specific reference period | 6,552,600 | Note ..: not available for a specific reference period | 10,200,900 |
| 2036 | Note ..: not available for a specific reference period | 6,592,900 | Note ..: not available for a specific reference period | 10,337,500 |
| 2037 | Note ..: not available for a specific reference period | 6,635,300 | Note ..: not available for a specific reference period | 10,451,300 |
| 2038 | Note ..: not available for a specific reference period | 6,679,700 | Note ..: not available for a specific reference period | 10,551,900 |
| 2039 | Note ..: not available for a specific reference period | 6,726,600 | Note ..: not available for a specific reference period | 10,647,200 |
| 2040 | Note ..: not available for a specific reference period | 6,776,100 | Note ..: not available for a specific reference period | 10,745,300 |
|
.. not available for a specific reference period Note: From 2000 to 2020, population estimates. From 2021 to 2040, Projected population by scenario, age and sex, as of July 1 (x1,000), Table no. 17-10-0057-01. Source: Statistics Canada, Centre for Demography. |
||||

Data table for Chart 2.2
| Year ending June 30 | 0 to 14 years (population estimates) | 0 to 14 years (population projections based on M1 scenario) | 15 to 64 years (population estimates) | 15 to 64 years (population projections based on M1 scenario) | 65 years and over (population estimates) | 65 years and over (population projections based on M1 scenario) |
|---|---|---|---|---|---|---|
| percent | ||||||
| 2000 | 19.2 | Note ..: not available for a specific reference period | 68.3 | Note ..: not available for a specific reference period | 12.6 | Note ..: not available for a specific reference period |
| 2001 | 18.9 | Note ..: not available for a specific reference period | 68.5 | Note ..: not available for a specific reference period | 12.6 | Note ..: not available for a specific reference period |
| 2002 | 18.6 | Note ..: not available for a specific reference period | 68.7 | Note ..: not available for a specific reference period | 12.7 | Note ..: not available for a specific reference period |
| 2003 | 18.3 | Note ..: not available for a specific reference period | 68.9 | Note ..: not available for a specific reference period | 12.8 | Note ..: not available for a specific reference period |
| 2004 | 18.0 | Note ..: not available for a specific reference period | 69.0 | Note ..: not available for a specific reference period | 13.0 | Note ..: not available for a specific reference period |
| 2005 | 17.7 | Note ..: not available for a specific reference period | 69.3 | Note ..: not available for a specific reference period | 13.1 | Note ..: not available for a specific reference period |
| 2006 | 17.3 | Note ..: not available for a specific reference period | 69.4 | Note ..: not available for a specific reference period | 13.3 | Note ..: not available for a specific reference period |
| 2007 | 17.1 | Note ..: not available for a specific reference period | 69.5 | Note ..: not available for a specific reference period | 13.4 | Note ..: not available for a specific reference period |
| 2008 | 16.9 | Note ..: not available for a specific reference period | 69.4 | Note ..: not available for a specific reference period | 13.7 | Note ..: not available for a specific reference period |
| 2009 | 16.7 | Note ..: not available for a specific reference period | 69.4 | Note ..: not available for a specific reference period | 13.9 | Note ..: not available for a specific reference period |
| 2010 | 16.5 | Note ..: not available for a specific reference period | 69.3 | Note ..: not available for a specific reference period | 14.1 | Note ..: not available for a specific reference period |
| 2011 | 16.4 | Note ..: not available for a specific reference period | 69.2 | Note ..: not available for a specific reference period | 14.4 | Note ..: not available for a specific reference period |
| 2012 | 16.3 | Note ..: not available for a specific reference period | 68.8 | Note ..: not available for a specific reference period | 14.8 | Note ..: not available for a specific reference period |
| 2013 | 16.3 | Note ..: not available for a specific reference period | 68.5 | Note ..: not available for a specific reference period | 15.3 | Note ..: not available for a specific reference period |
| 2014 | 16.2 | Note ..: not available for a specific reference period | 68.1 | Note ..: not available for a specific reference period | 15.6 | Note ..: not available for a specific reference period |
| 2015 | 16.2 | Note ..: not available for a specific reference period | 67.7 | Note ..: not available for a specific reference period | 16.0 | Note ..: not available for a specific reference period |
| 2016 | 16.2 | Note ..: not available for a specific reference period | 67.4 | Note ..: not available for a specific reference period | 16.4 | Note ..: not available for a specific reference period |
| 2017 | 16.2 | Note ..: not available for a specific reference period | 67.0 | Note ..: not available for a specific reference period | 16.8 | Note ..: not available for a specific reference period |
| 2018 | 16.1 | Note ..: not available for a specific reference period | 66.8 | Note ..: not available for a specific reference period | 17.1 | Note ..: not available for a specific reference period |
| 2019 | 16.0 | Note ..: not available for a specific reference period | 66.5 | Note ..: not available for a specific reference period | 17.5 | Note ..: not available for a specific reference period |
| 2020 | 15.9 | Note ..: not available for a specific reference period | 66.1 | Note ..: not available for a specific reference period | 18.0 | Note ..: not available for a specific reference period |
| 2021 | Note ..: not available for a specific reference period | 16.0 | Note ..: not available for a specific reference period | 65.5 | Note ..: not available for a specific reference period | 18.5 |
| 2022 | Note ..: not available for a specific reference period | 15.9 | Note ..: not available for a specific reference period | 65.1 | Note ..: not available for a specific reference period | 19.0 |
| 2023 | Note ..: not available for a specific reference period | 15.8 | Note ..: not available for a specific reference period | 64.8 | Note ..: not available for a specific reference period | 19.4 |
| 2024 | Note ..: not available for a specific reference period | 15.7 | Note ..: not available for a specific reference period | 64.4 | Note ..: not available for a specific reference period | 19.9 |
| 2025 | Note ..: not available for a specific reference period | 15.6 | Note ..: not available for a specific reference period | 64.0 | Note ..: not available for a specific reference period | 20.4 |
| 2026 | Note ..: not available for a specific reference period | 15.5 | Note ..: not available for a specific reference period | 63.6 | Note ..: not available for a specific reference period | 20.8 |
| 2027 | Note ..: not available for a specific reference period | 15.4 | Note ..: not available for a specific reference period | 63.3 | Note ..: not available for a specific reference period | 21.3 |
| 2028 | Note ..: not available for a specific reference period | 15.4 | Note ..: not available for a specific reference period | 62.9 | Note ..: not available for a specific reference period | 21.7 |
| 2029 | Note ..: not available for a specific reference period | 15.3 | Note ..: not available for a specific reference period | 62.6 | Note ..: not available for a specific reference period | 22.1 |
| 2030 | Note ..: not available for a specific reference period | 15.2 | Note ..: not available for a specific reference period | 62.3 | Note ..: not available for a specific reference period | 22.5 |
| 2031 | Note ..: not available for a specific reference period | 15.2 | Note ..: not available for a specific reference period | 62.1 | Note ..: not available for a specific reference period | 22.7 |
| 2032 | Note ..: not available for a specific reference period | 15.1 | Note ..: not available for a specific reference period | 62.0 | Note ..: not available for a specific reference period | 22.9 |
| 2033 | Note ..: not available for a specific reference period | 15.1 | Note ..: not available for a specific reference period | 61.9 | Note ..: not available for a specific reference period | 23.0 |
| 2034 | Note ..: not available for a specific reference period | 15.0 | Note ..: not available for a specific reference period | 61.8 | Note ..: not available for a specific reference period | 23.2 |
| 2035 | Note ..: not available for a specific reference period | 15.0 | Note ..: not available for a specific reference period | 61.7 | Note ..: not available for a specific reference period | 23.3 |
| 2036 | Note ..: not available for a specific reference period | 14.9 | Note ..: not available for a specific reference period | 61.6 | Note ..: not available for a specific reference period | 23.4 |
| 2037 | Note ..: not available for a specific reference period | 14.9 | Note ..: not available for a specific reference period | 61.6 | Note ..: not available for a specific reference period | 23.5 |
| 2038 | Note ..: not available for a specific reference period | 14.9 | Note ..: not available for a specific reference period | 61.6 | Note ..: not available for a specific reference period | 23.5 |
| 2039 | Note ..: not available for a specific reference period | 14.9 | Note ..: not available for a specific reference period | 61.5 | Note ..: not available for a specific reference period | 23.6 |
| 2040 | Note ..: not available for a specific reference period | 14.9 | Note ..: not available for a specific reference period | 61.5 | Note ..: not available for a specific reference period | 23.6 |
|
.. not available for a specific reference period Note: From 2000 to 2020, population estimates. From 2021 to 2040, Projected population by scenario, age and sex, as of July 1 (x1,000), Table no. 17-10-0057-01. Source: Statistics Canada, Centre for Demography. |
||||||
Moreover, during the last annual period, the growth rate of the 65-and-over group was 3.6%, more than triple the growth rate of the population as a whole (1.1%). Children aged 0 to 14 had a growth rate of 0.5% in the same annual period. Since the beginning of the period covered by the current demographic accounting system (1971), the population growth rate for children has always remained lower than that of seniors, thereby contributing to population aging.
Children still outnumber seniors in the Prairies and the territories
Population aging affects all regions of the country. However, this process is playing out at an unequal pace, and certain provinces are aging faster than others. Consequently, the proportion of people aged 65 and older and that of children aged 0 to 14 varies significantly from east to west and from north to south of the country.
In Canada’s eastern and central provinces and in British Columbia, the proportion of people 65 years and older was higher than the proportion of children 0 to 14 years on July 1, 2020. However, the Prairie provinces and the territories presented the opposite situation, with a higher proportion of children aged 0 to 14 than people 65 years and older. In 2009, Nova Scotia and New Brunswick were the top two provinces where the proportion of people aged 65 and older exceeded that of children aged 0 to 14.
On July 1, 2020, Newfoundland and Labrador had the highest proportion of people aged 65 and older (22.3%). This proportion rose 7.2 percentage points in 10 years, the largest increase among the provinces and territories. Conversely, Alberta (13.8%) had the lowest proportion of people aged 65 years and older among the provinces. As for the proportion of children aged 0 to 14 among the provinces, the highest was observed in Saskatchewan (19.6%) and the lowest in Newfoundland and Labrador (13.4%). These gaps are due to differences in the fertility rate between these two provinces.
The age structure of the population of the territories differs from that of the provinces. Higher fertilityNote 6 and mortalityNote 7Note 8 explain why the population share of children is especially larger than that of seniors. Nunavut stood out in particular, with children aged 0 to 14 making up 31.7% (close to one in three people) of the population and a low proportion of people aged 65 and older (4.0% - less than one in every 20 people).
Two in five baby boomers are 65 and older
Like the rest of the population, the baby-boom cohorts are aging. Moreover, 40.6% of baby boomers were 65 and older in 2020, compared with 35.7% in 2019. In 2031, the last of the baby boomers will have turned 65.
The demographic composition of the 65-and-older age group is changing rapidly. Before 2011, there were no members of the baby boom generation in this group. Since 2011, as the first baby boomers started turning 65, growth of this group has clearly accelerated. Consequently, on July 1, 2020, baby boomers made up 55.6% of seniors. However, their population share is decreasing, falling below the 25% mark (24.6%) in the last year. Given their advancing age, they become more and more at risk of dying.
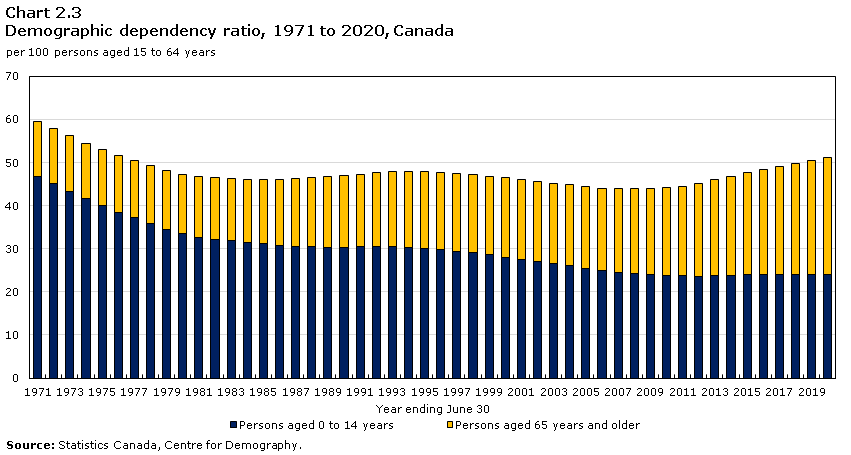
Canada has just over one child or senior for every two working-age people
The demographic dependency ratio represents the number of children (0 to 14 years) and seniors (65 years and older) per 100 working-age people (15 to 64 years). On July 1, 2020, the ratio was 51.2. This indicator has been rising steadily since reaching a record low in 2007 and 2008 (44.0 each). It will continue to rise beyond 2031, when the youngest baby boomers will turn 65. Indeed, according to the medium growth (M1) scenario in the most recent population projections, the demographic dependency ratio should be 61.0 in 2031 and 67.8 in 2068.
Data table for Chart 2.3
| Year ending June 30 | Persons aged 0 to 14 years | Persons aged 65 years and older |
|---|---|---|
| per 100 persons aged 15 to 64 years | ||
| 1971 | 46.7 | 12.8 |
| 1972 | 45.0 | 12.8 |
| 1973 | 43.3 | 12.9 |
| 1974 | 41.6 | 12.9 |
| 1975 | 40.1 | 12.9 |
| 1976 | 38.5 | 13.1 |
| 1977 | 37.2 | 13.2 |
| 1978 | 35.8 | 13.4 |
| 1979 | 34.6 | 13.7 |
| 1980 | 33.5 | 13.9 |
| 1981 | 32.7 | 14.1 |
| 1982 | 32.2 | 14.2 |
| 1983 | 31.8 | 14.4 |
| 1984 | 31.5 | 14.6 |
| 1985 | 31.1 | 15.0 |
| 1986 | 30.7 | 15.3 |
| 1987 | 30.6 | 15.7 |
| 1988 | 30.5 | 16.0 |
| 1989 | 30.4 | 16.3 |
| 1990 | 30.4 | 16.6 |
| 1991 | 30.5 | 16.9 |
| 1992 | 30.6 | 17.1 |
| 1993 | 30.6 | 17.4 |
| 1994 | 30.4 | 17.5 |
| 1995 | 30.1 | 17.7 |
| 1996 | 29.9 | 17.9 |
| 1997 | 29.5 | 18.0 |
| 1998 | 29.1 | 18.2 |
| 1999 | 28.6 | 18.3 |
| 2000 | 28.1 | 18.4 |
| 2001 | 27.5 | 18.5 |
| 2002 | 27.0 | 18.5 |
| 2003 | 26.6 | 18.6 |
| 2004 | 26.1 | 18.8 |
| 2005 | 25.5 | 18.9 |
| 2006 | 25.0 | 19.1 |
| 2007 | 24.6 | 19.4 |
| 2008 | 24.3 | 19.7 |
| 2009 | 24.1 | 20.0 |
| 2010 | 23.8 | 20.4 |
| 2011 | 23.7 | 20.9 |
| 2012 | 23.7 | 21.6 |
| 2013 | 23.7 | 22.3 |
| 2014 | 23.8 | 23.0 |
| 2015 | 24.0 | 23.7 |
| 2016 | 24.1 | 24.3 |
| 2017 | 24.1 | 25.0 |
| 2018 | 24.1 | 25.7 |
| 2019 | 24.0 | 26.4 |
| 2020 | 24.0 | 27.2 |
| Source: Statistics Canada, Centre for Demography. | ||
Given their numbers, baby boomers have always had a tangible impact on the demographic dependency ratio. In 1971, the beginning of the period covered by the current demographic accounting system, a good number of baby boomers were still children. At that time, the demographic dependency ratio was 59.5. However, as the baby boomers reached adulthood, that ratio gradually dropped and remained low from 1980 to 2011, while all members of this generation were of working age. The recent increase in the demographic dependency ratio is explained by the baby boomers turning 65.
The number of people aged 55 to 64 per 100 youth aged 15 to 24 is increasing
People aged 55 to 64 are often on the cusp of, or in retirement. In contrast, generally speaking, individuals aged 15 to 24 have recently, or are about to enter the labour market for the first time. On July 1, 2020, there were 116 people potentially leaving the labour market for every 100 potential entrants. These persons aged 55 to 64 years consist of the youngest baby boomers. By comparison, in 1984, Canada had two people aged 15 to 24 per person aged 55 to 64. Subsequent years were marked by a steady decrease in this ratio, such that starting in 2013, the number of people potentially leaving outnumbered the number of those potentially entering the labour market.
The demographic dependency ratio varies from one province and territory to another
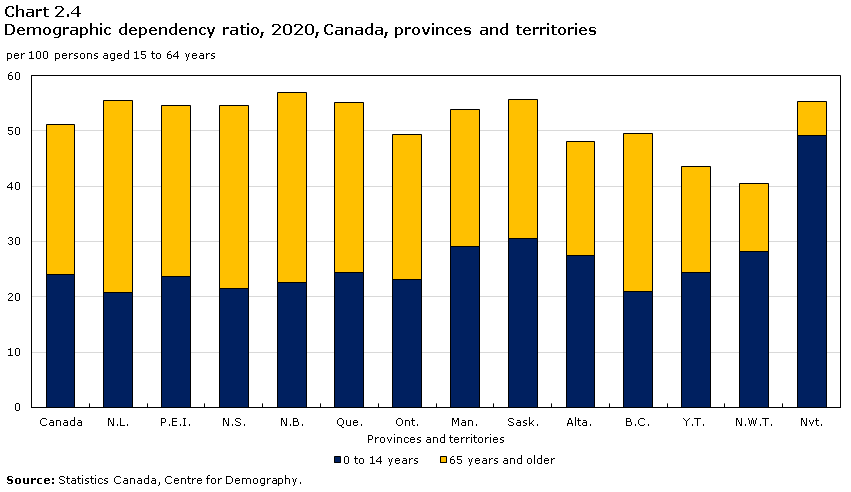
In 2020, the Atlantic provinces and Quebec had a higher demographic dependency ratio than Canada (51.2) as a result of an increasing number of people aged 65 and older. Moreover, the demographic dependency ratio was also higher than that of the country in Manitoba (53.9) and in Saskatchewan (55.7). This situation was mainly due to the slightly higher proportion of children aged 0 to 14 in these provinces. Lastly, Nunavut (55.4) stood out from the other jurisdictions with the highest ratio of children and the lowest ratio of seniors.
Data table for Chart 2.4
| Provinces and territories | 0 to 14 years | 65 years and older |
|---|---|---|
| per 100 persons aged 15 to 64 years | ||
| Canada | 24.0 | 27.2 |
| N.L. | 20.8 | 34.6 |
| P.E.I. | 23.6 | 30.9 |
| N.S. | 21.6 | 33.0 |
| N.B. | 22.5 | 34.4 |
| Que. | 24.5 | 30.6 |
| Ont. | 23.1 | 26.3 |
| Man. | 29.2 | 24.7 |
| Sask. | 30.5 | 25.2 |
| Alta. | 27.6 | 20.5 |
| B.C. | 20.9 | 28.7 |
| Y.T. | 24.5 | 19.2 |
| N.W.T. | 28.2 | 12.4 |
| Nvt. | 49.2 | 6.2 |
| Source: Statistics Canada, Centre for Demography. | ||
| Population | 0 to 14 years | 15 to 64 years | 65 years and over | Median age | Average age | |
|---|---|---|---|---|---|---|
| number | % | years | ||||
| Canada | 38,005,238 | 15.9 | 66.1 | 18.0 | 40.9 | 41.4 |
| Newfoundland and Labrador | 522,103 | 13.4 | 64.3 | 22.3 | 47.4 | 44.8 |
| Prince Edward Island | 159,625 | 15.3 | 64.7 | 20.0 | 42.9 | 42.4 |
| Nova Scotia | 979,351 | 14.0 | 64.7 | 21.3 | 45.0 | 43.8 |
| New Brunswick | 781,476 | 14.3 | 63.7 | 21.9 | 46.1 | 44.3 |
| Quebec | 8,574,571 | 15.8 | 64.5 | 19.7 | 42.7 | 42.6 |
| Ontario | 14,734,014 | 15.5 | 66.9 | 17.6 | 40.4 | 41.2 |
| Manitoba | 1,379,263 | 18.9 | 65.0 | 16.1 | 37.6 | 39.1 |
| Saskatchewan | 1,178,681 | 19.6 | 64.2 | 16.2 | 37.8 | 39.2 |
| Alberta | 4,421,876 | 18.6 | 67.6 | 13.8 | 37.5 | 38.5 |
| British Columbia | 5,147,712 | 14.0 | 66.9 | 19.2 | 42.2 | 42.6 |
| Yukon | 42,052 | 17.0 | 69.6 | 13.3 | 39.4 | 39.6 |
| Northwest Territories | 45,161 | 20.0 | 71.1 | 8.8 | 35.5 | 36.1 |
| Nunavut | 39,353 | 31.7 | 64.3 | 4.0 | 26.2 | 28.5 |
Source: Statistics Canada, Centre for Demography. |
||||||
The number of centenarians is growing rapidly
On July 1, 2020, preliminary estimates indicate that there were 11,517 centenarians in Canada. The number of centenarians in Canada is constantly growing mainly as a result of higher life expectancy.
Since 2001,Note 9 the number of centenarians has more than tripled. In the latest annual period, the growth rate of centenarians was 10.4%, or nearly 10 times the growth rate for the entire population (1.1%). Population growth of centenarians was greater than that of each five-year population age group.
In relative numbers, there were 30 centenarians per 100,000 population in Canada. In 2001, the proportion was 11 centenarians per 100,000 population. Because women have a higher life expectancy than men, the vast majority of centenarians were women (81.3%).
Population aging among women higher
The main population aging indicators are all higher for females. On July 1, 2020, the proportion of women 65 and older (19.3%) was higher than the corresponding proportion of men (16.7%), though the gap has been narrowing since 1998. The average age was also higher for women (42.3 years) than for men (40.6 years). Furthermore, the centenarian group was comprised mostly of women (81.3%). These differences are mainly due to the fact that women, at all ages, have lower mortality levels than men. These mortality levels create a persistent yet narrowing gap in life expectancy in favour of females. The most recent data (2016 to 2018) show that the life expectancy at birth of females was 84.1 years, compared with 79.9 years for males, with females living an average of 4.2 years longer than males. Twenty years earlier, this gap was 5.6 years.Note 10
The average age of the Canadian population continues to increase
In 2020, the average ageNote 11 of Canadians was 41.4 years. The average age has increased by 4.1 years since 2000, when it was 37.3 years.
Average age varies considerably from province to province. On July 1, 2020, there was a difference of 6.3 years between the province with the highest average age (44.8 years in Newfoundland and Labrador) and the province with the lowest average age (38.5 years in Alberta). Taking the territories into consideration, Nunavut had the lowest average age, with 28.5 years.
In 2000, the differences between the provinces were much smaller, with a gap of 3.2 years. The highest average age was in Nova Scotia (38.3 years) and the lowest in Alberta (35.1 years).
The situation in Newfoundland and Labrador indicates an especially rapid aging of its population. In just a little over 15 years, the average age in the province went from the lowest (32.5 in 1989) to the highest (40.4 years in 2006 and tied with Nova Scotia) in the country. During most of the period, Newfoundland and Labrador saw negative population growth. The main contributing factor is the departure of many young adults to other provinces and territories. Consequently, the province registered fewer births.
Conversely, the Prairie provinces topped the list of the youngest provinces on July 1, 2020, with an average age of 38.5 years in Alberta, 39.1 years in Manitoba and 39.2 years in Saskatchewan. This is mainly due to a higher proportion of Indigenous populations (Manitoba, Saskatchewan),Note 12 who are generally younger and with higher fertility rates, as well as a greater migratory inflow of young adults and families from other provinces and countries (Alberta).

Data table for Chart 2.5
| 1980 | 1985 | 1990 | 1995 | 2000 | 2005 | 2010 | 2015 | 2020 | |
|---|---|---|---|---|---|---|---|---|---|
| N.L. | |||||||||
| Average Age | 29.2 | 30.9 | 32.9 | 35.0 | 37.7 | 39.9 | 41.5 | 43.1 | 44.8 |
| Rank | 1 | 1 | 2 | 2 | 6 | 9 | 10 | 9 | 10 |
| P.E.I. | |||||||||
| Average Age | 33.0 | 34.1 | 35.1 | 36.1 | 37.6 | 39.3 | 40.9 | 42.3 | 42.4 |
| Rank | 6 | 6 | 5 | 6 | 5 | 5 | 7 | 7 | 5 |
| N.S. | |||||||||
| Average Age | 33.0 | 34.2 | 35.4 | 36.7 | 38.3 | 40.0 | 41.5 | 43.1 | 43.8 |
| Rank | 6 | 7 | 8 | 10 | 10 | 10 | 10 | 9 | 8 |
| N.B. | |||||||||
| Average Age | 31.9 | 33.4 | 34.9 | 36.4 | 38.1 | 39.9 | 41.5 | 43.2 | 44.3 |
| Rank | 3 | 3 | 3 | 7 | 9 | 9 | 10 | 10 | 9 |
| Que. | |||||||||
| Average Age | 32.6 | 34.1 | 35.5 | 36.6 | 38.1 | 39.5 | 40.7 | 41.7 | 42.6 |
| Rank | 4 | 6 | 9 | 8 | 9 | 7 | 6 | 5 | 7 |
| Ont. | |||||||||
| Average Age | 33.5 | 34.6 | 35.3 | 36.1 | 37.1 | 38.2 | 39.4 | 40.6 | 41.2 |
| Rank | 8 | 9 | 7 | 6 | 4 | 3 | 4 | 4 | 4 |
| Man. | |||||||||
| Average Age | 33.7 | 34.5 | 35.3 | 36.0 | 37.0 | 37.9 | 38.5 | 38.8 | 39.1 |
| Rank | 9 | 8 | 7 | 4 | 2 | 2 | 2 | 3 | 2 |
| Sask. | |||||||||
| Average Age | 33.4 | 33.8 | 35.0 | 36.0 | 37.1 | 38.3 | 38.7 | 38.8 | 39.2 |
| Rank | 7 | 4 | 4 | 4 | 4 | 4 | 3 | 3 | 3 |
| Alta. | |||||||||
| Average Age | 30.5 | 31.5 | 32.7 | 33.9 | 35.1 | 36.3 | 36.9 | 37.4 | 38.5 |
| Rank | 2 | 2 | 1 | 1 | 1 | 1 | 1 | 1 | 1 |
| B.C. | |||||||||
| Average Age | 33.9 | 35.1 | 36.1 | 36.7 | 37.9 | 39.5 | 40.6 | 41.8 | 42.6 |
| Rank | 10 | 10 | 10 | 10 | 7 | 7 | 5 | 6 | 7 |
| Source: Statistics Canada, Centre for Demography. | |||||||||
Men slightly outnumbered by women
On July 1, 2020, the sex ratio for the entire Canadian population was estimated at 98.8 males per 100 females. This ratio has been rising very slowly since 2000 (98.1). Males outnumber females up to the mid-30s, mainly because of the sex ratio at birth, which averages 105 males per 100 females. When people reach their early 60s, the number of men starts to fall significantly below the number of women because of excess mortality among males. This gap widens at more advanced ages: in the 65-to-79 age group, there were an estimated 91.7 males per 100 females on July 1, 2020. However, the gap between the sexes seems to be narrowing over time. Thirty years ago, the sex ratio for people aged 65 to 79 was 78.1 males per 100 females. Among the 80-and-over population, there were an estimated 67.9 men per 100 women on July 1, 2020, compared with a sex ratio of 52.1 on July 1, 1990. On July 1, 2020, centenarians were predominantly female, with a ratio of 23.0 males per 100 females.
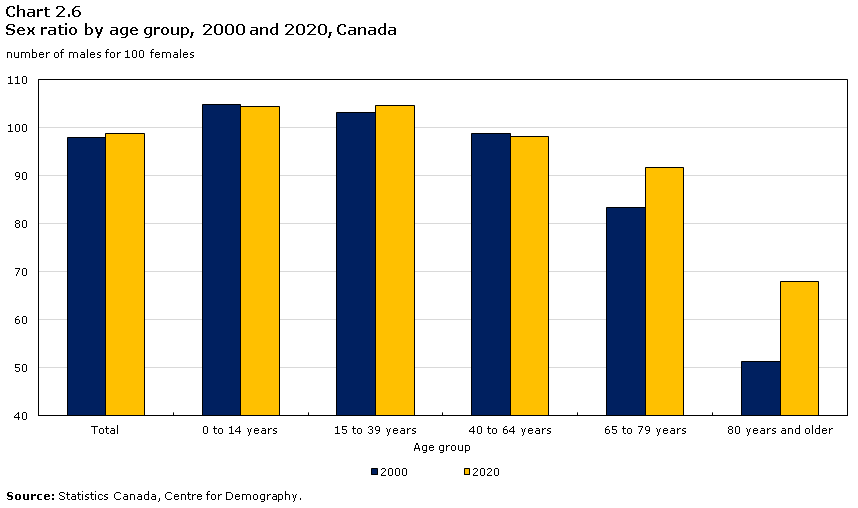
Data table for Chart 2.6
| Age group | 2000 | 2020 |
|---|---|---|
| number of males for 100 females | ||
| Total | 98.1 | 98.8 |
| 0 to 14 years | 105.0 | 104.6 |
| 15 to 39 years | 103.2 | 104.7 |
| 40 to 64 years | 98.8 | 98.2 |
| 65 to 79 years | 83.5 | 91.7 |
| 80 years and older | 51.3 | 67.9 |
| Source: Statistics Canada, Centre for Demography. | ||
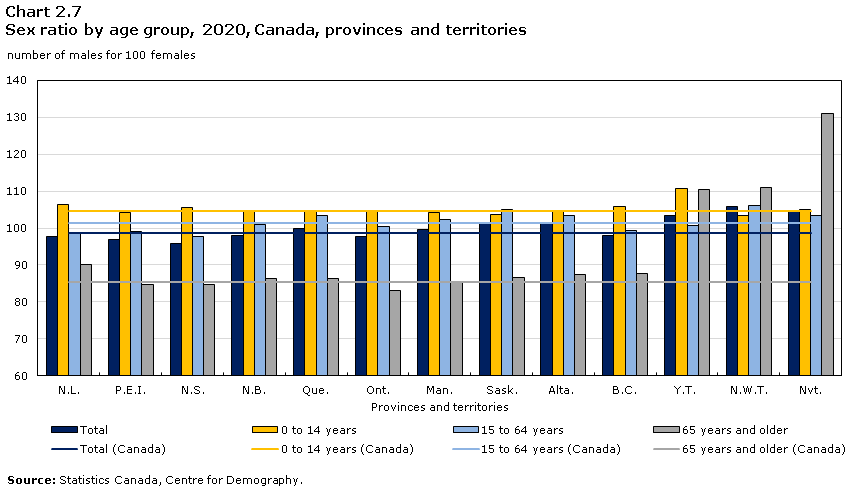
The sex ratio is lower in the Atlantic provinces and higher in the Prairie provinces
There are some regional differences in the sex structure of the population in Canada. On July 1, 2020, the province with the lowest sex ratio in the country was Nova Scotia, with 95.9 males per 100 females, and the highest sex ratio was in Saskatchewan (101.5 males per 100 females). The sex ratios in the Atlantic provinces were below the national average (98.8 males per 100 females), while in the Prairie provinces and in Quebec, they were all higher. Among other factors, this situation can be attributed to differences in the aging of Canada’s regions: a younger population is usually a slightly more masculine population, and an older population is usually a more feminine population.
In 2020, males outnumbered females in all the territories because they are home to younger populations than elsewhere in Canada. The main differences between the sex structure in the territories and in Canada as a whole are at higher ages. At age 65 and older, Yukon and the Northwest Territories had 110.5 and 110.9 males per 100 females, respectively, compared with 85.3 males per 100 females nationally. In Nunavut, it was even higher, with 131.0 males per 100 females.
Data table for Chart 2.7
| Provinces and territories | Total | 0 to 14 years | 15 to 64 years | 65 years and older | Total (Canada) | 0 to 14 years (Canada) | 15 to 64 years (Canada) | 65 years and older (Canada) |
|---|---|---|---|---|---|---|---|---|
| number of males for 100 females | ||||||||
| N.L. | 97.7 | 106.5 | 98.6 | 90.2 | 98.8 | 104.6 | 101.4 | 85.3 |
| P.E.I. | 96.8 | 104.2 | 99.1 | 84.8 | 98.8 | 104.6 | 101.4 | 85.3 |
| N.S. | 95.9 | 105.6 | 97.8 | 84.7 | 98.8 | 104.6 | 101.4 | 85.3 |
| N.B. | 98.0 | 104.4 | 100.9 | 86.4 | 98.8 | 104.6 | 101.4 | 85.3 |
| Que. | 100.0 | 104.4 | 103.5 | 86.3 | 98.8 | 104.6 | 101.4 | 85.3 |
| Ont. | 97.7 | 104.4 | 100.4 | 83.0 | 98.8 | 104.6 | 101.4 | 85.3 |
| Man. | 99.7 | 104.1 | 102.3 | 85.2 | 98.8 | 104.6 | 101.4 | 85.3 |
| Sask. | 101.5 | 103.5 | 105.0 | 86.7 | 98.8 | 104.6 | 101.4 | 85.3 |
| Alta. | 101.1 | 104.4 | 103.3 | 87.5 | 98.8 | 104.6 | 101.4 | 85.3 |
| B.C. | 97.8 | 105.7 | 99.4 | 87.6 | 98.8 | 104.6 | 101.4 | 85.3 |
| Y.T. | 103.5 | 110.6 | 100.5 | 110.5 | 98.8 | 104.6 | 101.4 | 85.3 |
| N.W.T. | 105.9 | 103.4 | 106.1 | 110.9 | 98.8 | 104.6 | 101.4 | 85.3 |
| Nvt. | 104.8 | 104.9 | 103.4 | 131.0 | 98.8 | 104.6 | 101.4 | 85.3 |
| Source: Statistics Canada, Centre for Demography. | ||||||||
Mobile individuals are much younger than the entire population
The population pyramid opposite highlights the differences in the age–sex structure of interprovincial migrants, new immigrants, non-permanent residents and the total population.Note 13 On July 1, 2020, the proportion of the working-age population (aged 15 to 64) was considerably higher among immigrants (79.5%), interprovincial migrants (77.3%) and non-permanent residents (95.1%) than among the total population (66.1%). These subgroups also had a high concentration of young adults. A majority of non-permanent residents (60.6%) were between 18 and 29 years of age. Immigrants were slightly older compared to the latter, and less concentrated in some age groups, since 66.4% were in the 20-to-44 group. Lastly, 54.9% of interprovincial migrants were aged 20 to 44. Similarly, the average age of interprovincial migrants (33.8 years), non-permanent residents (28.1 years) and immigrants (30.5 years) was lower than the average age of the Canadian population (41.4 years) on July 1, 2020.

Description for Figure 2.2
This stacked column graph or population pyramid compares the age structure of total population and of non-permanent residents as of July 1st, 2020, as well as of interprovincial migrants and immigrants who migrated between July 1st, 2019 and June 30th, 2020, in relative value.
The left side shows males and the right side shows females.
The horizontal axis shows the population in relative value and the vertical axis shows age.
| Age | Interprovincial migrants | Non-permanent residents | Immigrants | Total population | ||||
|---|---|---|---|---|---|---|---|---|
| Males | Females | Males | Females | Males | Females | Males | Females | |
| per thousand | ||||||||
| 0 | 3.8 | 3.3 | 0.0 | 0.0 | 0.6 | 0.6 | 5.0 | 4.8 |
| 1 | 7.8 | 6.6 | 0.3 | 0.3 | 5.2 | 5.0 | 5.0 | 4.8 |
| 2 | 7.5 | 6.6 | 0.6 | 0.6 | 5.9 | 6.0 | 5.2 | 4.9 |
| 3 | 7.2 | 6.5 | 0.9 | 0.9 | 7.2 | 6.9 | 5.3 | 5.0 |
| 4 | 6.8 | 6.3 | 1.1 | 1.0 | 7.3 | 6.8 | 5.4 | 5.1 |
| 5 | 6.4 | 6.0 | 1.4 | 1.3 | 7.4 | 7.2 | 5.4 | 5.2 |
| 6 | 5.9 | 5.7 | 1.7 | 1.6 | 6.9 | 6.9 | 5.5 | 5.2 |
| 7 | 5.5 | 5.4 | 1.9 | 1.8 | 7.1 | 6.5 | 5.5 | 5.3 |
| 8 | 5.1 | 5.0 | 2.0 | 1.9 | 6.8 | 6.4 | 5.5 | 5.3 |
| 9 | 4.6 | 4.6 | 2.1 | 1.9 | 6.6 | 5.9 | 5.5 | 5.3 |
| 10 | 4.3 | 4.2 | 2.1 | 1.9 | 5.9 | 5.8 | 5.6 | 5.4 |
| 11 | 4.0 | 3.9 | 2.2 | 1.9 | 6.0 | 5.0 | 5.7 | 5.4 |
| 12 | 3.7 | 3.7 | 2.1 | 1.9 | 5.4 | 5.1 | 5.6 | 5.4 |
| 13 | 3.6 | 3.6 | 2.1 | 2.0 | 4.9 | 4.7 | 5.5 | 5.3 |
| 14 | 3.6 | 3.6 | 2.4 | 2.1 | 4.6 | 4.3 | 5.4 | 5.2 |
| 15 | 3.8 | 3.9 | 3.4 | 3.2 | 4.5 | 4.1 | 5.3 | 5.1 |
| 16 | 4.0 | 4.2 | 4.8 | 4.7 | 4.1 | 3.9 | 5.4 | 5.2 |
| 17 | 4.3 | 4.5 | 7.1 | 6.9 | 3.9 | 3.8 | 5.5 | 5.3 |
| 18 | 4.9 | 5.2 | 13.4 | 12.7 | 3.8 | 3.4 | 5.7 | 5.5 |
| 19 | 5.8 | 6.1 | 27.0 | 24.0 | 3.9 | 3.8 | 6.3 | 5.9 |
| 20 | 7.2 | 7.4 | 33.6 | 28.1 | 3.6 | 3.9 | 6.7 | 6.2 |
| 21 | 8.6 | 8.7 | 34.4 | 27.7 | 3.7 | 4.5 | 6.7 | 6.2 |
| 22 | 9.8 | 9.9 | 34.9 | 26.5 | 5.2 | 6.0 | 6.8 | 6.2 |
| 23 | 11.2 | 11.2 | 35.2 | 26.0 | 7.9 | 8.1 | 6.9 | 6.2 |
| 24 | 12.9 | 12.7 | 34.3 | 26.0 | 9.1 | 10.6 | 7.1 | 6.5 |
| 25 | 14.5 | 14.3 | 32.7 | 24.8 | 11.2 | 14.7 | 7.2 | 6.6 |
| 26 | 16.3 | 16.0 | 28.4 | 21.9 | 15.4 | 19.4 | 7.1 | 6.6 |
| 27 | 17.9 | 17.5 | 24.9 | 19.3 | 20.2 | 23.8 | 7.1 | 6.7 |
| 28 | 18.7 | 18.1 | 21.1 | 16.5 | 22.3 | 25.3 | 7.2 | 6.8 |
| 29 | 18.0 | 17.3 | 18.2 | 14.2 | 23.0 | 25.4 | 7.3 | 7.0 |
| 30 | 16.4 | 15.6 | 16.3 | 12.5 | 24.1 | 25.3 | 7.3 | 7.1 |
| 31 | 14.9 | 14.0 | 14.6 | 11.0 | 22.4 | 23.1 | 7.1 | 6.9 |
| 32 | 13.2 | 12.2 | 13.0 | 9.7 | 20.7 | 20.7 | 7.0 | 6.8 |
| 33 | 11.7 | 10.7 | 12.0 | 8.7 | 19.3 | 19.2 | 7.0 | 6.8 |
| 34 | 10.8 | 9.9 | 11.2 | 8.1 | 18.1 | 17.0 | 7.1 | 6.9 |
| 35 | 10.3 | 9.4 | 10.4 | 7.5 | 16.6 | 15.0 | 7.1 | 7.0 |
| 36 | 9.6 | 8.8 | 9.8 | 6.9 | 14.8 | 13.3 | 7.0 | 6.9 |
| 37 | 8.9 | 8.2 | 9.5 | 6.5 | 13.4 | 11.9 | 6.9 | 6.9 |
| 38 | 8.3 | 7.7 | 8.5 | 5.9 | 11.7 | 10.5 | 6.8 | 6.9 |
| 39 | 7.8 | 7.2 | 7.9 | 5.6 | 9.9 | 8.6 | 6.8 | 6.8 |
| 40 | 7.5 | 6.8 | 7.5 | 5.1 | 8.8 | 7.9 | 6.7 | 6.8 |
| 41 | 7.2 | 6.4 | 6.8 | 4.4 | 7.9 | 6.6 | 6.5 | 6.6 |
| 42 | 6.9 | 6.1 | 6.2 | 4.0 | 6.5 | 6.0 | 6.4 | 6.5 |
| 43 | 6.6 | 5.8 | 5.9 | 3.8 | 6.1 | 5.4 | 6.3 | 6.5 |
| 44 | 6.3 | 5.4 | 5.3 | 3.4 | 5.4 | 4.5 | 6.3 | 6.4 |
| 45 | 5.9 | 5.0 | 5.0 | 3.1 | 4.8 | 4.4 | 6.3 | 6.4 |
| 46 | 5.6 | 4.7 | 4.5 | 2.8 | 4.4 | 3.8 | 6.1 | 6.3 |
| 47 | 5.3 | 4.3 | 4.2 | 2.5 | 4.1 | 3.6 | 6.1 | 6.2 |
| 48 | 5.1 | 4.1 | 3.8 | 2.2 | 3.6 | 3.2 | 6.2 | 6.3 |
| 49 | 5.0 | 4.1 | 3.5 | 1.9 | 3.0 | 2.7 | 6.4 | 6.5 |
| 50 | 4.9 | 4.3 | 3.1 | 1.6 | 2.9 | 2.5 | 6.4 | 6.5 |
| 51 | 4.8 | 4.5 | 2.7 | 1.4 | 2.4 | 2.3 | 6.3 | 6.4 |
| 52 | 4.7 | 4.7 | 2.4 | 1.1 | 2.2 | 1.9 | 6.3 | 6.4 |
| 53 | 4.7 | 4.8 | 2.0 | 1.0 | 1.7 | 1.8 | 6.3 | 6.4 |
| 54 | 4.6 | 4.8 | 2.0 | 0.9 | 1.8 | 1.6 | 6.7 | 6.7 |
| 55 | 4.6 | 4.6 | 1.7 | 0.8 | 1.6 | 1.7 | 7.1 | 7.1 |
| 56 | 4.6 | 4.5 | 1.5 | 0.7 | 1.5 | 1.8 | 7.3 | 7.3 |
| 57 | 4.5 | 4.4 | 1.4 | 0.6 | 1.6 | 2.0 | 7.3 | 7.4 |
| 58 | 4.4 | 4.3 | 1.2 | 0.5 | 1.4 | 1.8 | 7.1 | 7.2 |
| 59 | 4.3 | 4.2 | 1.1 | 0.5 | 1.5 | 1.9 | 7.1 | 7.2 |
| 60 | 4.1 | 4.0 | 0.9 | 0.4 | 1.4 | 2.0 | 7.0 | 7.1 |
| 61 | 3.9 | 3.9 | 0.8 | 0.4 | 1.4 | 1.8 | 6.8 | 7.0 |
| 62 | 3.7 | 3.7 | 0.7 | 0.3 | 1.5 | 1.9 | 6.7 | 6.9 |
| 63 | 3.5 | 3.5 | 0.6 | 0.4 | 1.3 | 1.9 | 6.5 | 6.7 |
| 64 | 3.4 | 3.5 | 0.5 | 0.3 | 1.5 | 2.0 | 6.2 | 6.5 |
| 65 | 3.3 | 3.5 | 0.5 | 0.3 | 1.6 | 2.0 | 6.1 | 6.4 |
| 66 | 3.1 | 3.6 | 0.4 | 0.2 | 1.5 | 1.8 | 5.8 | 6.1 |
| 67 | 3.0 | 3.6 | 0.3 | 0.2 | 1.4 | 1.7 | 5.5 | 5.8 |
| 68 | 2.9 | 3.6 | 0.3 | 0.2 | 1.2 | 1.6 | 5.2 | 5.6 |
| 69 | 2.6 | 3.2 | 0.2 | 0.1 | 1.1 | 1.3 | 5.1 | 5.4 |
| 70 | 2.3 | 2.7 | 0.2 | 0.1 | 1.1 | 1.4 | 4.9 | 5.3 |
| 71 | 2.0 | 2.3 | 0.2 | 0.1 | 1.0 | 1.2 | 4.7 | 5.1 |
| 72 | 1.7 | 1.8 | 0.1 | 0.1 | 0.9 | 1.2 | 4.6 | 5.0 |
| 73 | 1.4 | 1.5 | 0.1 | 0.1 | 0.8 | 0.9 | 4.5 | 4.9 |
| 74 | 1.3 | 1.3 | 0.1 | 0.1 | 0.6 | 0.8 | 3.8 | 4.2 |
| 75 | 1.2 | 1.3 | 0.1 | 0.1 | 0.6 | 0.7 | 3.5 | 3.8 |
| 76 | 1.1 | 1.2 | 0.1 | 0.1 | 0.5 | 0.7 | 3.3 | 3.7 |
| 77 | 1.0 | 1.2 | 0.0 | 0.1 | 0.5 | 0.5 | 3.0 | 3.4 |
| 78 | 0.9 | 1.1 | 0.0 | 0.0 | 0.4 | 0.5 | 2.7 | 3.2 |
| 79 | 0.8 | 1.0 | 0.0 | 0.0 | 0.4 | 0.4 | 2.5 | 3.0 |
| 80 | 0.7 | 0.8 | 0.0 | 0.0 | 0.3 | 0.4 | 2.3 | 2.7 |
| 81 | 0.6 | 0.7 | 0.0 | 0.0 | 0.3 | 0.3 | 2.1 | 2.5 |
| 82 | 0.5 | 0.6 | 0.0 | 0.0 | 0.2 | 0.3 | 1.9 | 2.4 |
| 83 | 0.4 | 0.5 | 0.0 | 0.0 | 0.2 | 0.2 | 1.7 | 2.2 |
| 84 | 0.4 | 0.5 | 0.0 | 0.0 | 0.2 | 0.2 | 1.6 | 2.1 |
| 85 | 0.3 | 0.5 | 0.0 | 0.0 | 0.1 | 0.2 | 1.4 | 1.9 |
| 86 | 0.2 | 0.4 | 0.0 | 0.0 | 0.1 | 0.1 | 1.2 | 1.7 |
| 87 | 0.2 | 0.4 | 0.0 | 0.0 | 0.1 | 0.1 | 1.1 | 1.6 |
| 88 | 0.2 | 0.4 | 0.0 | 0.0 | 0.1 | 0.1 | 1.0 | 1.5 |
| 89 | 0.1 | 0.4 | 0.0 | 0.0 | 0.0 | 0.0 | 0.8 | 1.4 |
| 90 | 0.1 | 0.3 | 0.0 | 0.0 | 0.0 | 0.0 | 0.7 | 1.2 |
| 91 | 0.1 | 0.2 | 0.0 | 0.0 | 0.0 | 0.0 | 0.5 | 1.0 |
| 92 | 0.1 | 0.2 | 0.0 | 0.0 | 0.0 | 0.0 | 0.4 | 0.9 |
| 93 | 0.1 | 0.1 | 0.0 | 0.0 | 0.0 | 0.0 | 0.3 | 0.7 |
| 94 | 0.1 | 0.1 | 0.0 | 0.0 | 0.0 | 0.0 | 0.2 | 0.6 |
| 95 | 0.0 | 0.1 | 0.0 | 0.0 | 0.0 | 0.0 | 0.2 | 0.5 |
| 96 | 0.0 | 0.1 | 0.0 | 0.0 | 0.0 | 0.0 | 0.1 | 0.4 |
| 97 | 0.0 | 0.0 | 0.0 | 0.0 | 0.0 | 0.0 | 0.1 | 0.3 |
| 98 | 0.0 | 0.0 | 0.0 | 0.0 | 0.0 | 0.0 | 0.1 | 0.2 |
| 99 | 0.0 | 0.0 | 0.0 | 0.0 | 0.0 | 0.0 | 0.0 | 0.1 |
| 100 and older | 0.0 | 0.0 | 0.0 | 0.0 | 0.0 | 0.0 | 0.1 | 0.2 |
| Source: Statistics Canada, Centre for Demography. | ||||||||
Immigrants stood out for having a population share of children aged 0 to 14 (17.1%) slightly higher than the total Canadian population (15.9%). By comparison, in 2020, 4.4% of non-permanent residents were in the 0-to-14 age group. The distinct age structure of non-permanent residents is mostly due to the fact that these people come to Canada mainly for the purpose of work or study, which mostly involves young adults who have no children (or who come to study or work without their young families).
Males outnumber females among non-permanent residents and interprovincial migrants
The sex structure also differs between each of the three subgroups. The number of males per 100 females was close to parity among immigrants (98.4 males per 100 females), comparable to the Canadian population (98.8 males per 100 females). However, males were overrepresented among non-permanent residents (131.3 males per 100 females) and, to a lesser degree, among interprovincial migrants (103.4 males per 100 females).

Data table for Chart 2.8
| Total | 0 to 14 years | 15 to 64 years | 65 years and older | |
|---|---|---|---|---|
| number of males for 100 females | ||||
| Population | 98.8 | 104.6 | 101.4 | 85.3 |
| Interprovincial migrants | 103.4 | 106.2 | 105.0 | 82.3 |
| Immigrants | 98.4 | 105.5 | 97.7 | 81.4 |
| Non-permanent residents | 131.3 | 108.0 | 132.5 | 129.1 |
| Source: Statistics Canada, Centre for Demography. | ||||
- Date modified: