
Annual Demographic Estimates: Canada, Provinces and Territories, 2020
Analysis: Total Population
Skip to text
Text begins
The estimates in this publication are based on 2016 Census counts, adjusted for census net undercoverage and incompletely enumerated Indian reserves, plus the estimated population growth for the period from May 10, 2016, to the date of the estimate. The analysis in this publication is based on preliminary data. These data will be revised over the coming years, and some trends described in this publication could change as a result of these revisions. Therefore, this publication should be interpreted with caution.
The analyses in this document focus on the period July 1, 2019 to June 30, 2020. During this time period, in the first two quarters of 2020, COVID-19 began to impact Canada. The estimates for some demographic components were adjusted to take into account the effect of the global pandemic on the population of Canada.
For an explanation of how the population estimates have taken COVID-19 into account, please see: Technical Supplement: Production of Demographic Estimates for the Second Quarter of 2020 in the Context of COVID-19.
This section presents the population estimates for Canada, the provinces and territories on July 1, 2020, along with a concise analysis of the various components of population growth between July 1, 2019, and July 1, 2020.
Canada’s population surpasses 38 million
On July 1, 2020, Canada’s population was estimated at 38,005,238, an increase of 411,854 from July 1, 2019 (+1.1%). Population growth had been over 500,000 for the two previous years (2017/2018 and 2018/2019, both +1.4%). The rate of growth in 2019/2020 is similar to that seen in 2015/2016 (+406,579, +1.1%). The slower growth seen in 2019/2020 results from the impact of the COVID-19 pandemic, both in the increased number of deaths and in the restrictions placed on international borders, leading to a significant reduction in international migration in the second quarter of 2020 (+99,701, +0.4%).
Population growth during the last year sets both a record-high and a record-low
The third quarter of 2019 had the highest growth ever recorded for a third quarter, since the beginning of the current demographic accounting system in 1971 (+208,659, +0.6%). As per usual, growth was slower in the fourth quarter of 2019 (+97,234, +0.3%) than in the third quarter, however, this was still the highest growth in a fourth quarter since 1988.
The global COVID-19 pandemic first came to Canada in the first quarter of 2020, in January. The demographic impacts began at the end of that quarter, in March, as the first death was reported on March 9Note 1 and there were restrictions placed on international borders mid-month. This led to a slight reduction in growth for the first quarter of 2020 (+80,577 in the first quarter of 2020, as opposed to +92,916 in the first quarter of 2019). The number of COVID-19 deaths increased in the second quarter of 2020Note 2 and the restrictions on international borders continued. The result being that the growth in the second quarter (+25,384, +0.1%) was the lowest growth in a second quarter since the beginning of the current demographic accounting system.
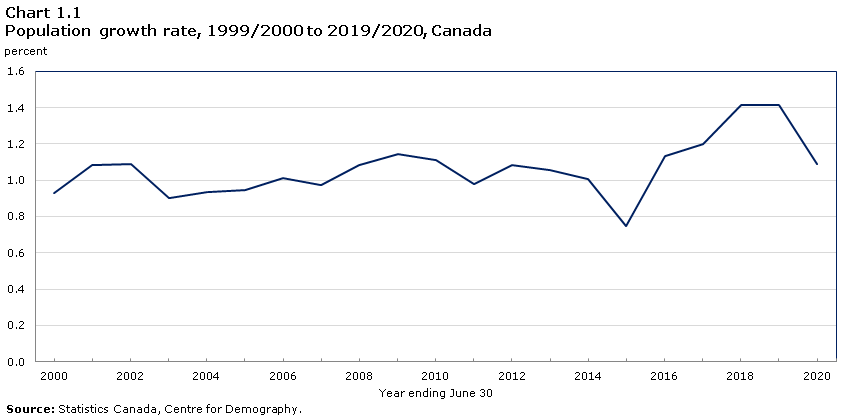
Data table for Chart 1.1
| Year ending June 30 | Percent |
|---|---|
| 2000 | 0.93 |
| 2001 | 1.09 |
| 2002 | 1.09 |
| 2003 | 0.90 |
| 2004 | 0.93 |
| 2005 | 0.94 |
| 2006 | 1.01 |
| 2007 | 0.97 |
| 2008 | 1.08 |
| 2009 | 1.14 |
| 2010 | 1.11 |
| 2011 | 0.98 |
| 2012 | 1.09 |
| 2013 | 1.06 |
| 2014 | 1.01 |
| 2015 | 0.75 |
| 2016 | 1.13 |
| 2017 | 1.20 |
| 2018 | 1.41 |
| 2019 | 1.41 |
| 2020 | 1.09 |
| Source: Statistics Canada, Centre for Demography. | |
International migration remains the main source of population growth
At the national level, population growth is a result of two factors: international migrationNote 3 and natural increase (births minus deaths). Between July 1, 2019 and July 1, 2020, 81.9% of Canada’s growth came from international migration, representing a net increase of 337,283 persons. This was lower than the percentage found in 2018/2019 (83.9%, +442,960 persons). Since international migration was reduced in the second quarter of 2020, natural increase accounted for slightly more of the growth in 2019/2020 than in the previous two years. However, the percentage of growth accounted for by international migration in 2019/2020 was still higher than it was in every year from 1971/1972 to 2016/2017.
In 2019/2020, natural increase (+74,571) was responsible for 18.1% of the total growth or the difference between 374,885 births and 300,314 deaths. This is the lowest level ever recorded in Canada, since the beginning of the current demographic accounting system. This value has been steadily decreasing since 2015/2016 (+121,492), which is to be expected due to an increasing number of deaths resulting from population aging. The excess mortality resulting from COVID-19 also contributed to the smaller value for natural increase.Note 4
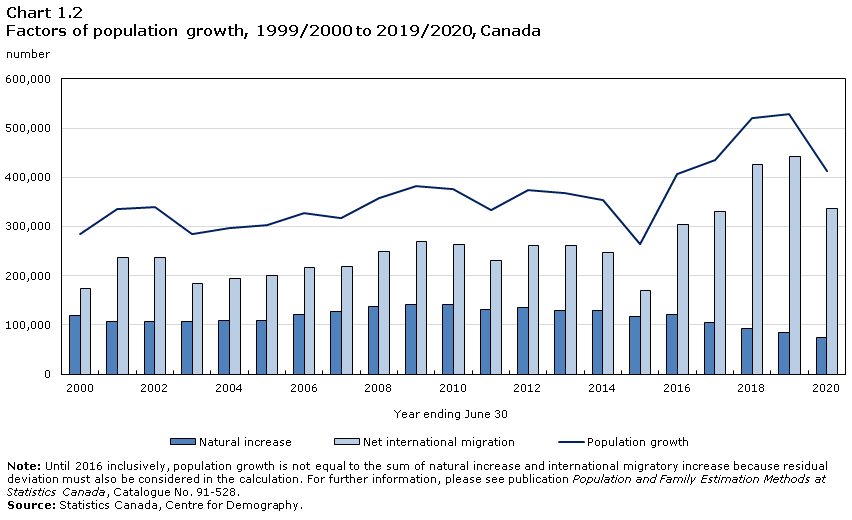
Data table for Chart 1.2
| Year ending June 30 | Natural increase | Net international migration | Population growth |
|---|---|---|---|
| number | |||
| 2000 | 119,683 | 174,769 | 284,444 |
| 2001 | 107,993 | 236,700 | 335,172 |
| 2002 | 107,661 | 237,935 | 339,177 |
| 2003 | 106,618 | 183,749 | 283,949 |
| 2004 | 108,933 | 194,128 | 296,627 |
| 2005 | 109,364 | 200,154 | 303,098 |
| 2006 | 120,593 | 216,093 | 327,421 |
| 2007 | 127,091 | 219,749 | 317,851 |
| 2008 | 137,170 | 249,993 | 358,093 |
| 2009 | 141,582 | 269,184 | 381,777 |
| 2010 | 142,235 | 262,750 | 375,994 |
| 2011 | 131,456 | 230,981 | 334,439 |
| 2012 | 136,430 | 260,564 | 374,894 |
| 2013 | 129,951 | 260,820 | 368,732 |
| 2014 | 129,229 | 247,290 | 354,481 |
| 2015 | 117,154 | 170,354 | 265,473 |
| 2016 | 121,492 | 304,047 | 406,579 |
| 2017 | 105,702 | 330,106 | 435,808 |
| 2018 | 93,025 | 426,858 | 519,883 |
| 2019 | 85,246 | 442,960 | 528,206 |
| 2020 | 74,571 | 337,283 | 411,854 |
|
Note: Until 2016 inclusively, population growth is not equal to the sum of natural increase and international migratory increase because residual deviation must also be considered in the calculation. For further information, please see publication Population and Family Estimation Methods at Statistics Canada, Catalogue No. 91-528. Source: Statistics Canada, Centre for Demography. |
|||
COVID-19 border restrictions change immigration patterns
International migration levels dropped rapidly as the pandemic restrictions were implemented. This was found for both immigrants and for non-permanent residents. In the third quarter of 2019, migratory increase was at an all-time high (+176,038).Note 5 The fourth quarter of 2019 was also at an all-time high for this period of the year (+81,168). By the first quarter of 2020 (January to March, with travel restrictions starting in March), total migratory growth began to decline (+70,377, where it had been over 80,000 in the first quarters of both 2018 and 2019). However, it was similar to levels seen in the first quarter of 2017 (+69,158).
With the travel restrictions firmly in place, the second quarter of 2020 saw a migratory increase of only +9,700, a low never before seen in a second quarterNote 4 (the next lowest was the second quarter of 1978, with +12,931). To put this in perspective, the second quarter of 2018 saw a migratory increase of +140,156 persons, and the second quarter of 2019 saw a migratory increase of +152,487. The second quarter of 2020 was also the only quarter since the fourth quarter of 2018 to have a negative net number of non-permanent residents (-24,768). This means that there were more non-permanent residents at the start of the quarter (April 1, 2020) than at the end of the quarter (June 30, 2020), mainly due to a reduction in the number of study permit holders and, to a lesser extent, the number of asylum claimants. This is consistent with the travel restrictions imposed due to the COVID-19 pandemic.
The components of emigration were also lower in 2019/2020 than in 2018/2019, again the result of COVID-19 imposed border restrictions. The number of people estimated to have left the country, emigrants, decreased by 23.7% over the past year, from 51,290 to 39,129. However, only 141 left during the second quarter of 2020. Similarly, returning emigrants, or those returning to Canada after having lived abroad, decreased by 15.0%, from 39,663 in 2018/2019 to 33,732 in 2019/2020. During the first quarter of 2020, which represents the early part of the pandemic, Canadians were urged to return home before the border restrictions began at the end of March. The first quarter of 2020 thus saw the most returning emigrants ever seen in a first quarterNote 4 (10,040 persons), an 82.6% increase over the numbers seen in the first quarter of 2019 (5,497). In the second quarter of 2020, following the implementation of the border restrictions, only 413 people returned to Canada.
International migratory growth lower in almost all provinces and territories
Every province and territory saw a smaller increase from international migration in 2019/2020 than in 2018/2019 (except for Nunavut). Among the provinces, the decreases in international migration from 2018/2019 to 2019/2020 ranged from -10.8% (207 fewer people) in Newfoundland and Labrador to -40.5% (25,211 fewer people) in British Columbia.
Lower international migratory increase in 2019/2020 was due to two factors. First, there were fewer immigrants admitted (284,387 as compared to 313,601 in 2018/2019, a 9.3% decrease). However, the number of immigrants admitted in 2018/2019 was the second highest since 1971/1972. The 284,387 immigrants admitted in 2019/2020 was similar to the number admitted in 2016/2017 (272,707). Among the provinces, the greatest percent reduction in the number of immigrants was found in Quebec (-25.8%) and in Alberta (-12.8%). British Columbia was the only province to increase in the number of immigrants from 2018/2019 to 2019/2020 (+4.1%).
Second, the number of non-permanent residents increased by 77,172 during the last year. This is lower than the increases recorded over the preceding two years, which had the highest levels of non-permanent residents since the beginning of the current demographic accounting system (1971/1972), with +162,290 in 2017/2018 and +168,662 in 2018/2019. The reduction from 2018/2019 to 2019/2020 was by more than half (-54.2%). Reductions in the numbers of non-permanent residents from 2018/2019 to 2019/2020 were found in all provinces and territories (except for the Northwest Territories). However, the net number of non-permanent residents was positive in all provinces and territories, except for Manitoba, British Columbia, Yukon and the Northwest Territories. COVID-19 travel restrictions made it difficult for those holding non-permanent resident permits to enter the country for non-essential reasons in the second quarter of 2020.
More people live to the west of Ontario and in the territories than to the east
Ontario is Canada’s largest province by population (14,734,014), accounting for 38.8% of all residents. There are 12,254,098 (32.2%) people living in the provinces to the west of Ontario and in the territoriesNote 6 and 11,017,126 (29.0%) people living in the provinces to the east of Ontario.Note 7 The distribution of the population among Canada’s provinces and territories remained virtually unchanged since 2018/2019. The three most populous provinces after Ontario are Quebec (8,574,571), British Columbia (5,147,712), and Alberta (4,421,876).

Data table for Chart 1.3
The pie chart has the following 13 sections:
| Provinces and territories | Proportion |
|---|---|
| Ont. | 38.80% |
| Que. | 22.60% |
| B.C. | 13.50% |
| Alta. | 11.60% |
| Man. | 3.60% |
| Sask. | 3.10% |
| N.S. | 2.60% |
| N.B. | 2.10% |
| N.L. | 1.40% |
| P.E.I. | 0.40% |
| N.W.T. | 0.10% |
| Y.T. | 0.10% |
| Nvt. | 0.10% |
| Source: Statistics Canada, Centre for Demography. | |
Population growth lower in almost all provinces and territories
Almost all provinces and territories experienced a decrease in their rate of growth in 2019/2020 as compared to 2018/2019. The exceptions to this are Newfoundland and Labrador (-0.3%), the Northwest Territories (+0.3%), and Nunavut (+1.9%). While the rate of loss was slower in Newfoundland and Labrador than it was in 2018/2019 (-0.4%), it was the only province or territory to lose population in 2019/2020.
The reduced growth in Canada in 2019/2020 is mainly the result of lower growth in the three largest provinces. At a growth rate of +1.3%, down from +1.6% in 2018/2019, Ontario grew by 46,725 fewer people than the year before. Similarly, Quebec grew by 27,097 fewer people (going from a growth rate of +1.2% in 2018/2019 to +0.9% in 2019/2020). The third largest province, British Columbia, went from a growth rate of +1.6% in 2018/2019 to a rate of +1.1% in 2019/2020, resulting in a growth of 23,722 fewer people than the year before.
While the growth rates were lower in almost all provinces and territories in 2019/2020 than they were in 2018/2019, they were not at record lows. In most cases, each province and territory has seen a similar or lower growth rate at some point within the last ten years. The exceptions to this are Manitoba (+0.7%), which had not seen a similar growth rate since 2007/2008 (+0.7%) and Saskatchewan (+0.5%), for which the last year to record a lower growth rate was 2005/2006 (-0.1%).
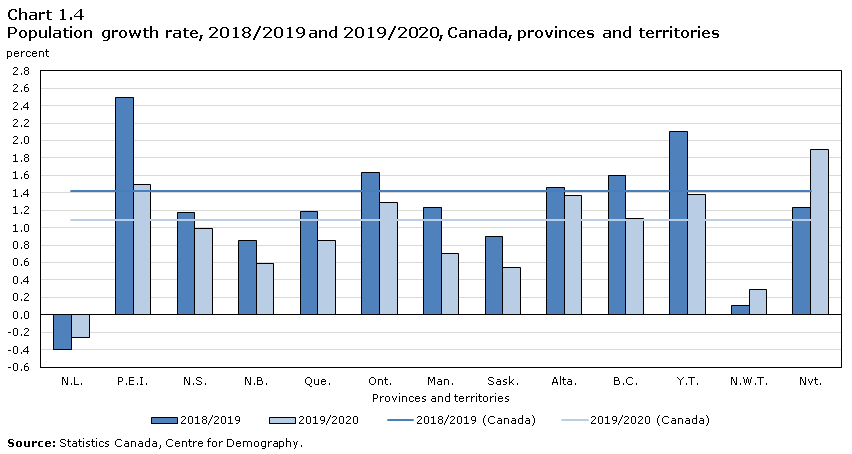
Data table for Chart 1.4
| Provinces and territories | 2018/2019 | 2019/2020 | 2018/2019 (Canada) | 2019/2020 (Canada) |
|---|---|---|---|---|
| percent | ||||
| N.L. | -0.4 | -0.3 | 1.4 | 1.1 |
| P.E.I. | 2.5 | 1.5 | 1.4 | 1.1 |
| N.S. | 1.2 | 1.0 | 1.4 | 1.1 |
| N.B. | 0.8 | 0.6 | 1.4 | 1.1 |
| Que. | 1.2 | 0.9 | 1.4 | 1.1 |
| Ont. | 1.6 | 1.3 | 1.4 | 1.1 |
| Man. | 1.2 | 0.7 | 1.4 | 1.1 |
| Sask. | 0.9 | 0.5 | 1.4 | 1.1 |
| Alta. | 1.5 | 1.4 | 1.4 | 1.1 |
| B.C. | 1.6 | 1.1 | 1.4 | 1.1 |
| Y.T. | 2.1 | 1.4 | 1.4 | 1.1 |
| N.W.T. | 0.1 | 0.3 | 1.4 | 1.1 |
| Nvt. | 1.2 | 1.9 | 1.4 | 1.1 |
| Source: Statistics Canada, Centre for Demography. | ||||
International migratory growth remains the main driver of population growth in the provinces
Ontario, Alberta, and British Columbia were the only provinces where each of the three population growth factors contributed positively to population growth.Note 8 In Ontario and British Columbia, population growth stemmed mainly from international migratory growth. Interprovincial migration contributed almost nothing to the growth in Ontario (+363 persons).
All four Atlantic provincesNote 9 had negative natural increase, meaning that there were more deaths in 2019/2020 than births (as has been the case since 2016/2017). Newfoundland and Labrador, Prince Edward Island, Quebec, Manitoba, and Saskatchewan all lost population to other provinces through interprovincial migration. In the case of Newfoundland and Labrador, the gains from international migration (+1,704) were not enough to compensate for losses to natural increase (-1,608) and to other provinces (-1,469) leading to a decrease in population.
Natural increase was the main contributor to growth in all three territories. However, in Yukon, interprovincial migration (+219) was almost equal to natural increase (+233). The Northwest Territories lost population to interprovincial migration (-309), while Yukon (+219) and Nunavut (+77) both gained. International migratory increase was smaller in the territories than in the provinces, and accounted for an increase of 26 people in Nunavut. Growth in that territory mainly resulted from natural increase (+636), a rate of +1.6% being by far the highest rate in the country (next highest was the Northwest Territories, at +0.7%). However, the rates of natural increase in both Nunavut and the Northwest Territories were the lowest ever experienced in the each territory.
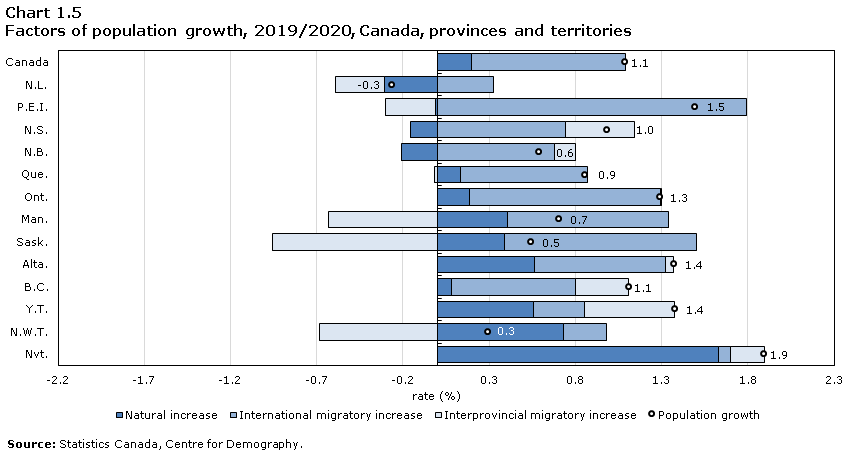
Data table for Chart 1.5
| Natural increase | International migratory increase | Interprovincial migratory increase | Population growth | |
|---|---|---|---|---|
| rate (%) | ||||
| Canada | 0.2 | 0.9 | 0.0 | 1.1 |
| N.L. | -0.3 | 0.3 | -0.3 | -0.3 |
| P.E.I. | 0.0 | 1.8 | -0.3 | 1.5 |
| N.S. | -0.2 | 0.7 | 0.4 | 1.0 |
| N.B. | -0.2 | 0.7 | 0.1 | 0.6 |
| Que. | 0.1 | 0.7 | 0.0 | 0.9 |
| Ont. | 0.2 | 1.1 | 0.0 | 1.3 |
| Man. | 0.4 | 0.9 | -0.6 | 0.7 |
| Sask. | 0.4 | 1.1 | -1.0 | 0.5 |
| Alta. | 0.6 | 0.8 | 0.0 | 1.4 |
| B.C. | 0.1 | 0.7 | 0.3 | 1.1 |
| Y.T. | 0.6 | 0.3 | 0.5 | 1.4 |
| N.W.T. | 0.7 | 0.3 | -0.7 | 0.3 |
| Nvt. | 1.6 | 0.1 | 0.2 | 1.9 |
| Source: Statistics Canada, Centre for Demography. | ||||
Ontario continues to attract the most immigrants
In 2019/2020, 44.7% of all immigrants to Canada settled in Ontario, a level similar to what was observed in 2018/2019 (44.4%), which exceeds the demographic weight of the province (38.8%). Immigrants to the Prairie provincesNote 10 accounted for a similar percent in 2019/2020 (22.4%) than in 2018/2019 (22.5%). However, this was down from (28.0%) in 2015/2016. Immigrants to Manitoba and Saskatchewan remained relatively stable over this time period, with the decline in immigrants to the Prairie provinces being mainly due to a reduction of the share of immigrants going to Alberta (17.9% in 2015/2016 and 12.5% in 2019/2020). The percentage of all immigrants settling in Quebec (11.7%) has been decreasing since 2016/2017 (19.5%) while the percentage of immigrants going to the Atlantic provinces (5.2%) has been generally trending upwards recently (more than doubling in the last ten years, from 2.5% in 2009/2010).
Start of text boxThe estimated number of immigrants by province and territory is based on their intended province or territory of residence, as collected by Immigration, Refugees and Citizenship Canada (IRCC). This also applies to the calculation of international migratory growth and provincial and territorial population growth.
All provinces and territories saw a smaller increase in the net number of non-permanent residents (NPRs) in 2019/2020 from 2018/2019 (except for the Northwest Territories). Nevertheless, the net number of NPRs was still positive in most provinces and territories (except for Manitoba, British Columbia, Yukon, and the Northwest Territories).
Moreover, the lower net number of non-permanent residents did not reach record lows, since all provinces and territories had seen similar, or lower, numbers within the last ten years (except for Manitoba (-1,493) and Yukon (-175), both of which had the lowest recorded numbers of non-permanent residents since the beginning of the current demographic accounting system in 1971/1972).
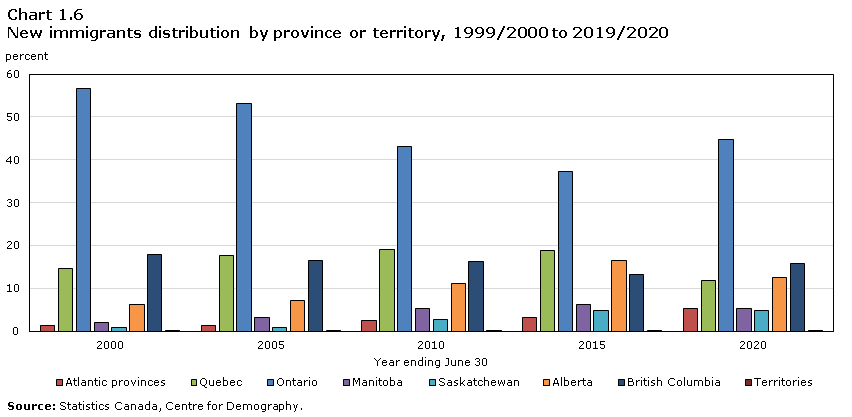
Data table for Chart 1.6
| Year ending June 30 | Atlantic provinces | Quebec | Ontario | Manitoba | Saskatchewan | Alberta | British Columbia | Territories |
|---|---|---|---|---|---|---|---|---|
| percent | ||||||||
| 2000 | 1.4 | 14.7 | 56.8 | 2.0 | 0.8 | 6.3 | 18.0 | 0.1 |
| 2005 | 1.4 | 17.8 | 53.1 | 3.1 | 0.9 | 7.1 | 16.6 | 0.1 |
| 2010 | 2.5 | 19.0 | 43.1 | 5.2 | 2.7 | 11.1 | 16.2 | 0.2 |
| 2015 | 3.2 | 18.9 | 37.2 | 6.1 | 4.7 | 16.4 | 13.2 | 0.2 |
| 2020 | 5.2 | 11.7 | 44.7 | 5.2 | 4.7 | 12.5 | 15.8 | 0.2 |
| Source: Statistics Canada, Centre for Demography. | ||||||||
After four years of losses, Alberta gained population from other provinces
At the provincial and territorial level, population growth is the result of natural increase, international migration, and interprovincial migratory exchanges. Three provinces and territories reversed their trends in interprovincial migration in 2019/2020. Prince Edward Island had been gaining population from other provinces and territories since 2015/2016, but more people left the province than chose to settle there in 2019/2020 (-462), with the most people going to Ontario. Alberta gained population from other provinces and territories (+2,183) for the first time since 2014/2015, with the majority of people coming from Ontario and British Columbia. Similarly, Nunavut gained population from other provinces and territories (+77) for the first time since 2012/2013, with the most people coming from Ontario. While still positive, gains in Ontario decreased from +6,629 in 2018/2019 to +363 in 2019/2020. Ontario has gained from interprovincial migration since 2015/2016, following twelve successive years of losses to other provinces and territories.
British Columbia had the highest gains from interprovincial migration in 2019/2020 (+15,708), with most people coming from Ontario and Alberta, an increase of 2,383 over 2018/2019 (+13,325). As in 2017/2018 and in 2018/2019, Manitoba (-8,689) and Saskatchewan (-11,247) had the highest losses to other provinces in 2019/2020. In both provinces, the majority of people left for Ontario, Alberta, or British Columbia. While Quebec continued to lose population to other provinces (-1,238, as it has for every year since the beginning of the current demographic accounting system in 1971), this was the smallest loss the province has seen since 2003/2004 (-822). Migrants from Quebec tended to go to Ontario.
Population growth and economic growth are often interrelated. For example, Canada’s interprovincial migration flows can be either a source or a result of economic conditions, which can affect both employment and unemployment. Notably, Alberta experienced unemployment rates at 7.0% or higher between November 2015 and December 2017, mostly the result of a drop in oil prices which began in the fall of 2014.Note 11 At the same time, the province registered net interprovincial migration losses over 15,000 during both annual periods 2015/2016 and 2016/2017. Conditions were much improved in Alberta in 2018, as employment rose and the unemployment rate dropped.Note 12 It follows that, while Alberta still lost population to interprovincial migration in 2017/2018 and 2018/2019, losses had dropped to -3,247 in 2017/2018 and -2,032 in 2018/2019. The fact that Alberta drew more individuals from other provinces than Albertans who left the province in 2019/2020 could be related to the more stable economic conditions in the province through that period, until March 2020, when the COVID-19 pandemic intensified.
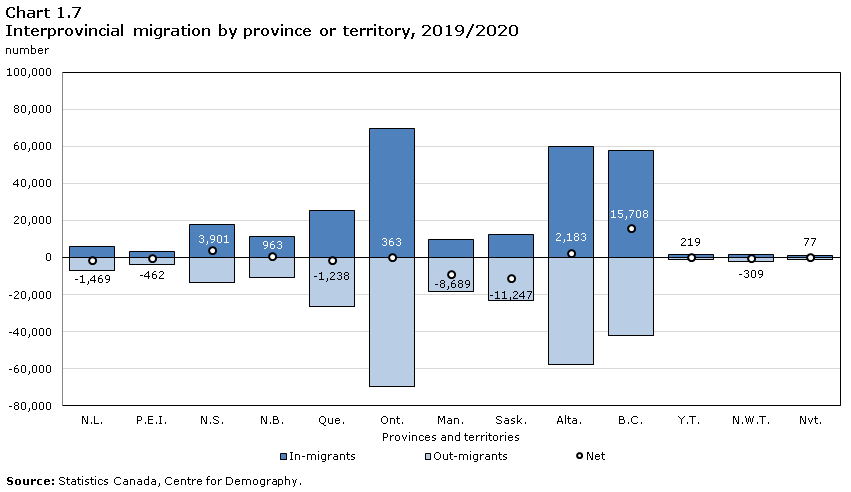
Data table for Chart 1.7
| Provinces and territories | In-migrants | Out-migrants | Net |
|---|---|---|---|
| number | |||
| N.L. | 5,794 | -7,263 | -1,469 |
| P.E.I. | 3,296 | -3,758 | -462 |
| N.S. | 17,582 | -13,681 | 3,901 |
| N.B. | 11,606 | -10,643 | 963 |
| Que. | 25,461 | -26,699 | -1,238 |
| Ont. | 69,881 | -69,518 | 363 |
| Man. | 9,928 | -18,617 | -8,689 |
| Sask. | 12,180 | -23,427 | -11,247 |
| Alta. | 60,173 | -57,990 | 2,183 |
| B.C. | 57,754 | -42,046 | 15,708 |
| Y.T. | 1,498 | -1,279 | 219 |
| N.W.T. | 1,832 | -2,141 | -309 |
| Nvt. | 1,331 | -1,254 | 77 |
| Source: Statistics Canada, Centre for Demography. | |||
The largest migration flows involve exchanges between Ontario, Alberta and British Columbia
The 30 largest migration flows are shown in Chart 1.8, in which each province or territory is assigned a colour. Migration origins and destinations are represented by the circle’s segments. Flows are the same colour as their origin, the width indicates their size and the arrow their direction.
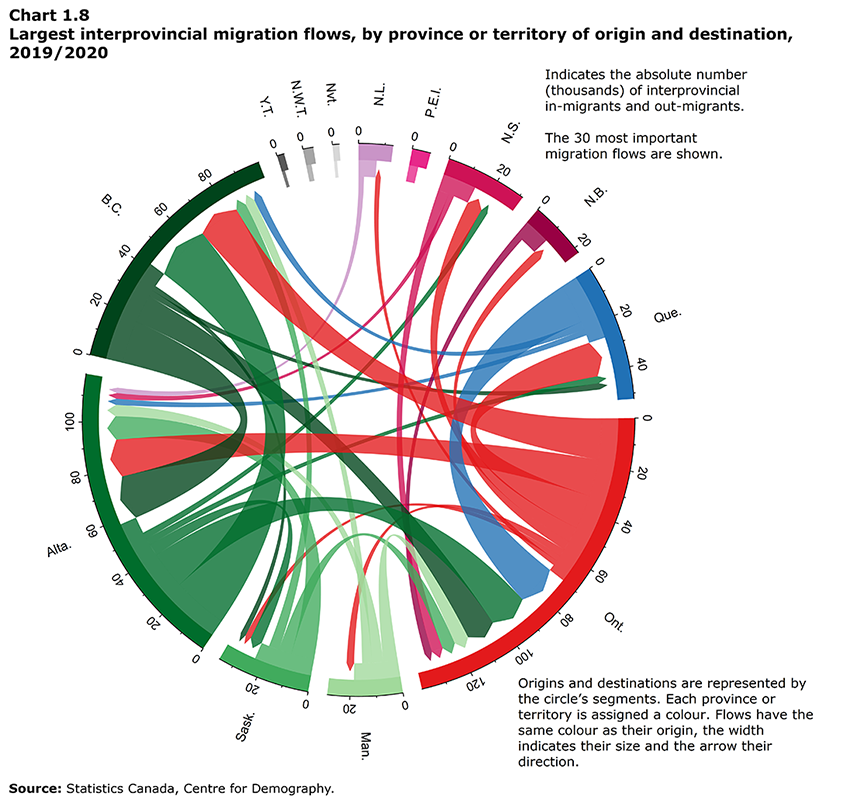
Data table for Chart 1.8
Origins and destinations are represented by the circle’s segments. Each province or territory is assigned a colour. Flows have the same colour as their origin, the width indicates their size and the arrow their direction. Indicates the absolute number (thousands) of interprovincial in-migrants and out-migrants. The 30 most important flows are shown.
| Origin | Destination | ||||||||||||
|---|---|---|---|---|---|---|---|---|---|---|---|---|---|
| N.L. | P.E.I. | N.S. | N.B. | Que. | Ont. | Man. | Sask. | Alta. | B.C. | Y.T. | N.W.T. | Nvt. | |
| N.L. | Note ...: not applicable | 110 | 1,226 | 411 | 375 | 2,051 | 83 | 66 | 2,326 | 446 | 52 | 67 | 50 |
| P.E.I. | 74 | Note ...: not applicable | 680 | 405 | 285 | 1,489 | 45 | 53 | 311 | 410 | 0 | 0 | 6 |
| N.S. | 759 | 506 | Note ...: not applicable | 1,822 | 1,058 | 4,808 | 347 | 152 | 2,404 | 1,472 | 29 | 152 | 172 |
| N.B. | 206 | 302 | 1,994 | Note ...: not applicable | 1,564 | 3,270 | 198 | 73 | 2,113 | 864 | 0 | 52 | 7 |
| Que. | 166 | 166 | 755 | 1,447 | Note ...: not applicable | 17,181 | 359 | 315 | 2,632 | 3,456 | 50 | 91 | 81 |
| Ont. | 2,238 | 1,336 | 6,607 | 4,016 | 14,696 | Note ...: not applicable | 3,256 | 2,470 | 15,905 | 17,719 | 305 | 343 | 627 |
| Man. | 107 | 66 | 535 | 211 | 836 | 6,239 | Note ...: not applicable | 1,503 | 4,858 | 4,143 | 27 | 50 | 42 |
| Sask. | 177 | 86 | 406 | 393 | 625 | 5,594 | 1,501 | Note ...: not applicable | 9,949 | 4,507 | 89 | 80 | 20 |
| Alta. | 1,484 | 445 | 2,946 | 1,844 | 2,992 | 16,053 | 2,179 | 5,096 | Note ...: not applicable | 23,799 | 385 | 648 | 119 |
| B.C. | 468 | 251 | 1,951 | 909 | 2,688 | 12,236 | 1,856 | 2,308 | 18,508 | Note ...: not applicable | 464 | 236 | 171 |
| Y.T. | 0 | 5 | 101 | 28 | 85 | 203 | 39 | 50 | 284 | 426 | Note ...: not applicable | 53 | 5 |
| N.W.T. | 48 | 23 | 144 | 51 | 116 | 335 | 44 | 69 | 778 | 434 | 68 | Note ...: not applicable | 31 |
| Nvt. | 67 | 0 | 237 | 69 | 141 | 422 | 21 | 25 | 105 | 78 | 29 | 60 | Note ...: not applicable |
|
... not applicable Source: Statistics Canada, Centre for Demography. |
|||||||||||||
Over the past year, the largest interprovincial migration flow was from Alberta to British Columbia (23,799). The second largest interprovincial migration flow in Canada was in the opposite direction, from British Columbia to Alberta (18,508). Taking into account these exchanges between the two provinces resulted in a gain of 5,291 for British Columbia, a gain that was 636 (10.7%) smaller than the gain to British Columbia from Alberta seen in 2018/2019 (+5,927). The increase in the gains to British Columbia from interprovincial migration mostly come from exchanges with Ontario. In 2018/2019, British Columbia gained 2,785 in its exchanges with Ontario, while in 2019/2020, British Columbia gained 5,483. The flow from Ontario to British Columbia (17,719) was the third largest interprovincial migration flow in Canada in 2019/2020.
Alberta’s positive gain from interprovincial migration (+2,183, the first gain since 2014/2015) resulted from an increase in the number of people moving to Alberta from every province and territory (except for Newfoundland and Labrador and Prince Edward Island). The number of people leaving Alberta for other provinces and territories also increased from 2018/2019 to 2019/2020 (except for people moving to Prince Edward Island and Manitoba). However, the number of people moving to the province was greater than the number leaving, leading to a net interprovincial gain for Alberta.
In relative terms (expressed as ratesNote 13), the largest interprovincial migration flows among the provinces and territories were from the Northwest Territories to Alberta (1.7%), from Nunavut to Ontario (1.1%), from Yukon to British Columbia and from the Northwest Territories to British Columbia (both at 1.0%), and from Prince Edward Island to Ontario (0.9%).
Notes
- Date modified: