
Thematic Series on Ethnicity, Language and Immigration
Portrait of English-language workers in Quebec’s agriculture and agri-food industries, 2011

Archived Content
Information identified as archived is provided for reference, research or recordkeeping purposes. It is not subject to the Government of Canada Web Standards and has not been altered or updated since it was archived. Please "contact us" to request a format other than those available.
by Émilie Lavoie
Release date: July 12, 2017Acknowledgments
This project was carried out as part of a collaboration between Statistics Canada, Agriculture and Agri-Food Canada, and Innovation, Science and Economic Development Canada. The author wishes to thank Jacinthe Robichaud and her team at Agriculture and Agri-Food Canada for their helpful suggestions and comments.
This project was made possible thanks to the contribution of Jean-Pierre Corbeil, Chief for the Centre for Ethnocultural, Language and Immigration Statistics at Statistics Canada. Thanks also go to Jean-François Lepage for his advice. The author would like to thank them warmly for their involvement and their availability throughout this project.
Finally, the author thanks Deniz Do, Alejandro Paez Silva and Julie Bertrand for their collaboration in finalizing the report.
Quebec’s agriculture industry and the English-language minority
In 2011, there were 69,120 workers aged 15 and over in Quebec’s agricultural sector,Note 1 5.9% of whom were English-language workersNote 2 (4,045 workers). While the agriculture sector was concentrated mainly in the Montérégie, Chaudière-Appalaches, and Centre-du-Québec regions,Note 3 English-language agricultural workers in this sector were primarily found in other regions: Estrie (665 English-language agricultural workers, or 16.4% of English-language workers in Quebec), Montérégie (1,475 English-language agricultural workers, or 36.5% of English-language workers in Quebec), Montréal–Laval (580 English-language agricultural workers, or 14.3% of English-language workers in Quebec), Laurentides (370 English-language agricultural workers, or 9.1% of English-language workers in Quebec), and Outaouais (585 English-language agricultural workers, or 14.5% of English-language workers in Quebec). With the exception of the Montérégie region, the geographic distribution of Quebec’s English-language population of agricultural workers differs from the distribution of the province’s entire population of agricultural workers.Note 4 As can be seen in Map 1, the agricultural sector and the English-language minority population overlap only in a few of the province’s municipalities.Note 5
Quebec’s agri-food industry and the English-language minority
In 2011, 514,935 people aged 15 and over worked in Quebec’s agri-food sector,Note 6 13.6% of whom were English-language workers (70,245). The agri-food sector was concentrated in two main regions: Montréal–Laval and Montérégie. Nearly 70% of Quebec’s English-language workers agri-food workers were in the Montréal–Laval region (48,860 workers), and 15.0% were in the Montérégie region (10,545 workers). In these regions, English was the first language of 33.9% and 10.2%, respectively, of agri-food workers. As can be seen in Table 2 and Map 4, there was also a significant population of English-language workers in the following regions: Gaspésie–Îles-de-la-Madeleine (570 English-language agri-food workers, representing 7.3% of the sector’s workers in the region), Estrie (910 English-language agri-food workers, or 5.3% of the sector’s workers in the region), Laurentides (2,100 English-language agri-food workers, or 5.7% of the region’s workers in this sector), Outaouais (3,505 English-language agri-food workers, or 18.5% of the region’s workers in this sector), and Abitibi-Témiscamingue–Nord-du-Québec (885 English-language agri-food workers, or 8.6% of the region’s workers in this sector). Moreover, Map 3 illustrates that the agri-food sector and the English-language minority population overlap in only a few of the province’s municipalities.Note 7
Part 1: Portrait of Quebec’s agricultural industry and its English-language workers
Table 1 and Maps 1 and 2 above clearly show that English-language workers in Quebec’s agricultural sector were concentrated in five regions: Estrie, Montérégie, Montréal–Laval, Laurentides, and Outaouais. The portraits below will therefore focus on these regions.
Socioeconomic portrait of English-language workers in Quebec’s agriculture industry

Data table for Chart 1
| Estrie | Montérégie | Montréal - Laval | Laurentides | Outaouais | ||||||
|---|---|---|---|---|---|---|---|---|---|---|
| English-language workers | Other workers | English-language workers | Other workers | English-language workers | Other workers | English-language workers | Other workers | English-language workers | Other workers | |
| percent | ||||||||||
| 15 to 29 years | 18.8 | 28.5 | 24.7 | 22.5 | 37.9 | 29.0 | 39.2 | 23.4 | 23.9 | 28.9 |
| 30 to 49 years | 32.3 | 31.5 | 33.2 | 36.4 | 29.3 | 38.8 | 12.2 | 37.3 | 27.4 | 28.9 |
| 50 to 64 years | 30.8 | 29.9 | 34.2 | 30.9 | 27.6 | 26.4 | 23.0 | 31.3 | 29.9 | 33.7 |
| 65 and over | 18.8 | 10.3 | 8.1 | 9.9 | 5.2 | 4.3 | 25.7 | 8.2 | 19.7 | 9.0 |
| Source: Statistics Canada, National Household Survey 2011. | ||||||||||
- English-language agricultural workers in the Estrie and Outaouais Agricultural Regions were on average older than their counterparts belonging to other language groups. There was a lower proportion of English-language workers aged 15 to 29 and a higher proportion of those 65 years and over.
- In the Montréal–Laval Region, nearly 4 out of 10 English-language workers were between 15 and 29 years, a much higher proportion than for workers belonging to other language groups.
- In the Laurentides Region, there were significantly more English-language workers aged 15 to 29 (39.2%) and 65 years and over (25.7%) than workers from other language groups.
- In 2011, more than 6 in 10 English-language agricultural workers in Quebec’s agricultural regions were male.
- In the Montréal–Laval and Laurentides Regions, there were more men among English-language workers than among other language groups. Conversely, the proportion of men among English-language agricultural workers in the Montérégie Region was lower than among other agricultural workers.
- In all five Quebec agricultural regions listed in Table 3, English-language agricultural workers were more likely to be married, or separated, divorced, or widowed than their counterparts belonging to other language groups.Note 8 On the other hand, they were less likely to be in a common-law relationship.
- In the Estrie and Outaouais Agricultural Regions, English-language agricultural workers were less likely than other workers in this sector to be single. However, the opposite was observed in the Laurentides Region, where there were more single English-language workers.
- In three of Quebec’s agricultural regions (Estrie, Montérégie, and Laurentides), English-language agricultural workers had a higher level of education than their counterparts from other language groups. As a result, these workers were less likely to have a high school diplomaNote 9 or not to have a certificate, diploma, or degree.
- In the Outaouais region, English-language agricultural workers were more likely not to have a certificate, diploma, or degree and less likely to have a high school diploma.Note 10
- The level of education of English-language workers in the Montréal–Laval Agricultural Region differed from their counterparts belonging to other language groups. On average, they had a higher level of education and were more likely to have at least a high school diploma.Note 11
- Quebec’s English-language agricultural workers were less likely than workers from other language groups to have been born in their province of residence. Therefore, they were more likely to have been born in another Canadian province or outside Canada.
- In 2011, English-language agricultural workers in Quebec were much less likely to be Catholic than agricultural workers belonging to other language groups.
- As a general rule, English-language agricultural workers were more likely to adhere to the following religions: Anglican,Note 12 United Church,Note 13 Presbyterian,Note 14 and other Christian religions.Note 15 In addition, more of these workers declared having no religious affiliation.
- More English-language workers in the Montréal–Laval Region declared belonging to the Buddhist, Hindu, Jewish, Islamic, or Sikh religions, compared with their counterparts from other language groups.
- In 2011, more than one agricultural worker in two was an employee (all language groups combined), with the exception of English-language agricultural workers in the Outaouais and Estrie regions. In 2011, the Montréal–Laval region had the highest proportions of employees (86.2% of English-language workers and 88.2% of other workers in the sector).
- There were fewer employed English-language workers in the Estrie and Outaouais regions in 2011 than workers belonging to other language groups.
- In all of Quebec’s agricultural regions, but especially the Estrie and Outaouais regions, English-language agricultural workers were more likely to be self-employed in an unincorporated business than their counterparts belonging to other language groups.
Linguistic portrait of English-language workers in Quebec’s agriculture industry
Knowledge of official languages
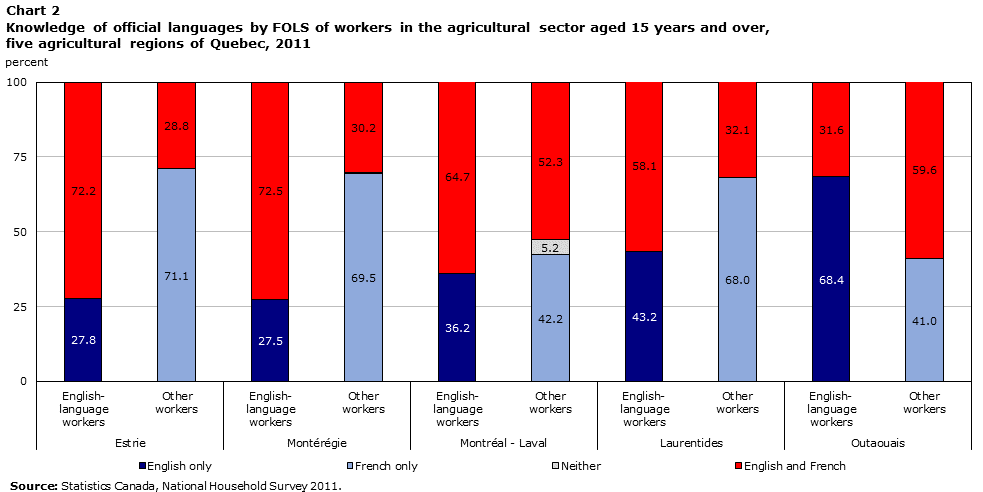
Data table for Chart 2
| Estrie | Montérégie | Montréal - Laval | Laurentides | Outaouais | ||||||
|---|---|---|---|---|---|---|---|---|---|---|
| English-language workers | Other workers | English-language workers | Other workers | English-language workers | Other workers | English-language workers | Other workers | English-language workers | Other workers | |
| percent | ||||||||||
| English only | 27.8 | 0.0 | 27.5 | 0.0 | 36.2 | 0.0 | 43.2 | 0.0 | 68.4 | 0.0 |
| French only | 0.0 | 71.1 | 0.0 | 69.5 | 0.0 | 42.2 | 0.0 | 68.0 | 0.0 | 41.0 |
| Neither | 0.0 | 0.0 | 0.0 | 0.2 | 0.0 | 5.2 | 0.0 | 0.0 | 0.0 | 0.0 |
| English and French | 72.2 | 28.8 | 72.5 | 30.2 | 64.7 | 52.3 | 58.1 | 32.1 | 31.6 | 59.6 |
| Source: Statistics Canada, National Household Survey 2011. | ||||||||||
- In 2011, the majority of English-language agricultural workers in Quebec (with the exception of the Outaouais region) knew both French and English. In the Outaouais region, 3 out of 10 English-language agricultural workers knew both French and English, compared with at least one English-language worker in two in the other agricultural regions.
- In 2011, a significant proportion of English-language workers knew only English, especially in the Outaouais Agricultural Region, where the proportion was just over two-thirds. In the other regions, proportions ranged from 27.5% (Montérégie) to 43.2% (Laurentides).
Languages spoken at home

Data table for Chart 3
| Estrie | Montérégie | Montréal - Laval | Laurentides | Outaouais | ||||||
|---|---|---|---|---|---|---|---|---|---|---|
| English-language workers | Other workers | English-language workers | Other workers | English-language workers | Other workers | English-language workers | Other workers | English-language workers | Other workers | |
| percent | ||||||||||
| English | 66.9 | 0.0 | 58.6 | 0.4 | 40.5 | 0.0 | 81.1 | 0.0 | 78.6 | 0.0 |
| French | 0.0 | 93.7 | 5.8 | 94.1 | 0.0 | 61.5 | 0.0 | 93.4 | 0.0 | 81.3 |
| Other languages | 0.0 | 1.3 | 6.1 | 1.3 | 43.1 | 30.5 | 6.8 | 1.7 | 6.8 | 3.6 |
| English and French | 27.8 | 4.8 | 29.5 | 4.1 | 12.9 | 7.2 | 8.1 | 4.8 | 12.0 | 13.9 |
|
||||||||||
- In all agricultural regions, except in the Montréal–Laval Region, the majority of English-language agricultural workers spoke only English at home in 2011.
- In the Montréal–Laval Region, there were more English-language agricultural workers who spoke a language other than French or English at home (43.1%) than who spoke only English at home (40.5%).
- In the Estrie and Montérégie Agricultural Regions, just over one in four English-language agricultural workers spoke both French and English at home.
Languages used at work
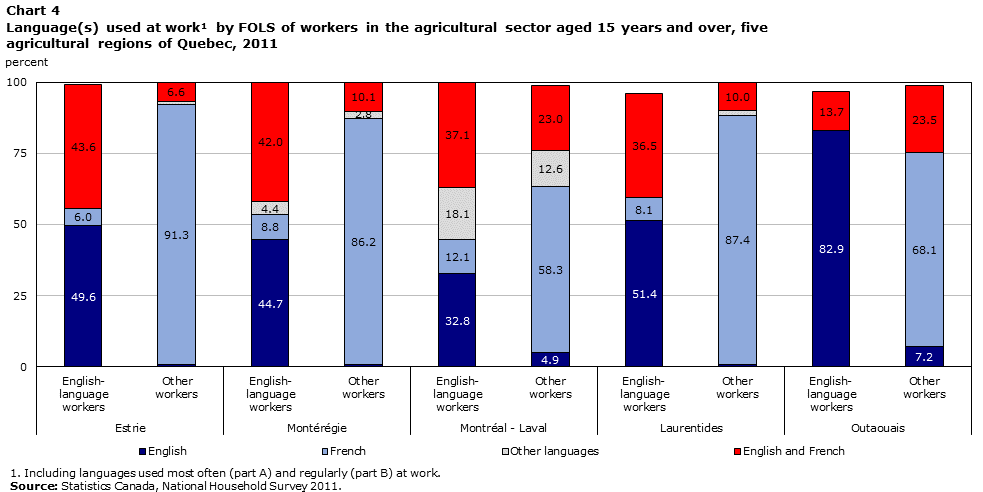
Data table for Chart 4
| Estrie | Montérégie | Montréal - Laval | Laurentides | Outaouais | ||||||
|---|---|---|---|---|---|---|---|---|---|---|
| English-language workers | Other workers | English-language workers | Other workers | English-language workers | Other workers | English-language workers | Other workers | English-language workers | Other workers | |
| percent | ||||||||||
| English | 49.6 | 0.9 | 44.7 | 0.9 | 32.8 | 4.9 | 51.4 | 0.9 | 82.9 | 7.2 |
| French | 6.0 | 91.3 | 8.8 | 86.2 | 12.1 | 58.3 | 8.1 | 87.4 | 0.0 | 68.1 |
| Other languages | 0.0 | 1.1 | 4.4 | 2.8 | 18.1 | 12.6 | 0.0 | 1.7 | 0.0 | 0.0 |
| English and French | 43.6 | 6.6 | 42.0 | 10.1 | 37.1 | 23.0 | 36.5 | 10.0 | 13.7 | 23.5 |
|
||||||||||
- In the Estrie, Montérégie, and Laurentides Agricultural Regions, there were more English-language agricultural workers who spoke only English at work than who spoke both French and English. The same was true in the Outaouais Region, where just over 8 out of 10 English-language workers spoke English at work, a much higher proportion than in Quebec’s other agricultural regions.
- French as the only language spoken at work was infrequent among English-language agricultural workers in 2011, with proportions ranging from 6.0% in the Estrie Region to 12.1% in the Montréal–Laval Region. In the Outaouais region, there were no English-language workers who spoke only French at work.
Agricultural portrait of five Quebec regions
Unlike the previous sections, this agricultural portrait focuses on the characteristics of farms and farm operators in Quebec’s five agricultural regions.Note 16
- There were more sole proprietorships in the Laurentides (50.3%) and Outaouais (66.5%) Regions than in the entire province (45.4%).
- In addition, there were more farms with partnerships, with or without a written agreement, in Quebec’s five agricultural regions, compared with all farms across the province, with the exception of the partnerships with a written agreement in the Montréal–Laval and Outaouais Regions.
- Family and non-family incorporated farms were less common in the Estrie, Laurentides, and Outaouais Regions.
- Farms in the Montréal–Laval Region were generally smaller than farms in the entire province. There were many more farms of less than 130 acres (88.5% compared with 39.8% for the entire province) and fewer larger farms. The same trend was observed in the agricultural regions around the Montréal–Laval Region (i.e., Montérégie and Laurentides Regions), though to a lesser extent.
- The Estrie and Outaouais Regions had fewer small farms (less than 130 acres) and more medium-sized farms (130 to 1,119 acres).
- In 2011, operators owned most of the farmland in Quebec: from 87.2% in the Montréal–Laval Region to 97.0% in the Outaouais Region (95.6% of all farms in the province).
- In terms of land tenure, few differences were noted from one agricultural region to the next, as well as in comparison with the entire province, with the exception of the Montréal–Laval Region. In this region, there was a lower proportion of land being reported as owned, leased from others or used by others, compared with all the farms in the province. Conversely, there was a higher proportion of land used under other arrangements.
- In the Montérégie and Montréal–Laval Regions, more farms used computers and the Internet for farm operations compared with all farms in Quebec. More than one in two farms in the Montréal–Laval Region had high-speed Internet access, a proportion higher than for all farms in the province (40.6%).
- In the Outaouais Region, fewer farms used computers and the Internet for farm operations, compared with farms across Quebec. In addition, fewer farms in the Outaouais, Estrie, and Laurentides Regions had high-speed Internet access.
- In the Estrie and Outaouais Regions, the total value of farm capital and gross farm revenue was lower, compared with all farms in the province. In these regions, there were more farms valued at less than $1,500,000 or with farm revenue of less than $100,000, compared with all farms in Quebec.
- In the Montérégie and Montréal–Laval Regions, farms were more likely to have higher farm capital value ($1,500,000 and up) or higher gross farm revenues.
- For the three indicators in Table 12, the Montréal–Laval Region and the Outaouais Region show opposite trends. In the Montréal–Laval Region, there was a higher proportion of workers who did not live on the farm, compared with all farm operators in Quebec. The opposite was true in the Outaouais Region. The same trend was noted for the average number of hours worked and the average number of hours worked at a paid non-farm job.Note 17
- Cattle farming varies greatly from one agricultural region to the next, especially when compared with all farms in Quebec. There were more cattle farms in the Estrie and Outaouais Regions (37.4% and 39.2% respectively) and fewer in the other three regions (22.8% in the Montérégie Region, 4.5% in the Montréal–Laval Region, and 22.2% in the Laurentides Region), compared with all farms in Quebec (30.8%).
- Compared with all farms in Quebec, there were fewer dairy cattle operationsNote 18 and hog farms in the five agricultural regions examined.Note 19
- As for other types of livestock production, there were more apiculture operations in the Montréal–Laval Region, as well as more horse and other equine production operations in the Laurentides and Outaouais Regions, compared with all farms in Quebec.
- Oilseed and grain farming, especially corn, was less prevalent in the regions examined, compared with the entire province. The Montérégie Region was the only region to stand out, with 3 in 10 farms reporting growing oilseed and cereal crops in 2011 (one in five farms grew corn). This proportion is significantly higher than the proportion observed for the entire province.
- Compared with all farms in Quebec, more farms in the Montréal–Laval Region reported growing vegetables and melons (with the exception of potatoes), and more farms in the Montréal–Laval and Laurentides Regions reported fruit and tree nut farming as well as greenhouse, nursery and floricultureNote 20 production.
- There was little production of maple syrup and other maple products in the regions examined, with the exception of the Estrie Region, where one in five farms reported this type of production in 2011.
- Just over one in five farms in the Outaouais region reported growing hay in 2011, a higher proportion than for all farms in Quebec.
Part 2: Socioeconomic and linguistic portraits of workers in Quebec’s agri-food industry
Table 2 and Maps 3 and 4 above clearly illustrate that English-language workers in Quebec’s agri-food sector were concentrated in seven regions: Gaspésie–Îles-de-la-Madeleine, Estrie, Montérégie, Montréal–Laval, Laurentides, Outaouais, and Abitibi-Témiscamingue–Nord-du-Québec. Therefore, the following portraits will focus on these regions.
Socioeconomic portrait of English-language workers in Quebec’s agri-food industry
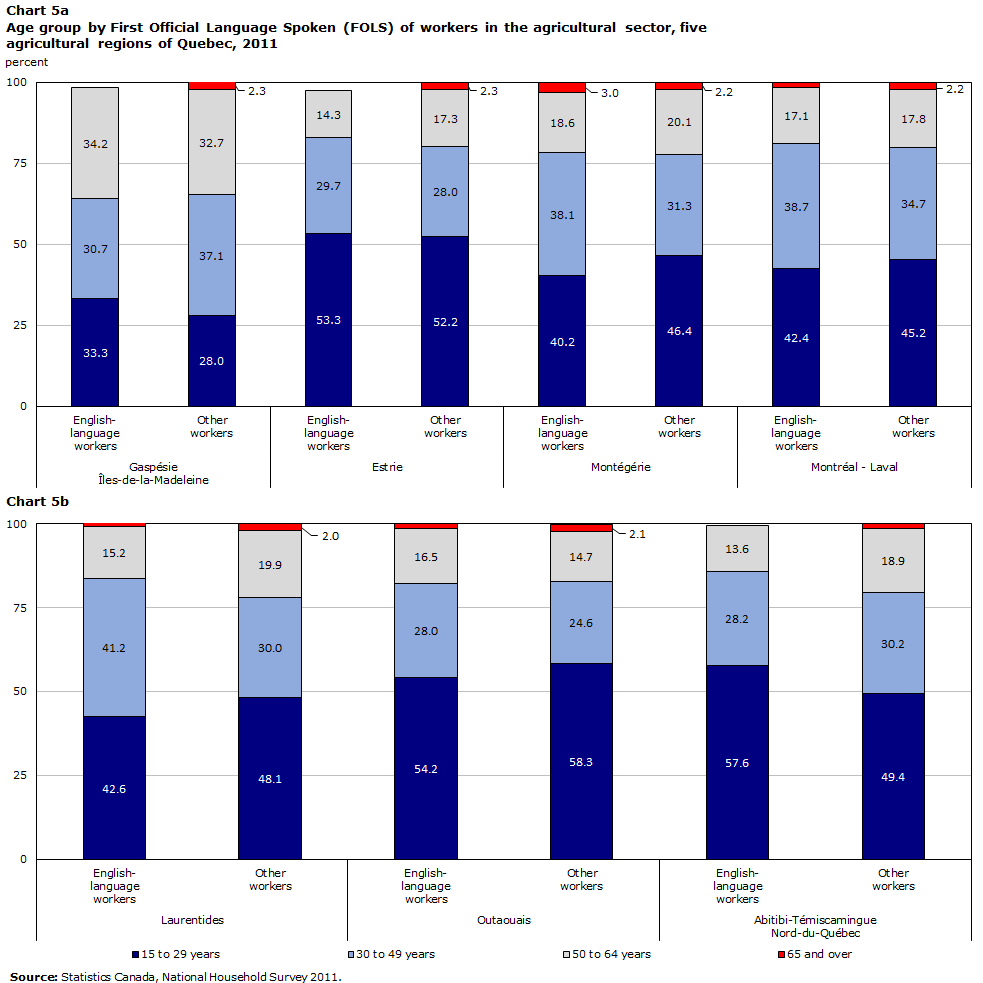
Data table for Chart 5a and 5b
| Gaspésie Îles-de-la-Madeleine | Estrie | Montégérie | Montréal - Laval | |||||
|---|---|---|---|---|---|---|---|---|
| English-language workers | Other workers | English-language workers | Other workers | English-language workers | Other workers | English-language workers | Other workers | |
| percent | ||||||||
| 15 to 29 years | 33.3 | 28.0 | 53.3 | 52.2 | 40.2 | 46.4 | 42.4 | 45.2 |
| 30 to 49 years | 30.7 | 37.1 | 29.7 | 28.0 | 38.1 | 31.3 | 38.7 | 34.7 |
| 50 to 64 years | 34.2 | 32.7 | 14.3 | 17.3 | 18.6 | 20.1 | 17.1 | 17.8 |
| 65 and over | 0.0 | 2.3 | 0.0 | 2.3 | 3.0 | 2.2 | 1.8 | 2.2 |
| Laurentides | Outaouais | Abitibi-Témiscamingue Nord-du-Québec | ||||
|---|---|---|---|---|---|---|
| English-language workers | Other workers | English-language workers | Other workers | English-language workers | Other workers | |
| percent | ||||||
| 15 to 29 years | 42.6 | 48.1 | 54.2 | 58.3 | 57.6 | 49.4 |
| 30 to 49 years | 41.2 | 30.0 | 28.0 | 24.6 | 28.2 | 30.2 |
| 50 to 64 years | 15.2 | 19.9 | 16.5 | 14.7 | 13.6 | 18.9 |
| 65 and over | 1.2 | 2.0 | 1.3 | 2.1 | 0.0 | 1.5 |
| Source: Statistics Canada, National Household Survey 2011. | ||||||
- Agri-food workers in the Estrie, Outaouais, and Abitibi-Témiscamingue–Nord-du-Québec Regions were young (more than one in two workers was aged 15 to 29), while workers in the Gaspésie–Îles-de-la-Madeleine Region were older (less than one third were aged 15 to 29). Just over one in three workers in the Gaspésie–Îles-de-la-Madeleine Region was 50 years and over, compared with one in five workers in the other agricultural regions.
- In the three other regions (Montérégie, Montréal–Laval, and Laurentides), the age structure of agri-food workers did not vary by language groups.
- In 2011, a higher proportion of English-language agri-food workers were women, compared with their colleagues in other language groups. In the Gaspésie–Îles-de-la-Madeleine Region, 64.0% of English-language agri-food workers were women, compared with 56.8% of the other workers in this sector.
- English-language workers in Quebec’s agri-food sector were more likely to be married and less likely to be in a common-law relationship, compared with French-language workers and workers belonging to other language groups.
- Similarly, in all of Quebec’s agricultural regions, with the exception of Abitibi-Témiscamingue–Nord-du-Québec, English-language workers were less likely than their counterparts from other language groups to be single. In addition, English-language workers in this region were less likely to be separated, divorced, or widowed.
- In the majority of Quebec’s agricultural regions, English-language agri-food workers were less likely to not have a certificate, diploma, or degree, and more likely to have a high school diploma,Note 21 compared with the other workers in this sector.
- The only regions in which English-language workers were more likely to have no certificate, diploma or degree, and less likely to have a high school diploma, are the Estrie and Abitibi-Témiscamingue–Nord-du-Québec Regions.Note 22
- Compared with French-language workers and workers belonging to other language groups, English-language agri-food workers were more likely to have a college certificate or diplomaNote 23 or a bachelor’s degree.Note 24
- In 2011, the majority of English-language agri-food workers were born in Quebec, their province of residence. There were, however, exceptions: the majority of English-language workers in the Montréal–Laval Region were born outside the country and the majority of English-language workers in the Outaouais Region were born in another province.
- Compared with French-language workers and those belonging to other language groups, fewer English-language agri-food workers were born in Quebec and more were born in another province or outside the country.
- English-language agri-food workers adhered to more religions than workers belonging to other language groups. While Catholicism was widespread among the latter group, it was much less common among English-language workers in Quebec.
- As a general rule, more English-language workers declared having no religious affiliation than their colleagues belonging to other language groups.Note 25
- In 2011, the vast majority of English-language workers in Quebec’s agri-food sector were employees, with proportions ranging from 88.8% in the Montérégie Region to 96.5% in the Gaspésie–Îles-de-la-Madeleine Region.
- In the majority of agricultural regions, English-language workers were less likely than their counterparts from other language groupsNote 26 to be employees. However, more English-language workers were self-employed, regardless of whether their business was incorporated or not.Note 27
- In all agricultural regions, with the exception of Abitibi-Témiscamingue–Nord-du-Québec, English-language agri-food workers were more likely to work in the restaurant and food services subsector, compared with their colleagues belonging to other language groups.
Linguistic portrait of English-language workers in Quebec’s agri-food industry
Knowledge of official languages

Data table for Chart 6a and 6b
| Gaspésie Îles-de-la-Madeleine | Estrie | Montégérie | Montréal - Laval | |||||
|---|---|---|---|---|---|---|---|---|
| English-language workers | Other workers | English-language workers | Other workers | English-language workers | Other workers | English-language workers | Other workers | |
| percent | ||||||||
| English only | 39.5 | 0.0 | 17.6 | 0.0 | 25.3 | 0.0 | 31.1 | 0.0 |
| French only | 0.0 | 81.4 | 0.0 | 58.5 | 0.0 | 53.9 | 0.0 | 34.9 |
| English and French | 60.5 | 18.6 | 82.4 | 41.2 | 74.6 | 45.4 | 68.8 | 62.7 |
| Neither | 0.0 | 0.0 | 0.0 | 0.2 | 0.0 | 0.6 | 0.1 | 2.4 |
| Laurentides | Outaouais | Abitibi-Témiscamingue Nord-du-Québec |
||||
|---|---|---|---|---|---|---|
| English-language workers | Other workers | English-language workers | Other workers | English-language workers | Other workers | |
| percent | ||||||
| English only | 18.1 | 0.0 | 43.5 | 0.0 | 69.5 | 0.0 |
| French only | 0.0 | 53.3 | 0.0 | 34.0 | 0.0 | 71.1 |
| English and French | 82.1 | 46.5 | 56.6 | 65.7 | 31.1 | 29.0 |
| Neither | 0.0 | 0.2 | 0.0 | 0.2 | 0.0 | 0.0 |
| Source: Statistics Canada, National Household Survey 2011. | ||||||
- In 2011, knowledge of French only was non-existent among English-language workers in Quebec.
- The majority of English-language agri-food workers knew both French and English in 2011, with proportions ranging from 56.6% in the Outaouais Region to 82.4% in the Estrie Region. The only exception was in the Abitibi-Témiscamingue–Nord-du-Québec Region, where less than one in three workers (31.1%) knew both languages.
- In 2011, a significant proportion of English-language workers knew only English, particularly in the Abitibi-Témiscamingue–Nord-du-Québec Region (7 in 10 workers), while proportions in other regions ranged from 17.6% (Estrie) to 43.5% (Outaouais).
Languages spoken at home
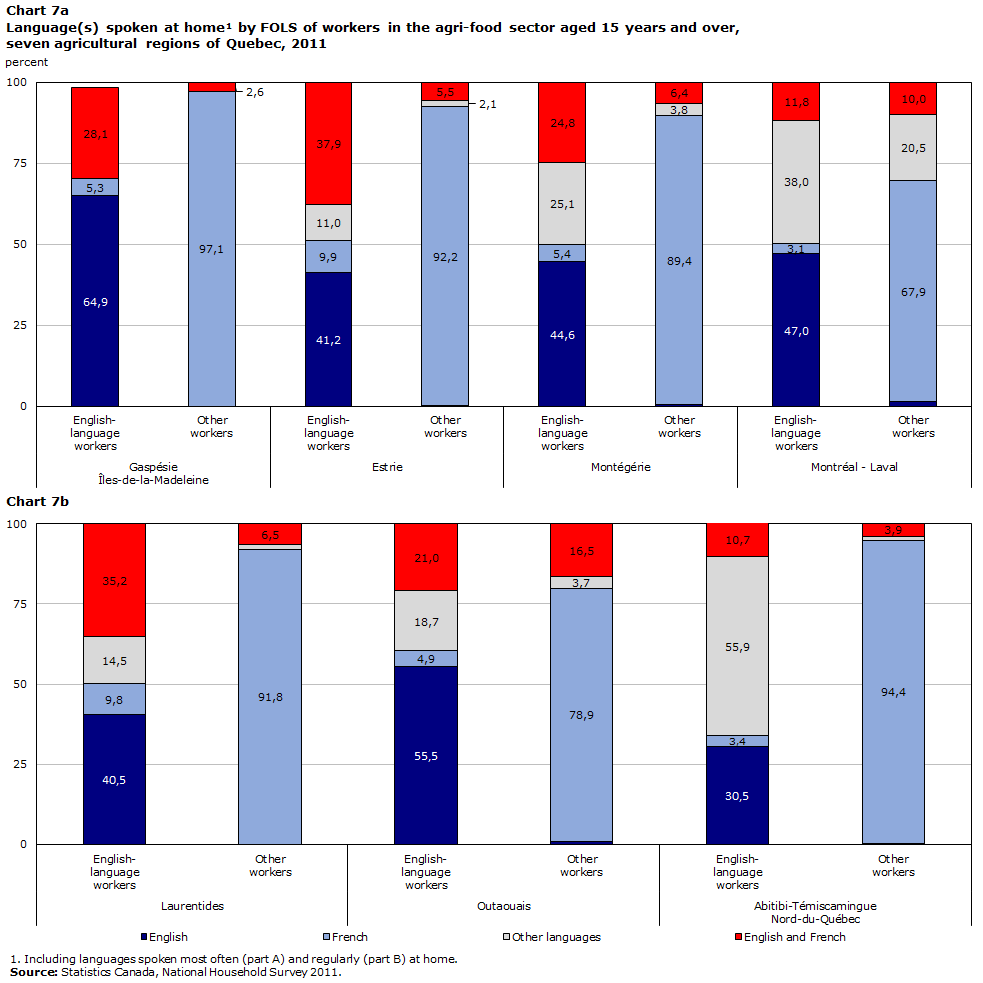
Data table for Chart 7a and 7b
| Gaspésie Îles-de-la-Madeleine | Estrie | Montégérie | Montréal - Laval | |||||
|---|---|---|---|---|---|---|---|---|
| English-language workers | Other workers | English-language workers | Other workers | English-language workers | Other workers | English-language workers | Other workers | |
| percent | ||||||||
| English | 64.9 | 0.0 | 41.2 | 0.2 | 44.6 | 0.4 | 47.0 | 1.6 |
| French | 5.3 | 97.1 | 9.9 | 92.2 | 5.4 | 89.4 | 3.1 | 67.9 |
| Other languages | 0.0 | 0.0 | 11.0 | 2.1 | 25.1 | 3.8 | 38.0 | 20.5 |
| English and French | 28.1 | 2.6 | 37.9 | 5.5 | 24.8 | 6.4 | 11.8 | 10.0 |
| Laurentides | Outaouais | Abitibi-Témiscamingue Nord-du-Québec | ||||
|---|---|---|---|---|---|---|
| English-language workers | Other workers | English-language workers | Other workers | English-language workers | Other workers | |
| percent | ||||||
| English | 40.5 | 0.1 | 55.5 | 1.0 | 30.5 | 0.4 |
| French | 9.8 | 91.8 | 4.9 | 78.9 | 3.4 | 94.4 |
| Other languages | 14.5 | 1.5 | 18.7 | 3.7 | 55.9 | 1.4 |
| English and French | 35.2 | 6.5 | 21.0 | 16.5 | 10.7 | 3.9 |
|
||||||
- In the Gaspésie–Îles-de-la-Madeleine and Outaouais Regions, more than one in two English-language workers spoke only English at home (64.9% and 55.5% respectively). This was also the case for between 30.0% and 45.0% of English-language workers across the regions.
- The majority of English-language workers in the Abitibi-Témiscamingue–Nord-du-Québec Region spoke a language other than French or English at home. This was also true of a significant proportion of English-language workers in the Montérégie Region (25.1%) and the Montréal–Laval Region (38.0%).
- A higher proportion of English-language workers spoke both English and French at home compared with workers belonging to other language groups. Differences were particularly striking in the Gaspésie–Îles-de-la-Madeleine Region (28.1% of English-language workers, versus 2.6% of other workers in this sector), the Estrie Region (37.9% versus 5.5%), the Montérégie Region (24.8% versus 6.4%), and the Laurentides Regions (35.2% versus 6.5%).
Languages used at work
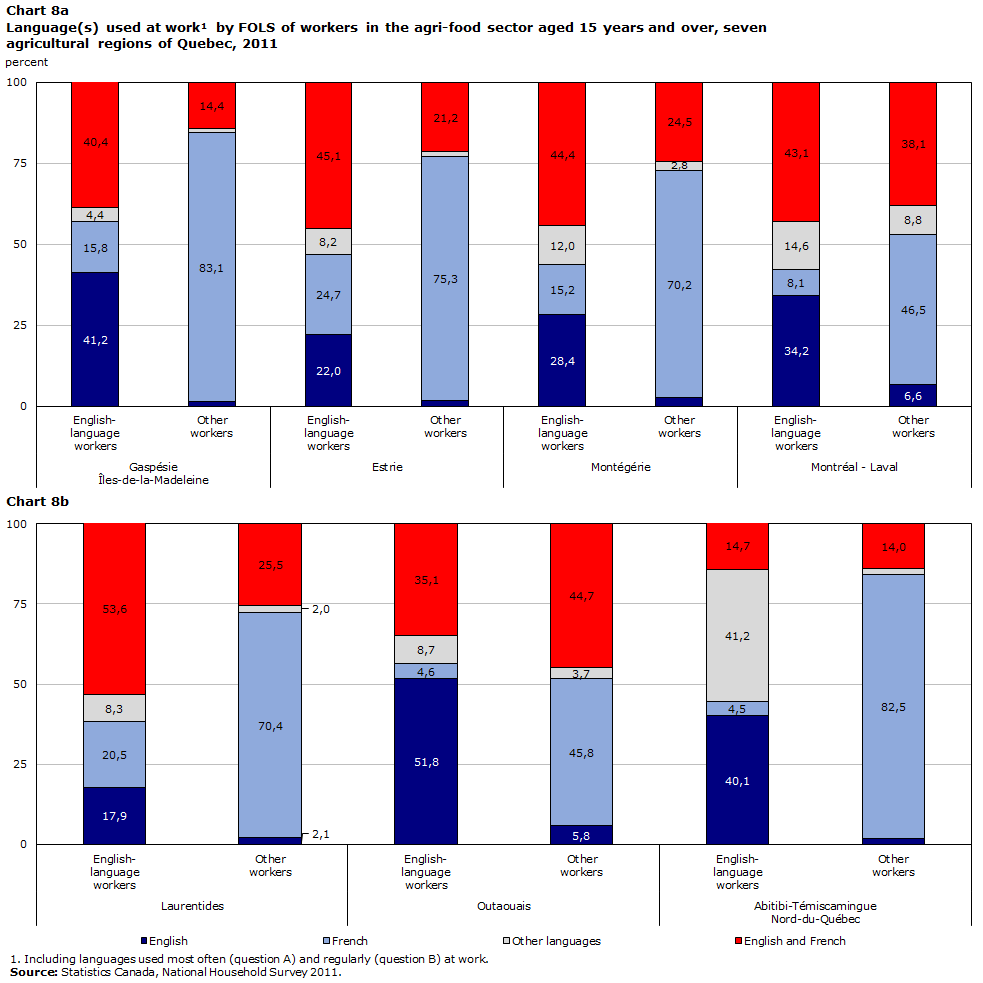
Data table for Chart 8a and 8b
| Gaspésie Îles-de-la-Madeleine |
Estrie | Montégérie | Montréal - Laval | |||||
|---|---|---|---|---|---|---|---|---|
| English-language workers | Other workers | English-language workers | Other workers | English-language workers | Other workers | English-language workers | Other workers | |
| percent | ||||||||
| English | 41.2 | 1.3 | 22.0 | 1.6 | 28.4 | 2.5 | 34.2 | 6.6 |
| French | 15.8 | 83.1 | 24.7 | 75.3 | 15.2 | 70.2 | 8.1 | 46.5 |
| Other languages | 4.4 | 1.2 | 8.2 | 1.6 | 12.0 | 2.8 | 14.6 | 8.8 |
| English and French | 40.4 | 14.4 | 45.1 | 21.2 | 44.4 | 24.5 | 43.1 | 38.1 |
| Laurentides | Outaouais | Abitibi-Témiscamingue Nord-du-Québec |
||||
|---|---|---|---|---|---|---|
| English-language workers | Other workers | English-language workers | Other workers | English-language workers | Other workers | |
| percent | ||||||
| English | 17.9 | 2.1 | 51.8 | 5.8 | 40.1 | 1.7 |
| French | 20.5 | 70.4 | 4.6 | 45.8 | 4.5 | 82.5 |
| Other languages | 8.3 | 2.0 | 8.7 | 3.7 | 41.2 | 1.9 |
| English and French | 53.6 | 25.5 | 35.1 | 44.7 | 14.7 | 14.0 |
|
||||||
- In the majority of agricultural regions, between 35% and 55% of English-language agri-food workers spoke both French and English at work in 2011. However, this proportion never exceeded 15% in the Abitibi-Témiscamingue–Nord-du-Québec Region.
- In 2011, languages other than French and English were used more often at work than French in the agri-food sector. In addition, just over 4 out of 10 English-language workers in the Abitibi-Témiscamingue–Nord-du-Québec Region used a language other than French or English at work.
- In the Laurentides and Estrie Regions, use of French only at work slightly surpassed the use of English only.
- In the Outaouais Region, just over one in two English-language workers spoke only English at work, a higher proportion than in the province’s other agricultural regions.
Appendices
Appendix 1 – Industries in the agricultural sector
Appendix 2 – Agricultural sector and official language minorities in the census subdivisions
Appendix 3 – Industries in the agri-food sector
Appendix 4 – Agri-food sector and official language minorities in the census subdivisions
Notes
- Date modified: