
Firearms and violent crime in Canada, 2022
by Samuel Perreault
Highlights
- Police services in Canada reported around 14,000 incidents of firearm-related violent crime in 2022, roughly 1,400 more than the previous year.
- In 2022, the rate of firearm-related violent crime was 36.7 incidents per 100,000 population, an 8.9% increase from 2021 (33.7 incidents per 100,000 population). This is the highest rate recorded since comparable data were first collected in 2009.
- The increase in the rate of firearm-related violent crime from 2021 is mainly attributable to fairly significant increases in Ontario (1,016 more incidents, a rate increase of 24%), New Brunswick (64 more incidents, a rate increase of 24%) and British Columbia (194 more incidents, a rate increase of 12%).
- In Toronto, Canada’s largest census metropolitan area (CMA), the proportion of violent crimes that were firearm-related (4.7%) was the second-highest among CMAs. Its rate of firearm-related violent crime (43.2 incidents per 100,000 population) rose 36% from 2021 and 93% since a low in 2013.
- Canada’s other two largest CMAs also saw their rate of firearm-related violent crime increase in 2022. In Montréal, the rate (28.0 incidents per 100,000 population) increased slightly (+0.4%) from 2021, following a 12% increase from 2020 to 2021. In Vancouver, the rate (23.6 incidents per 100,000 population) increased 24% from 2021.
- From 2009 to 2013, the rate of firearm-related violent crime in Canada saw a relatively significant drop of 30% (33.9 incidents to 23.7 incidents per 100,000 population). Since then, the rate has been rising again.
- Both the violent crime rate and the rate of firearm-related violent crime have increased since 2013, but the increase in firearm-related violent crimes was larger (+55% compared with +24%). The rate of firearm-related violent crime increased because violent crime in general is on the rise, but also because violent crimes are increasingly likely to involve firearms (2.8% of violent crimes in 2022 compared with 2.2% in 2013).
- The increase in the rate of firearm-related violent crime can be seen for almost all violent offences. Over the last few years, robbery has been one of the few crimes for which the rate was declining, whether a firearm was involved or not. However, the rate of robbery involving a firearm saw an increase in 2022 (from 7.9 incidents per 100,000 population in 2021 to 9.8 in 2022).
- The rate of firearm-related violent crime was largely driven upward by violent offences specific to firearms—discharging a firearm with intent, using a firearm in the commission of an offence, pointing a firearm—for which the rate has more than doubled since 2013 to reach 12.2 incidents per 100,000 population in 2022.
- All provinces and territories have seen the rate of firearm-related violent crime increase since the low in 2013. The largest increases were recorded in the Northwest Territories (+303%), Saskatchewan (+165%), Yukon (+149%) and New Brunswick (+126%).
- Among the provinces, Saskatchewan (109.6 incidents per 100,000 population) had the highest rate of firearm-related violent crime in 2022, while Prince Edward Island recorded the lowest rate (10.0 incidents per 100,000 population).
- In 2022, Regina (83.0 incidents per 100,000 population, representing 7.0% of violent crimes) recorded the highest rate and percentage of firearm-related violent crime among CMAs.
- The increase in firearm-related violent crime from 2013 to 2022 was especially large in the territories (+139%) and in rural areas of the Provincial North (+141%). In urban areas in the Provincial South, the rate rose 45% during this period.
- The increase in the rate of firearm-related violent crime can be seen for all types of firearms. However, crimes involving handguns (+50%) and firearms in the “firearm-like weapons or unknown types of firearms” category (+76%) have increased the most since 2013.
- In 2022, 1.7% of victims of violent crimes who sustained injuries were injured by a firearm. However, this proportion varies according to the level of injury: a firearm was involved in 1.0% of minor injuries, 8.6% of major injuries and 40% of fatal injuries.
- Unlike violent crimes in general, in which the majority (53%) of victims were women, firearm-related violent crimes mostly targeted men in 2022 (66%). Men also accounted for approximately 8 in 10 victims injured by firearms.
- Like for violent crimes in general, most persons accused of firearm-related violent crimes in 2022 (89%) were men. However, the rate of accused women rose faster over the last ten years (+88% compared with +26% among men).
- Compared with violent crimes in general, firearm-related violent crimes were more likely to have been committed by more than one accused person (25% compared with 6.0%) or to have resulted in more than one victim (22% compared with 10%).
- In 2022, organized crime or gang-related crime accounted for 4.3% of firearm-related violent crime. This proportion is higher than for violent crimes in general (0.3%). In addition, 9.4% of firearm-related violent crimes resulting in major injuries and nearly half of those resulting in the death of the victim were organized crime-related.
- The rate of firearm-related homicide stood at 0.88 incidents per 100,000 population in 2022, the highest rate observed since 1991. Since 2016, firearms have been the main method for committing homicide, overtaking knives and other sharp objects. This increase is mostly due to homicides involving handguns.
Firearm-related violent crime represents a small proportion of crimes in Canada, among both police-reported crime and crimes reported by Canadians in victimization surveys. However, firearm-related violent crimes represent a larger share of the most serious crimes—such as homicide, attempted murder, robbery and aggravated assault—and gang-related crime.
Firearm-related violent crime can have major detrimental impacts on the affected persons and communities. These of course include the physical injuries, often more serious or lethal compared to crimes committed with other types of weapons. Exposure to firearm-related violence is also known to impact mental health (Holloway et al., 2023; Turner et al., 2019). These physical injuries and the impacts on mental health can result in significant costs for the healthcare system. In addition, firearm-related crime can adversely affect the perception of crime and safety, particularly because of the extensive media coverage that these incidents sometimes receive. Further, it has been established that an increase in or high level of firearm-related crime can have a negative impact on a community’s economy and well-being (Glasser et al., 2022; Irvin-Erickson et al., 2017).
As a result, firearm-related violent crime remains a major concern in terms of public safety and justice, and the challenges associated with gun control regularly fuel public debate. Over the past few years, various legislative changes, funding mechanisms, and programs aimed at reducing and preventing this type of crime have been proposed or implemented (Public Safety Canada, 2021, December 2; Public Safety Canada, 2023, November 3).
Using data from the Uniform Crime Reporting Survey and the Homicide Survey, this Juristat article examines the latest trends in firearm-related violent crime, as well as certain characteristics of these incidents, the victims and the accused persons.
This article was produced with funding from Public Safety Canada.
The rate of firearm-related violent crime reaches a 14-year high
In 2022, police services in Canada reported nearly 14,000 firearm-related violent crimesNote (see definition in Text box 1), representing 2.8% of all violent crimes reported by the police that year (Table 1).
The rate of firearm-related violent crime was 36.7 incidents per 100,000 population in 2022. This is an 8.9% increase from the previous year, when the rate was 33.7 incidents per 100,000 population. Moreover, firearm-related violent crime increased more quickly than other types of violent crimes. From 2021 to 2022, the firearm-related violent crime rate rose 8.9%, while the increase was 2.7% for all violent crimes combined (Chart 1).
Chart 1 start

Data table for Chart 1
| Year | Incidents of firearm-related violent crime | Victims of firearm-related violent crime | Total violent crime incidents |
|---|---|---|---|
| rate per 100,000 population | |||
| 2009 | 33.9 | 29.4 | 1,300.8 |
| 2010 | 29.3 | 25.3 | 1,267.7 |
| 2011 | 28.4 | 24.6 | 1,217.0 |
| 2012 | 27.2 | 23.1 | 1,174.4 |
| 2013 | 23.7 | 20.4 | 1,075.1 |
| 2014 | 25.0 | 21.5 | 1,025.8 |
| 2015 | 28.6 | 24.4 | 1,048.8 |
| 2016 | 28.8 | 24.5 | 1,046.6 |
| 2017 | 30.5 | 26.0 | 1,079.5 |
| 2018 | 30.2 | 25.3 | 1,116.6 |
| 2019 | 32.5 | 26.5 | 1,244.7 |
| 2020 | 34.1 | 27.4 | 1,231.5 |
| 2021 | 33.7 | 26.9 | 1,297.4 |
| 2022 | 36.7 | 29.2 | 1,332.2 |
|
Note: Firearm-related violent crimes include incidents where the most serious violation is a firearm-specific violent offence (pointing a firearm, discharging a firearm with intent, use of a firearm in the commission of an offence) and other violent crimes where the most serious weapon present in the incident was a firearm. The number of incidents represents the number of victims, in addition to incidents for which the police did not provide victim records. Rates are calculated on the basis of 100,000 population. Populations are based upon July 1 estimates from Statistics Canada, Centre for Demography. Source: Statistics Canada, Canadian Centre for Justice and Community Safety Statistics, Uniform Crime Reporting Survey (Trend Database). |
|||
Chart 1 end
Since comparable data became available in 2009, the rate of firearm-related violent crime reached a low in 2013 (23.7 incidents per 100,000 population), after which a general upward trend began. The year 2021 saw a certain lull, with the rate having dropped slightly from 2020 before rising again in 2022. In fact, the rate of firearm-related violent crime in 2022 was 55% higher than the low in 2013.
Generally speaking, the trend for all violent crime—whether or not a firearm was involved—was rather similar to the trend observed for firearm-related violent crime. The rate of violent crimes reached a low in 2014, then generally trended upward, marked by a few annual fluctuations. However, the increase in the rate of all violent crime was more modest than the increase for firearm-related violent crime, rising 30% from the low in 2014. By comparison, the rate of firearm-related violent crime has increased by 55% since the low in 2013, and by 47% since 2014.
The proportion of victims injured by a firearm is increasing
For the Incident-based Uniform Crime Reporting Survey, police services collect information on injuries suffered by victims, including on the weapon that caused the injuries. Injuries caused by a firearm are still relatively rare: 1.7% of injuries suffered by victims of violent crimes were caused by a firearm in 2022. The remaining victims were injured by physical force (74%), a knife or sharp object (6.9%), burning liquid or spray such as pepper spray (4.6%), a blunt instrument (3.7%) or another weapon (9.5%) (Chart 2). However, the proportion of victims injured by a firearm varies depending on the level of injury. For example, a firearm was used in 1.0% of cases where victims suffered minor injuries. This proportion rose to 8.6% of victims who suffered major injuries and 40% of victims who were fatally injured.
Chart 2 start

Data table for Chart 2
| Year | Firearm | Knife or sharp object | Blunt instrument | Burning liquidData table for Chart 2 Note 1 | Other weapon |
|---|---|---|---|---|---|
| percent | |||||
| 2009 | 1.2 | 5.4 | 3.5 | 0.0 | 10.5 |
| 2010 | 1.0 | 5.1 | 2.9 | 0.0 | 10.4 |
| 2011 | 0.9 | 5.2 | 3.0 | 0.0 | 10.6 |
| 2012 | 1.0 | 5.1 | 2.9 | 0.0 | 10.8 |
| 2013 | 1.0 | 5.6 | 2.9 | 0.2 | 10.1 |
| 2014 | 1.1 | 6.1 | 3.2 | 1.3 | 9.1 |
| 2015 | 1.3 | 6.1 | 3.3 | 2.0 | 9.1 |
| 2016 | 1.4 | 6.3 | 3.2 | 2.4 | 9.0 |
| 2017 | 1.5 | 6.6 | 3.4 | 3.0 | 8.8 |
| 2018 | 1.4 | 6.4 | 3.3 | 3.3 | 8.9 |
| 2019 | 1.5 | 6.5 | 3.3 | 3.7 | 9.0 |
| 2020 | 1.7 | 6.9 | 3.6 | 4.4 | 9.4 |
| 2021 | 1.7 | 6.7 | 3.8 | 4.6 | 9.7 |
| 2022 | 1.7 | 6.9 | 3.7 | 4.6 | 9.5 |
Source: Statistics Canada, Canadian Centre for Justice and Community Safety Statistics, Uniform Crime Reporting Survey (Trend Database). |
|||||
Chart 2 end
In addition, trend analysis reveals that on the one hand, an increasingly large proportion of victims are injured after being attacked with a weapon, as opposed to being injured from, for example, a beating. On the other hand, the proportion of victims whose injuries were caused by a firearm increased more quickly than for most other types of weapons. In 2013, when the rate of firearm-related violent crime fell to a low, 1.0% of injuries suffered by victims of violent crimes had been caused by a firearm. In 2022, this proportion was 1.7%—an increase of 76%. By comparison, the proportion of victims whose injuries were caused by a knife or sharp object rose 25% during this same period. The proportions of victims whose injuries were caused by a blunt object (+27%) or by another weapon (+37%) have also increased since 2013.
Start of text box 1
Text box 1
Measuring firearm-related violent crime
For the purposes of this analysis, a firearm-related violent crime refers to a crime where a firearm was present during the commission of the offence and for which the police determined that the firearm was relevant to the crime, whether or not it was used. Crimes involving a firearm-like weapon, such as an imitation weapon or a pellet gun, are also included in the analyses. Firearm-specific offences—such as discharging a firearm with intent, pointing a firearm and using a firearm during the commission of an offence—are also counted as crimes involving firearms, including cases in which information on the weapon was unknown. Information on the presence of a firearm comes from the Incident-based Uniform Crime Reporting Survey (UCR2), which covers 99% of the Canadian population.
Various approaches can be taken to measure violent crime. First, analyses can be based on the number of victims. When many persons are victims in the same incident, a single incident is counted multiple times, once per victim record. However, for some violent offences reported in the UCR2 survey, information on the victims may not always be provided.Note For firearm-specific violent crimes, a victim record may be provided, but is not required. The same applies for robberies and threats. This is why another method of measuring firearm-related violent crime involves taking into account the number of incidents instead of the number of victims. With this method, each incident is counted the same way, whether or not there is any information on the victims and regardless of the number of victims.
Finally, there is a hybrid approach that involves counting incidents by the number of victims, but also includes incidents for which the police did not provide information on the victims; these incidents are counted as one incident. The annual release on police-reported crime statistics is usually based on this approach (Statistics Canada 2023, July 27).
Although various approaches can be used to measure firearm crime, it should be noted that they all produce relatively similar results. Therefore, regardless of the approach, firearm-related violent crime has been trending upward since the low in 2013.
That said, over the past few years, the increase in firearm-related violent crime was particularly significant for crimes with no information on the victims, driven by firearm-specific crimes such as discharging a firearm. Therefore, an approach that counts only victims may underestimate the increase in firearm-related violent crime. For example, since the low in 2013, the rate of victims of firearm-related violent crime has risen 43%, whereas the increase is 55% when both the victims and crimes with no victim information (hybrid approach) are counted. Counting incidents alone, regardless of the number of victims, also poses some problems. Crimes involving firearms are more likely to result in several victims; counting only incidents would therefore underestimate the incidence of gun violence compared with other types of crime. It is for this reason that this study adopts a hybrid approach, where each crime and each victim is counted. Thus, each victim record is considered a “criminal incident,” as is each incident record with no victim information; it is in this sense that the term “incident” or “crime” is used in this article.
It should be noted that the most recent Juristat articles about firearm-related violent crime were based on the number of victims rather than on the number of incidents. The trends noted in this article could therefore slightly differ from what had been published in these articles.
End of text box 1
Start of text box 2
Text box 2
Reporting firearm-related violent crime to the police
In Canada, the official statistics on crime and criminal victimization mainly come from two types of data sources: data reported by the police (e.g., Incident-Based Uniform Crime Reporting Survey, Homicide Survey) and data from self-reported victimization surveys (e.g., General Social Survey [GSS] on Canadians’ Safety [Victimization], Survey of Safety in Public and Private Spaces).
The data presented in this article are based on police-reported data. Thus, they are limited to crimes known to the police. However, only a portion of crimes actually come to the attention of the police. According to data from the 2019 GSS on Canadians’ Safety, just under one-quarter (24%) of violent crimes were reported to the police. This proportion was two times higher when victims were men (36%) than when victims were women (18%), a difference largely attributable to the small proportion of sexual assaults that are reported to the police (Cotter, 2021).
The sample size, combined with the relatively low frequency of firearm-related crime, does not allow for the calculation of the reporting rate for firearm-related crime to the police. However, data from the GSS indicate that violent crime in which a weapon—a firearm, knife, stick or bat, or another weapon—was present was reported in more than half (51%) of the cases.
Firearm-related crime represented 2.2% of violent crimes reported through the 2019 GSS. This proportion is slightly lower than the proportion among police-reported crimes in 2022 (2.8%). This may reflect the fact that firearm-related crime is more likely to be reported to the police than crimes where no weapon was present.
End of text box 2
First increase in five years in robberies involving firearms
Since 2013, most offences have seen a significant increase in the rate of firearm-related incidents. However, robberies, which represented just over one-quarter of firearm-related violent crime in 2022, showed a very different trend. From 2013 to 2017, the rate fluctuated slightly upward, then began a decline that was accentuated by the COVID-19 pandemic (for more details on impacts of the COVID-19 pandemic on crime, see Moreau 2022). However, in 2022, the rate of robberies involving firearms started to rise again, increasing 24% from 2021 (Chart 3). It is possible that the increase in the rate of robberies involving firearms reflects a certain return to normal activities after the drop recorded during the first years of the COVID-19 pandemic. That said, from 2021 to 2022, the increase in firearm-related robberies (+24%) was larger than the increase in robberies not involving firearms (+14%).
Chart 3 start

Data table for Chart 3
| Year | Homicides and other violations causing death, attempted murder | Robbery | Sexual assaults | Assaults | Firearm-specific violent offences (pointing, discharging, using) | Threats, extortion and intimidation | Other violent crimes |
|---|---|---|---|---|---|---|---|
| rate per 100,000 population | |||||||
| 2009 | 1.73 | 15.48 | 0.25 | 6.90 | 5.23 | 2.68 | 1.62 |
| 2010 | 1.40 | 12.63 | 0.18 | 5.90 | 5.60 | 2.53 | 1.11 |
| 2011 | 1.27 | 12.45 | 0.15 | 5.92 | 5.50 | 2.18 | 0.95 |
| 2012 | 1.48 | 11.11 | 0.18 | 5.53 | 5.93 | 2.13 | 0.86 |
| 2013 | 1.22 | 9.33 | 0.20 | 4.78 | 5.56 | 1.92 | 0.73 |
| 2014 | 1.25 | 10.12 | 0.14 | 4.88 | 5.37 | 2.42 | 0.83 |
| 2015 | 1.58 | 11.78 | 0.23 | 5.06 | 6.57 | 2.46 | 0.90 |
| 2016 | 1.65 | 11.01 | 0.16 | 5.57 | 7.07 | 2.59 | 0.75 |
| 2017 | 1.77 | 11.81 | 0.22 | 5.51 | 7.64 | 2.73 | 0.87 |
| 2018 | 1.79 | 11.51 | 0.30 | 5.39 | 7.46 | 2.95 | 0.81 |
| 2019 | 1.90 | 10.92 | 0.25 | 5.93 | 9.42 | 3.24 | 0.79 |
| 2020 | 2.05 | 9.17 | 0.27 | 7.12 | 10.94 | 3.61 | 0.90 |
| 2021 | 1.89 | 7.94 | 0.39 | 7.33 | 11.63 | 3.52 | 1.03 |
| 2022 | 2.00 | 9.84 | 0.32 | 7.65 | 12.23 | 3.71 | 0.97 |
|
Note: Firearm-related violent crimes include incidents where the most serious violation is a firearm-specific violent offence (pointing a firearm, discharging a firearm with intent, use of a firearm in the commission of an offence) and other violent crimes where the most serious weapon present in the incident was a firearm. The number of incidents represents the number of victims, in addition to incidents for which the police did not provide victim records. Rates are calculated on the basis of 100,000 population. Populations are based upon July 1 estimates from Statistics Canada, Centre for Demography. Source: Statistics Canada, Canadian Centre for Justice and Community Safety Statistics, Uniform Crime Reporting Survey (Trend Database). |
|||||||
Chart 3 end
Increases in the rate of crime involving weapons were also noted for most of the other offences. From 2021 to 2022, the rate of firearm-related homicide, other violent crimes causing death, and attempted murder and was up 5.8% overall. The rate of threats, extortion and intimidation rose 5.3%, while the firearm-specific crime rate increased 5.2% (Table 2). In contrast, the rate of sexual assault involving a firearm fell 18%. However, the 2021 rate of police-reported sexual assault involving a firearm was the highest on record since 2009.
As an offence category, firearm-specific crime increased the most in recent years
Among violent crime involving firearms, firearm-specific crime is the category that has increased the most in recent years. Since the low in firearm crime in 2013, the rate of these crimes has more than doubled (+120%) (Chart 3). Firearm-specific crimes involving a handgun increased the most. Their number has more than tripled since 2013, and more than quadrupled since 2009. The number of firearm-specific offences involving other types of firearms has doubled since 2009.
In comparison, the rate of threats, extortion or intimidation involving firearms climbed 93% during the same period. The rate of firearm-related homicides, other violent crimes causing death, and attempted murder, as well as the rate of sexual assault involving a firearm, has risen 64% since 2013 (Chart 3).
The rate of firearm discharge offences is almost 10 times higher than in 2002
Over a 20-year period,Note the rate of incidents of discharging a firearm with intent has shown a strong upward trend. In 2022, the rate for these offences was almost 10 times higher than it was in 2002 (5.5 per 100,000 population in 2022 compared with 0.6 in 2002) (Chart 4).
Chart 4 start

Data table for Chart 4
| Year | Discharging a firearm with intent | Use of a firearm in the commission of an offence | Pointing a firearm |
|---|---|---|---|
| rate per 100,000 population | |||
| 2002 | 0.57 | 0.76 | 5.55 |
| 2003 | 0.69 | 1.02 | 5.56 |
| 2004 | 0.71 | 1.24 | 4.96 |
| 2005 | 0.81 | 1.09 | 4.27 |
| 2006 | 0.77 | 1.16 | 2.76 |
| 2007 | 0.94 | 1.51 | 2.54 |
| 2008 | 1.26 | 1.02 | 2.17 |
| 2009 | 1.58 | 1.16 | 2.42 |
| 2010 | 1.82 | 1.22 | 2.89 |
| 2011 | 1.66 | 1.22 | 2.78 |
| 2012 | 1.85 | 1.24 | 2.83 |
| 2013 | 1.58 | 1.13 | 2.68 |
| 2014 | 1.92 | 1.11 | 2.23 |
| 2015 | 2.58 | 1.17 | 2.86 |
| 2016 | 3.07 | 1.22 | 2.74 |
| 2017 | 3.16 | 1.42 | 2.99 |
| 2018 | 3.11 | 1.34 | 3.28 |
| 2019 | 4.02 | 1.57 | 3.84 |
| 2020 | 4.93 | 1.64 | 4.45 |
| 2021 | 5.38 | 1.77 | 4.52 |
| 2022 | 5.45 | 1.86 | 4.87 |
|
Note: Data are based on the most serious violation in the incident. Rates are calculated on the basis of 100,000 population. Populations are based upon July 1 estimates from Statistics Canada, Centre for Demography. Source: Statistics Canada, Canadian Centre for Justice and Community Safety Statistics, Uniform Crime Reporting Survey. |
|||
Chart 4 end
The increase in firearm discharge incidents is largely responsible for the increase in the rate for all firearm-specific violent offences. The rate of incidents related to using a firearm during the commission of an offence also increased significantly (+145%) during this period, but to a lesser extent than firearm discharge incidents (+861 %). Conversely, the rate of incidents related to pointing a firearm (4.9 incidents per 100,000 population) was lower in 2022 than in 2002 (5.6). However, the rate for these incidents declined rapidly until 2008, then fluctuated until it resumed an upward trend starting in 2014 (Chart 4).
Start of text box 3
Text box 3
Gun control in Canada
According to the Criminal Code, firearms are classified into three categories: prohibited firearms, restricted firearms and non-restricted firearms. Prohibited firearms include fully automatic firearms, sawed-off rifles and shotguns, and any other firearm prescribed as prohibited under the regulations, such as certain types of handguns. Handguns not falling into the prohibited category are classified as restricted weapons, while rifles and shotguns, also called long guns, are usually included in the non-restricted firearms category.
Canadian law requires anyone who wants to own a firearm or purchase ammunition to hold a valid firearms licence under the Firearms Act (1995). Over the years, various amendments were made to the Criminal Code and the Firearms Act. In 2012, Bill C-19 (An Act to amend the Criminal Code and the Firearms Act) abolished the requirement to register non-restricted firearms. Subsequent amendments simplified the firearms licensing regime for individuals, limited the discretionary authority of chief firearms officers, and permitted information-sharing about commercial importations of firearm (Bill C-42; 2015) and imposed certain conditions with respect to the transfer of non-restricted firearms, removed some automatic authorizations to transport prohibited and restricted firearms, and grandfathered certain individuals and firearms previously prescribed as restricted or non-restricted (Bill C-71; 2019).
More recently, through Orders in Council, the government amended the classification of some firearms, strengthening licence verification for the transfer of non-restricted firearms and restricting the transfer and carrying of handguns (also called the “handgun freeze”). Further measures are proposed in Bill C-21, An Act to amend certain Acts and to make certain consequential amendments (firearms). This bill, which was passed by the House of Commons and was being reviewed by the Senate at the time of this article's writing, would establish new circumstances under which a prohibition order or a search or seizure warrant can be issued, or a licence suspended. It would also create new offences (e.g., altering a magazine) and increase the maximum penalties for certain firearm offences. If made law, Bill C-21 would terminate, with some exceptions, the issuing of registration certificates for handguns to individuals; without a registration certificate, an individual cannot legally own a handgun.
End of text box 3
Ontario sees the largest increase in firearm-related violent crime between 2021 and 2022
Among the provinces and territories, the rate of violent crime involving firearms increased the most in Ontario compared with 2021. It rose from 25.8 to 32.1 incidents per 100,000 population, a 24% increase. In 2022, 3.3% of police-reported violent crime in Ontario involved firearms. New Brunswick had the second-largest increase, with the rate rising from 32.8 to 40.6 incidents per 100,000 population (Table 1).
However, the Northwest Territories (230.2 incidents per 100,000 population) recorded the highest rate of firearm-related violent crime. The high rate of firearm-related violent crime in the Northwest Territories is the result of the high number of violent crimes in this territory in general. In fact, its proportion of firearm-related violent crime (1.9%) was lower than that recorded across the country (2.8%). Moreover, the situation is similar in the other two territories, where the rate of violent crime involving firearms was relatively high despite having a relatively low proportion (1.5%) of violent crimes there that involved firearms (Table 1).
Despite relatively notable decreases, Nunavut (182.6) and Saskatchewan (109.6) were also among the provinces and territories with the highest rates of firearm-related violent crime. Prince Edward Island (10.0) and Newfoundland and Labrador (22.8) recorded the lowest rates.
Since 2009, the trend in gun violence has varied across the provinces and territories. In the Atlantic provinces in particular, each province posted a very different trend. Newfoundland and Labrador saw an increase in firearm-related violent crime between 2009 and 2015. Since then, the rate has been relatively stable. In Prince Edward Island, despite some significant annual fluctuations inherent to the small size of the population, the rate has remained relatively stable around an annual average of 12.8 firearm-related violent crimes. In the other two Atlantic provinces, the rate of firearm-related violent crime reached a low in 2014 in New Brunswick and in 2016 in Nova Scotia, before resuming an upward trend. In Nova Scotia, however, the rate has dropped since 2020, when the province saw the deadliest shooting in the country’s history (22 killed in the Portapique area) (Chart 5).
Chart 5 start

Data table for Chart 5
| Year | Newfoundland and Labrador | Prince Edward Island | Nova Scotia | New BrunswickData table for Chart 5 Note 1 |
|---|---|---|---|---|
| rate per 100,000 population | ||||
| 2009 | 15.7 | 17.9 | 35.0 | 20.0 |
| 2010 | 16.9 | 7.8 | 26.2 | 19.8 |
| 2011 | 14.9 | 16.0 | 33.6 | 22.3 |
| 2012 | 21.8 | 13.1 | 33.5 | 27.5 |
| 2013 | 19.0 | 5.6 | 24.1 | 18.0 |
| 2014 | 18.0 | 11.1 | 25.2 | 16.8 |
| 2015 | 25.4 | 15.9 | 19.3 | 17.7 |
| 2016 | 24.2 | 12.2 | 17.4 | 26.8 |
| 2017 | 21.6 | 17.3 | 24.5 | 26.4 |
| 2018 | 24.7 | 16.3 | 21.1 | 27.1 |
| 2019 | 22.2 | 12.1 | 23.4 | 32.6 |
| 2020 | 20.7 | 15.5 | 31.6 | 33.4 |
| 2021 | 25.0 | 9.1 | 29.6 | 32.8 |
| 2022 | 22.8 | 10.0 | 28.7 | 40.6 |
Source: Statistics Canada, Canadian Centre for Justice and Community Safety Statistics, Uniform Crime Reporting Survey (Trend Database). |
||||
Chart 5 end
In Quebec,Note the rate of firearm-related violent crime decreased from 2011 to 2016, then remained stable through 2019. Since then, an upward trend has seemed to emerge, despite a very slight decline from 2021 to 2022. In Ontario, the rate decreased sharply from 2009 to 2013, before beginning an upward trend. In 2021, the rate decreased from the previous year for the first time since 2013. However, this was followed by the largest year-to-year increase to date, with a 24% increase from 2021 to 2022. In British Columbia, the trend was relatively similar to that of Quebec: the rate fell to a low in 2018 before resuming an upward trend (Chart 6).
Chart 6 start

Data table for Chart 6
| Year | QuebecData table for Chart 6 Note 1 | Ontario | British Columbia |
|---|---|---|---|
| rate per 100,000 population | |||
| 2009 | 31.9 | 32.7 | 33.9 |
| 2010 | 32.9 | 23.1 | 30.6 |
| 2011 | 34.7 | 21.4 | 25.5 |
| 2012 | 28.0 | 21.0 | 29.3 |
| 2013 | 24.7 | 18.2 | 24.0 |
| 2014 | 24.1 | 20.2 | 23.9 |
| 2015 | 23.0 | 22.2 | 29.5 |
| 2016 | 19.7 | 25.5 | 23.6 |
| 2017 | 20.5 | 28.1 | 22.5 |
| 2018 | 20.6 | 28.7 | 19.6 |
| 2019 | 19.5 | 29.1 | 25.8 |
| 2020 | 22.2 | 29.4 | 26.8 |
| 2021 | 25.1 | 25.8 | 24.9 |
| 2022 | 24.8 | 32.1 | 28.0 |
Source: Statistics Canada, Canadian Centre for Justice and Community Safety Statistics, Uniform Crime Reporting Survey (Trend Database). |
|||
Chart 6 end
In each of the Prairie provinces, the rate fell to a low around 2013 or 2014 before beginning an upward trend. However, the extent of this increase was not the same everywhere. For example, Alberta (+71%) had a relatively significant increase since the low in 2013, but this increase was much smaller than in Saskatchewan, where the rate rose by 165% over the same period. In Manitoba, the rate of firearm-related violent crime has also seen a significant increase (+103%) since falling to a low in 2014 (Chart 7).
Chart 7 start

Data table for Chart 7
| Year | Manitoba | Saskatchewan | Alberta |
|---|---|---|---|
| rate per 100,000 population | |||
| 2009 | 49.9 | 42.3 | 38.7 |
| 2010 | 45.1 | 44.8 | 36.7 |
| 2011 | 43.3 | 44.2 | 35.0 |
| 2012 | 38.2 | 46.0 | 33.2 |
| 2013 | 38.2 | 41.4 | 31.9 |
| 2014 | 34.7 | 48.8 | 35.6 |
| 2015 | 43.8 | 61.1 | 47.9 |
| 2016 | 55.7 | 74.9 | 44.0 |
| 2017 | 56.2 | 93.9 | 42.7 |
| 2018 | 60.1 | 83.0 | 43.0 |
| 2019 | 69.7 | 99.8 | 46.3 |
| 2020 | 60.2 | 106.2 | 51.8 |
| 2021 | 70.4 | 117.9 | 51.5 |
| 2022 | 70.5 | 109.6 | 54.5 |
|
Note: Firearm-related violent crimes include incidents where the most serious violation is a firearm-specific violent offence (pointing a firearm, discharging a firearm with intent, use of a firearm in the commission of an offence) and other violent crimes where the most serious weapon present in the incident was a firearm. The number of incidents represents the number of victims, in addition to incidents for which the police did not provide victim records. Rates are calculated on the basis of 100,000 population. Populations are based upon July 1 estimates from Statistics Canada, Centre for Demography. Source: Statistics Canada, Canadian Centre for Justice and Community Safety Statistics, Uniform Crime Reporting Survey (Trend Database). |
|||
Chart 7 end
In the territories, given the low number of firearm-related violent crimes and the small population size, significant annual fluctuations are observed. Nevertheless, each of the territories recorded a low sometime in the mid-2010s before an overall upward trend began. This increase was particularly strong in the Northwest Territories, where the rate has more than quintupled since the low in 2014 (Chart 8).
Chart 8 start

Data table for Chart 8
| Year | Yukon | Northwest Territories | Nunavut |
|---|---|---|---|
| rate per 100,000 population | |||
| 2009 | 38.5 | 44.0 | 162.6 |
| 2010 | 80.9 | 64.7 | 140.9 |
| 2011 | 39.5 | 87.3 | 163.8 |
| 2012 | 38.6 | 77.9 | 201.9 |
| 2013 | 30.1 | 57.1 | 121.7 |
| 2014 | 75.4 | 43.3 | 155.7 |
| 2015 | 69.0 | 76.9 | 172.7 |
| 2016 | 67.5 | 98.5 | 121.7 |
| 2017 | 55.5 | 75.7 | 197.1 |
| 2018 | 54.3 | 113.4 | 201.9 |
| 2019 | 84.6 | 159.8 | 207.3 |
| 2020 | 113.7 | 176.4 | 158.3 |
| 2021 | 71.8 | 212.7 | 236.7 |
| 2022 | 75.1 | 230.2 | 182.6 |
|
Note: Firearm-related violent crimes include incidents where the most serious violation is a firearm-specific violent offence (pointing a firearm, discharging a firearm with intent, use of a firearm in the commission of an offence) and other violent crimes where the most serious weapon present in the incident was a firearm. The number of incidents represents the number of victims, in addition to incidents for which the police did not provide victim records. Rates are calculated on the basis of 100,000 population. Populations are based upon July 1 estimates from Statistics Canada, Centre for Demography. Source: Statistics Canada, Canadian Centre for Justice and Community Safety Statistics, Uniform Crime Reporting Survey (Trend Database). |
|||
Chart 8 end
Sharp increase in the rate of firearm-related violent crime in Toronto and Vancouver, rate in Montréal relatively stable after two years of increase
After declining over the previous two years, the rate of firearm-related violent crime significantly increased in two of the three largest census metropolitan areas (CMAs)Note in Canada, namely Toronto and Vancouver. In Toronto,Note − which in 2022 accounted for slightly more than half of firearm-related violent crime in Ontario, and 18% in Canada − police reported 2,576 incidents of firearm-related violent crime in 2022, 725 more than the preceding year. The rate of firearm-related violent crimes rose from 31.7 incidents per 100,000 population in 2021 to 43.2 in 2022 (+36%). Firearm-related violent crime reached its highest rate in over 10 years in 2022, thereby concluding 3 consecutive years of declines (Chart 9).
Chart 9 start

Data table for Chart 9
| Year | MontréalData table for Chart 9 Note 1 | TorontoData table for Chart 9 Note 2 | Vancouver |
|---|---|---|---|
| rate per 100,000 population | |||
| 2009 | 40.7 | 46.4 | 39.2 |
| 2010 | 42.4 | 28.2 | 36.9 |
| 2011 | 46.8 | 26.7 | 28.3 |
| 2012 | 35.0 | 25.8 | 34.8 |
| 2013 | 29.7 | 22.4 | 26.9 |
| 2014 | 28.4 | 29.1 | 26.5 |
| 2015 | 28.1 | 32.6 | 32.6 |
| 2016 | 21.8 | 38.2 | 24.5 |
| 2017 | 21.3 | 41.5 | 20.2 |
| 2018 | 21.7 | 41.8 | 19.7 |
| 2019 | 19.9 | 41.7 | 24.1 |
| 2020 | 24.8 | 39.1 | 21.6 |
| 2021 | 27.9 | 31.7 | 19.1 |
| 2022 | 28.0 | 43.2 | 23.6 |
Source: Statistics Canada, Canadian Centre for Justice and Community Safety Statistics, Uniform Crime Reporting Survey (Trend Database). |
|||
Chart 9 end
In Vancouver, the rate of firearm-related violent crime in 2022 (23.6 incidents per 100,000) increased by 24% from 2021. However, the rate in 2021 (19.1) was the lowest recorded since 2009 and followed a generally downward trend. Despite this increase, the rate of firearm-related violent crime in Vancouver remained lower than that of Toronto and Montréal.
Firearm-related violent crime in Montréal, Canada’s second largest CMA, followed a relatively similar trend to Vancouver, generally decreasing during the 2010s. From 2019, the rate of firearm-related violent crime started an upward trend that was reinforced in 2022, with the rate increasing slightly (+0.4%) compared with 2021 (28.0 incidents per 100,000 population compared with 27.9).
Regina has the highest rate of firearm-related violent crime among the CMAs
In 2022, Regina was the CMA that had by far the highest rate of firearm-related violent crime (83.0 incidents per 100,000 population), with 7.0% of violent crime in this CMA involving firearms. Despite a slight drop from 2021 (-4.9%), the rate of firearm-related violent crime in Regina almost quadrupled in 10 years, from a rate of 22.4 in 2012. Only the Greater Sudbury (+298%) and Thunder Bay (+287%) CMAs had larger increases in the rate of firearm-related violent crime during this period (Table 3, Chart 10).
Chart 10 start
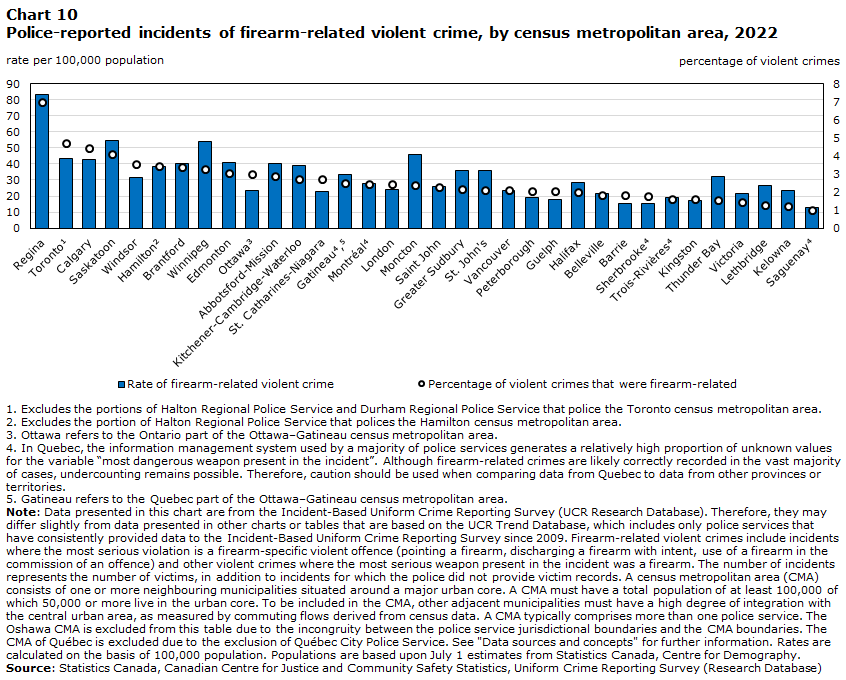
Data table for Chart 10
| Census metropolitan area | rate per 100,000 population | percentage of violent crimes |
|---|---|---|
| Regina | 83.0 | 7.0 |
| TorontoData table for Chart 10 Note 1 | 43.2 | 4.7 |
| Calgary | 43.0 | 4.4 |
| Saskatoon | 54.3 | 4.1 |
| Windsor | 31.6 | 3.5 |
| HamiltonData table for Chart 10 Note 2 | 38.5 | 3.4 |
| Brantford | 40.0 | 3.4 |
| Winnipeg | 54.2 | 3.3 |
| Edmonton | 40.8 | 3.1 |
| OttawaData table for Chart 10 Note 3 | 23.2 | 3.0 |
| Abbotsford-Mission | 40.5 | 2.9 |
| Kitchener-Cambridge-Waterloo | 39.3 | 2.7 |
| St. Catharines-Niagara | 22.6 | 2.7 |
| GatineauData table for Chart 10 Note 4 Data table for Chart 10 Note 5 | 33.1 | 2.5 |
| MontréalData table for Chart 10 Note 4 | 28.0 | 2.4 |
| London | 24.3 | 2.4 |
| Moncton | 45.6 | 2.4 |
| Saint John | 25.9 | 2.3 |
| Greater Sudbury | 36.2 | 2.1 |
| St. John's | 35.6 | 2.1 |
| Vancouver | 23.6 | 2.1 |
| Peterborough | 19.1 | 2.0 |
| Guelph | 18.0 | 2.0 |
| Halifax | 28.5 | 2.0 |
| Belleville | 21.4 | 1.8 |
| Barrie | 15.5 | 1.8 |
| SherbrookeData table for Chart 10 Note 4 | 15.5 | 1.8 |
| Trois-RivièresData table for Chart 10 Note 4 | 19.4 | 1.6 |
| Kingston | 17.4 | 1.6 |
| Thunder Bay | 32.1 | 1.6 |
| Victoria | 21.5 | 1.4 |
| Lethbridge | 26.6 | 1.3 |
| Kelowna | 23.5 | 1.3 |
| SaguenayData table for Chart 10 Note 4 | 12.8 | 1.0 |
Source: Statistics Canada, Canadian Centre for Justice and Community Safety Statistics, Uniform Crime Reporting Survey (Research Database) |
||
Chart 10 end
Saskatoon (54.3 incidents per 100,000 population) recorded the second-highest rate of firearm-related violent crime among the CMAs in Canada, followed closely by Winnipeg (54.2). However, the Toronto CMA recorded the second-highest proportion of firearm-related violent crime: 4.7% of violent crime there involved firearms.
Compared with 2012, the most significant increases in the rate of firearm-related violent crime were recorded in Greater Sudbury (+298%), Thunder Bay (+287%) and Regina (+270%). That said, almost all CMAs saw a higher rate of firearm-related violent crime in 2022 than what was recorded 10 years earlier. Only the Halifax (-41%), Vancouver (-32%), Montréal (-20%) and Barrie (-1.1%) CMAs posted lower rates of firearm-related violent crime in 2022 than in 2012 (Table 3).
The rates of firearm-related violent crime are higher in northern rural areas, particularly in the northern Prairies
Firearm crime does not affect only metropolitan areas. Rural areas are also affected, and even more so. For all CMAs combined, the rate of firearm-related violent crime was 33.5 incidents per 100,000 population in 2022. When small or medium-sized cities (census agglomerations) were added, this rate increased slightly (33.8) (Table 3).
In rural areas of the provinces, the rate of firearm-related violent crime (50.2) in 2022 was almost 50% higher than in urban areas (33.8).Note This difference is mainly attributable to northern rural areas,Note where the rate is 148.9 incidents per 100,000 population. Several studies noted that crime rates are relatively high in the northern rural areas, and that the gap between them and areas in the south has increased in recent years (Allen & Perreault, 2015; Perreault, 2023; Perreault, 2019). The high rate of firearm-related violent crime in northern rural areas primarily stems from the relatively high overall crime rate, although the proportion of violent crime involving firearms (3.3%) is also higher than in southern (2.9%) and northern (1.8%) urban areas (Table 1).
The rate of firearm-related violent crime in 2022 was particularly high in the northern rural areas of the Prairie provinces. In northern Saskatchewan, police reported 309 violent crimes involving firearms for a total population of about 40,000. This is equivalent to a rate of 766.3 incidents per 100,000 population. However, this rate, which is higher than elsewhere in Saskatchewan, mostly reflects the fact that crime in general is relatively high in the province’s northern areas, with 4.4% of violent crime involving firearms, compared with 4.8% in southern urban areas (Table 1).
In other regions in the Prairies, the rate stood at 318.5 firearm-related violent crimes per 100,000 population in rural areas of northern Manitoba and 194.4 in rural areas of northern Alberta. The proportion of violent crime involving firearms was especially high in rural areas of northern Alberta, where 5.5% of violent crimes involved a firearm in 2022.
Chart 11 start

Data table for Chart 11
| Year | Provincial urban South | Provincial urban North | Provincial rural South | Provincial rural North | Territories |
|---|---|---|---|---|---|
| rate per 100,000 population | |||||
| 2009 | 34.7 | 25.9 | 24.4 | 65.9 | 77.6 |
| 2010 | 29.1 | 21.1 | 24.5 | 65.7 | 92.6 |
| 2011 | 28.1 | 23.7 | 23.6 | 62.5 | 95.5 |
| 2012 | 26.0 | 25.4 | 25.4 | 67.6 | 103.0 |
| 2013 | 23.0 | 21.7 | 20.4 | 61.7 | 68.3 |
| 2014 | 24.1 | 24.9 | 22.0 | 63.7 | 88.0 |
| 2015 | 27.4 | 32.1 | 24.6 | 74.8 | 103.9 |
| 2016 | 27.6 | 23.5 | 24.7 | 89.9 | 95.7 |
| 2017 | 29.1 | 29.2 | 27.3 | 90.6 | 106.5 |
| 2018 | 29.0 | 33.7 | 24.9 | 84.2 | 121.3 |
| 2019 | 30.7 | 33.4 | 29.5 | 94.9 | 149.6 |
| 2020 | 30.6 | 39.8 | 36.7 | 116.0 | 149.9 |
| 2021 | 29.5 | 41.3 | 35.9 | 139.8 | 172.8 |
| 2022 | 33.5 | 41.1 | 33.5 | 148.9 | 163.0 |
|
Note: Rural police services are those where the majority of the population lives outside of a census metropolitan area (CMA) or census agglomeration (CA). Urban police services are those where the majority of the population lives within a CMA or CA. See "Data sources and concepts" for further information. Provincial North encompasses the northern regions of Newfoundland and Labrador, Ontario, Manitoba, Saskatchewan, Alberta and British Columbia (North and South ― Variant of Standard Geographical Classification 2021). Firearm-related violent crimes include incidents where the most serious violation is a firearm-specific violent offence (pointing a firearm, discharging a firearm with intent, use of a firearm in the commission of an offence) and other violent crimes where the most serious weapon present in the incident was a firearm. The number of incidents represents the number of victims, in addition to incidents for which the police did not provide victim records. Rates are calculated on the basis of 100,000 population. Populations are based upon July 1 estimates from Statistics Canada, Centre for Demography. Source: Statistics Canada, Canadian Centre for Justice and Community Safety Statistics, Uniform Crime Reporting Survey (Trend Database). |
|||||
Chart 11 end
Although southern urban areas have seen a certain upsurge in violent crime involving firearms overall since the low in 2013, the rate recorded in 2022 remained slightly lower than it was in 2009. The situation is quite different in rural areas and northern regions. Since 2009, the rate of firearm-related violent crime more than doubled in rural areas of the Provincial North (from 65.9 to 148.9 incidents per 100,000 population) and in the territories (from 77.6 to 163.0 incidents per 100,000 population). In northern urban areas (+59%) and rural areas in the south (+37%), the rate of firearm-related violent crime in 2022 was also higher than in 2009 (Chart 11).
Handguns involved in over half of firearm-related violent crimes
In 2022, more than half (53%) of firearm-related violent crime involved a handgun. In comparison, 15% of firearm-related violent crime involved a rifle or shotgun, 4.8% involved a fully automatic or sawed-off firearm, and 27% involved a firearm-like weapon (e.g., airgun, imitation firearm) or an unknown firearm.Note
The relatively large proportion of handgun crime across the country was mainly due to the fact that these weapons are most common in incidents in southern urban areas, and more particularly in big cities, where most of the population lives and where the majority of firearm-related violent crime is recorded. In southern urban areas, 62% of firearm-related violent crime involved a handgun. In Toronto, the largest CMA in Canada, this proportion was 83% (Chart 12).
Chart 12 start

Data table for Chart 12
| Census metropolitan areas, and southern and northern urban and rural areas | Handgun | Rifle or shotgun | Fully-automatic or sawed-off firearm | Firearm-like weapon or type of firearm unknownData table for Chart 12 Note 4 |
|---|---|---|---|---|
| percent | ||||
| Halifax | 56.2 | 15.3 | 4.4 | 24.1 |
| Montréal | 63.6 | 3.2 | 4.8 | 28.4 |
| OttawaData table for Chart 12 Note 1 | 70.5 | 4.2 | 1.5 | 23.9 |
| TorontoData table for Chart 12 Note 2 | 82.6 | 2.3 | 0.5 | 14.6 |
| HamiltonData table for Chart 12 Note 3 | 70.0 | 2.6 | 3.0 | 24.3 |
| Kitchener-Cambridge-Waterloo | 57.4 | 3.2 | 3.2 | 36.1 |
| London | 65.7 | 5.7 | 2.1 | 26.4 |
| Winnipeg | 58.7 | 11.9 | 6.7 | 22.7 |
| Regina | 24.7 | 23.3 | 17.9 | 34.1 |
| Saskatoon | 41.1 | 13.7 | 23.7 | 21.6 |
| Calgary | 59.0 | 9.5 | 3.0 | 28.5 |
| Edmonton | 50.2 | 18.4 | 8.1 | 23.3 |
| Vancouver | 65.8 | 6.5 | 3.9 | 23.8 |
| Urban South | 62.4 | 9.1 | 4.3 | 24.2 |
| Urban North | 43.1 | 21.9 | 7.0 | 28.0 |
| Rural South | 25.5 | 33.0 | 5.9 | 35.6 |
| Rural North | 15.6 | 37.5 | 6.6 | 40.2 |
| Territories | 32.1 | 39.2 | 0.5 | 28.3 |
| Canada | 52.6 | 15.4 | 4.8 | 27.2 |
Source: Statistics Canada, Canadian Centre for Justice and Community Safety Statistics, Uniform Crime Reporting Survey (Trend Database). |
||||
Chart 12 end
The proportion of firearm-related violent crimes involving handguns was much lower in some CMAs with the highest rates of gun violence. In Regina, the CMA with the highest rate of firearm-related violent crime in the country, a quarter (25%) of these crimes were committed with a handgun in 2022. In Saskatoon, this proportion was 41%.
However, handguns accounted for the lowest proportion of firearm-related violent crime in rural areas. More specifically, a quarter (25%) of firearm-related violent crime in southern rural areas involved handguns. In northern rural areas, this proportion was 16%.
Increases in firearm-related violent crime seen with all types of firearms
Handguns are often at the forefront of discussions and debates on gun control, as evidenced by the recent “freeze on the handgun market” (see Text box 3). While the rate of violent crime involving handguns has increased by 50% since the low in 2013 (from 12.8 to 19.3 incidents per 100,000 population), the trend is relatively similar for all types of firearms. For example, the rate of violent crime involving a fully automatic firearm or a sawed-off rifle or shotgun—prohibited weapons—was up 35% during the same period. Crimes involving a rifle or shotgun rose 45% (Table 4, Chart 13).
Chart 13 start

Data table for Chart 13
| Year | Handgun | Rifle or shotgun | Fully-automatic or sawed-off firearm | Firearm-like weapon or type of firearm unknownData table for Chart 13 Note 1 |
|---|---|---|---|---|
| rate per 100,000 population | ||||
| 2009 | 19.5 | 4.7 | 2.5 | 7.3 |
| 2010 | 15.4 | 5.0 | 2.0 | 6.9 |
| 2011 | 15.4 | 4.4 | 1.6 | 7.0 |
| 2012 | 14.5 | 4.3 | 1.5 | 6.9 |
| 2013 | 12.8 | 3.9 | 1.3 | 5.7 |
| 2014 | 14.0 | 4.0 | 1.1 | 5.9 |
| 2015 | 16.1 | 4.8 | 1.6 | 6.1 |
| 2016 | 16.1 | 5.1 | 1.3 | 6.3 |
| 2017 | 16.8 | 5.5 | 2.0 | 6.2 |
| 2018 | 17.3 | 5.2 | 1.8 | 5.9 |
| 2019 | 18.4 | 5.7 | 1.8 | 6.6 |
| 2020 | 17.7 | 6.1 | 1.7 | 8.5 |
| 2021 | 17.4 | 5.9 | 1.7 | 8.7 |
| 2022 | 19.3 | 5.7 | 1.7 | 10.0 |
Source: Statistics Canada, Canadian Centre for Justice and Community Safety Statistics, Uniform Crime Reporting Survey (Trend Database). |
||||
Chart 13 end
However, the biggest increase was observed in the firearm-like or unknown weapon category. The rate for these crimes rose from 5.7 incidents per 100,000 population in 2013 to 10.0 incidents per 100,000 population in 2022, an increase of 76%. In 2022, these crimes represented 27% of all firearm-related violent crimes, compared to 21% in 2009 (Chart 14). This relatively large increase may be due in part to a higher number of incidents of discharging a firearm with intent; the proportion of these crimes for which the type of firearm was unknown was relatively high. But crime involving firearm-like weapons may also be on the rise, as various sources seem to indicate (Canada Border Services Agency, 2023, June 21; Mauro & Mancini, 2023, January 10; Royal Canadian Mounted Police, 2023, September 19). Bill C-21 plans to better define and regulate firearm-like weapons, such as airsoft guns, BB guns, pellet guns, airguns or replica firearms.
Chart 14 start

Data table for Chart 14
| Year | Handgun | Fully-automatic or sawed-off firearm | Rifle or shotgun | Firearm-like weapon or type of firearm unknownData table for Chart 14 Note 1 |
|---|---|---|---|---|
| percent | ||||
| 2009 | 57.5 | 7.3 | 13.8 | 21.5 |
| 2010 | 52.6 | 6.7 | 17.1 | 23.6 |
| 2011 | 54.2 | 5.7 | 15.5 | 24.6 |
| 2012 | 53.3 | 5.6 | 15.7 | 25.5 |
| 2013 | 54.1 | 5.5 | 16.4 | 24.0 |
| 2014 | 56.0 | 4.5 | 15.9 | 23.5 |
| 2015 | 56.4 | 5.5 | 16.9 | 21.3 |
| 2016 | 55.9 | 4.6 | 17.8 | 21.7 |
| 2017 | 55.0 | 6.6 | 18.1 | 20.3 |
| 2018 | 57.3 | 5.9 | 17.3 | 19.5 |
| 2019 | 56.7 | 5.5 | 17.4 | 20.4 |
| 2020 | 51.9 | 5.1 | 18.0 | 24.9 |
| 2021 | 51.7 | 5.1 | 17.4 | 25.8 |
| 2022 | 52.6 | 4.8 | 15.4 | 27.2 |
Source: Statistics Canada, Canadian Centre for Justice and Community Safety Statistics, Uniform Crime Reporting Survey (Trend Database). |
||||
Chart 14 end
Compared with 2009, the proportion firearm-related violent crime involving handguns decreased slightly in urban areas, but increased in rural areas
Handguns are more often linked to gun violence in urban areas. As previously indicated, almost two-thirds (62%) of firearm-related violent crime in southern urban areas involved a handgun in 2022, approximately four times higher than in northern rural areas. Conversely, firearm-related violent crime in rural areas more often involves a rifle or shotgun. However, this difference tends to diminish over time. In rural areas, and especially in the territories, the number of handgun-related crimes has increased more rapidly than the number of crimes involving rifles or shotguns.
In 2009, police services in the territories reported seven violent crimes involving handguns, which was 8.2% of all firearm-related violent crime in the territories that year. In 2022, this proportion almost quadrupled, as there were 68 violent crimes involving handguns, which was 32% of all firearm-related violent crime in the territories.
In the Provincial North, the proportion of firearm-related violent crime that involved a handgun has also increased significantly. In northern rural areas, this proportion rose from 11% in 2009 to 16% in 2022 (+45%). In northern urban areas, the proportion of firearm-related violent crime that involved a handgun increased from 30% in 2009 to 43% in 2022 (+45%). Rural areas in the south were not spared from this trend, though the increase was more modest (+14%) (Chart 15).
Chart 15 start

Data table for Chart 15
| Year | Provincial urban South | Provincial rural South | Provincial urban North | Provincial rural North | Territories |
|---|---|---|---|---|---|
| percent | |||||
| 2009 | 66.3 | 22.4 | 29.7 | 10.8 | 8.2 |
| 2010 | 61.2 | 22.5 | 34.7 | 14.7 | 8.7 |
| 2011 | 63.2 | 23.4 | 36.7 | 13.0 | 5.6 |
| 2012 | 63.0 | 22.6 | 45.1 | 13.3 | 5.1 |
| 2013 | 63.1 | 22.1 | 47.3 | 14.5 | 12.7 |
| 2014 | 65.8 | 22.8 | 39.1 | 17.9 | 8.7 |
| 2015 | 65.6 | 24.8 | 42.2 | 18.3 | 17.9 |
| 2016 | 64.9 | 26.5 | 41.4 | 20.2 | 13.0 |
| 2017 | 64.5 | 25.9 | 40.6 | 16.4 | 4.6 |
| 2018 | 66.6 | 24.4 | 39.2 | 21.4 | 16.7 |
| 2019 | 66.7 | 24.9 | 38.2 | 16.9 | 21.9 |
| 2020 | 63.3 | 18.6 | 35.6 | 19.5 | 25.8 |
| 2021 | 62.2 | 26.9 | 44.7 | 17.5 | 27.5 |
| 2022 | 62.4 | 25.5 | 43.1 | 15.6 | 32.1 |
|
Note: Rural police services are those where the majority of the population lives outside of a census metropolitan area (CMA) or census agglomeration (CA). Urban police services are those where the majority of the population lives within a CMA or CA. See "Data sources and concepts" for further information. Provincial North encompasses the northern regions of Newfoundland and Labrador, Ontario, Manitoba, Saskatchewan, Alberta and British Columbia (North and South ― Variant of Standard Geographical Classification 2021). Firearm-related violent crimes include incidents where the most serious violation is a firearm-specific violent offence (pointing a firearm, discharging a firearm with intent, use of a firearm in the commission of an offence) and other violent crimes where the most serious weapon present in the incident was a firearm. The number of incidents represents the number of victims, in addition to incidents for which the police did not provide victim records.
Source: Statistics Canada, Canadian Centre for Justice and Community Safety Statistics, Uniform Crime Reporting Survey (Trend Database). |
|||||
Chart 15 end
In southern urban areas, the proportion of firearm-related violent crime that involved handguns fell slightly from 66% in 2009 to 62% in 2022. Nevertheless, the number of crimes involving handguns in southern urban areas rose during this period. However, the increase was faster for crime involving a firearm-like weapon or unknown weapon, as well as for crimes involving a rifle or shotgun. In contrast, the number of crimes involving a fully automatic or sawed-off firearm has declined 33% since 2009.
Men aged 18 to 24 are most likely to be victims of firearm-related violent crimes
Among victims whose genderNote was known, women accounted for just over half (53%) of the victims of all police-reported violent crimes in 2022. However, the picture is different when these crimes involved a firearm. According to police-reported data, in 2022, men accounted for about two-thirds (66%) of victims of firearm-related violent crime. More specifically, police services in Canada reported 38.7 firearm-related violent crimes per 100,000 men (3.6% of violent crimes targeting men) compared with 19.5 incidents per 100,000 women (1.6% of violent crimes targeting women) (Chart 16).
Chart 16 start

Data table for Chart 16
| Age group of victim | Firearm-related violent crime rate | Proportion of violent crimes that were firearm-related |
|---|---|---|
| rate per 100,000 population | percentage of violent crimes | |
| Men | ||
| Under 12 | 6.5 | 1.6 |
| 12 to 17 | 76.3 | 4.2 |
| 18 to 24 | 86.6 | 5.1 |
| 25 to 34 | 68.7 | 4.0 |
| 35 to 44 | 49.2 | 3.5 |
| 45 to 54 | 33.6 | 2.9 |
| 55 to 64 | 17.2 | 2.3 |
| 65 and over | 6.6 | 2.2 |
| Total | 38.7 | 3.6 |
| Women | ||
| Under 12 | 4.0 | 0.8 |
| 12 to 17 | 36.9 | 1.4 |
| 18 to 24 | 47.7 | 2.0 |
| 25 to 34 | 37.0 | 1.7 |
| 35 to 44 | 25.6 | 1.5 |
| 45 to 54 | 17.7 | 1.7 |
| 55 to 64 | 9.0 | 1.7 |
| 65 and over | 2.9 | 1.5 |
| Total | 19.5 | 1.6 |
|
Note: Includes incidents for which the police provided a victim record. Firearm-related violent crimes include incidents where the most serious violation is a firearm-specific violent offence (pointing a firearm, discharging a firearm with intent, use of a firearm in the commission of an offence) and other violent crimes where the most serious weapon present in the incident was a firearm. Excludes victims whose ages were reported as 80 years and older, but were identified as possible instances of miscoding, as well as victims in Quebec whose ages were unknown but were miscoded as 0. The option for police to code victims and accused persons as “non-binary” in the Uniform Crime Reporting (UCR) Survey was implemented in 2018. In the context of the UCR Survey, the term “non-binary” refers to a person who publicly expresses as neither exclusively man nor exclusively woman. Given that small counts of victims and accused persons identified as being non-binary may exist, the UCR data available to the public have been recoded with these victims and accused persons distributed in the “men/boys” or “women/girls” categories based on the regional distribution of gender for the victims and accused persons. This recoding ensures the protection of the confidentiality and privacy of victims and accused persons. Excludes victims where their gender was unknown. Rates are calculated on the basis of 100,000 population. Populations are based upon July 1 estimates from Statistics Canada, Centre for Demography. Source: Statistics Canada, Canadian Centre for Justice and Community Safety Statistics, Uniform Crime Reporting Survey (Trend Database). |
||
Chart 16 end
Men aged 18 to 24 were most likely to have been the target of a violent crime involving a firearm in 2022. Police reported 86.6 victims per 100,000 men in this age group. Among victims in this age group, the proportion of incidents involving a firearm was also higher. Among men aged 18 to 24, 5.1% of violent crimes were committed with firearms in 2022.
Boys aged 12 to 17 had the second-highest victim rate—that is, 76.3 victims of firearm-related violent crime per 100,000 boys in this age group—and 4.2% of crimes targeting this group were committed with a firearm.
Overall, firearm-related violent crime with victims aged 18 to 24 has been declining since 2019. In 2022, the rate of firearm-related violent crime with victims aged 18 to 24 was lower than in 2009 (68.0 compared with 81.0 incidents per 100,000 population, respectively) (Chart 17).
Chart 17 start

Data table for Chart 17
| Year | Under 12 | 12 to 17 | 18 to 24 | 25 to 34 | 35 and over |
|---|---|---|---|---|---|
| rate per 100,000 population | |||||
| 2009 | 7.1 | 57.3 | 81.0 | 45.3 | 17.5 |
| 2010 | 6.5 | 47.2 | 72.2 | 39.2 | 15.0 |
| 2011 | 6.8 | 45.3 | 71.6 | 38.2 | 14.4 |
| 2012 | 5.6 | 44.0 | 61.9 | 37.7 | 14.2 |
| 2013 | 4.8 | 34.6 | 58.0 | 33.9 | 12.3 |
| 2014 | 4.9 | 37.2 | 61.4 | 36.6 | 13.2 |
| 2015 | 6.0 | 38.5 | 70.9 | 43.2 | 14.8 |
| 2016 | 6.5 | 42.1 | 69.8 | 44.6 | 14.5 |
| 2017 | 5.2 | 47.7 | 72.4 | 45.0 | 16.3 |
| 2018 | 5.2 | 43.1 | 69.7 | 45.7 | 15.7 |
| 2019 | 4.6 | 46.9 | 74.6 | 48.8 | 15.9 |
| 2020 | 4.7 | 42.1 | 73.7 | 52.4 | 17.1 |
| 2021 | 4.4 | 45.8 | 69.8 | 52.6 | 16.6 |
| 2022 | 5.6 | 57.1 | 68.0 | 53.4 | 18.7 |
|
Note: Includes incidents for which the police provided a victim record. Firearm-related violent crimes include incidents where the most serious violation is a firearm-specific violent offence (pointing a firearm, discharging a firearm with intent, use of a firearm in the commission of an offence) and other violent crimes where the most serious weapon present in the incident was a firearm. Excludes victims whose ages were reported as 80 years and older, but were identified as possible instances of miscoding, as well as victims in Quebec whose ages were unknown but were miscoded as 0. Rates are calculated on the basis of 100,000 population. Populations are based upon July 1 estimates from Statistics Canada, Centre for Demography. Source: Statistics Canada, Canadian Centre for Justice and Community Safety Statistics, Uniform Crime Reporting Survey (Trend Database). |
|||||
Chart 17 end
Since the low in 2013, the increase in the rate of firearm-related violent crime has mostly been driven by incidents with victims aged 12 to 17 (+65%) and aged 25 to 34 (+58%). The increase was particularly strong for 12 to 17-year-olds over the previous two years, with the rate having increased 36% from 2020 to 2022.
Women represent close to 9 in 10 victims of firearm-related violent crimes committed by an intimate partner
Overall, men represent the majority of victims of firearm-related violent crime, accounting for about two-thirds (66%) of victims in 2022—a proportion that has remained relatively stable since 2009. However, this proportion greatly varied depending on the relationship of the accused to the victim. In particular, women represented 89% of victims of violent crime involving firearms committed by a spouse or an intimate partner, and nearly half (44%) of incidents in which the perpetrator was another family member.
Moreover, violent crime perpetrated by an intimate partner or family member was less likely than crime perpetrated by a stranger to have been committed with a handgun. Among firearm-related violent crimes committed by an intimate partner or family member in 2022, 34% involved a handgun, while 28% involved a rifle or shotgun. When the accused person was a stranger, these proportions were 66% and 9.0%, respectively. This pattern was similar regardless of the victim’s gender.
Overall, firearm-related violent crime was mostly committed by strangers. In 2022, just over half (52%) of victims of firearm-related violent crime had been targeted by a person who was unknown to them. This proportion was much higher than that generally observed for violent crime, 26% of which was committed by a stranger in 2022. Conversely, relatively few firearm-related violent crimes involved a spouse or an intimate partner (9.2%) or a family member (6.0%) when compared with what is observed for violent crime in general (26% and 15%, respectively) (Chart 18).
Chart 18 start

Data table for Chart 18
| Type of violent crime | Spouse or intimate partner | Other family member | Friend or acquaintance | Stranger |
|---|---|---|---|---|
| percent | ||||
| All violent crimes | ||||
| Urban areas | ||||
| Men | 11.2 | 10.5 | 36.3 | 42.0 |
| Women | 38.5 | 14.0 | 29.0 | 18.6 |
| Total | 25.3 | 12.3 | 32.6 | 29.8 |
| Rural areas | ||||
| Men | 15.5 | 21.2 | 44.9 | 18.4 |
| Women | 41.3 | 22.3 | 29.2 | 7.3 |
| Total | 30.2 | 21.8 | 35.9 | 12.1 |
| All areas | ||||
| Men | 12.1 | 12.7 | 38.1 | 37.0 |
| Women | 39.2 | 16.0 | 29.0 | 15.8 |
| Total | 26.4 | 14.5 | 33.3 | 25.8 |
| Firearm-related violent crimes | ||||
| Urban areas | ||||
| Men | 1.4 | 3.3 | 30.9 | 64.4 |
| Women | 21.2 | 6.0 | 24.8 | 48.0 |
| Total | 7.8 | 4.2 | 29.0 | 59.0 |
| Rural areas | ||||
| Men | 2.6 | 13.0 | 54.6 | 29.7 |
| Women | 33.3 | 13.9 | 34.8 | 17.9 |
| Total | 14.8 | 13.3 | 46.8 | 25.1 |
| All areas | ||||
| Men | 1.6 | 5.1 | 35.3 | 58.0 |
| Women | 24.0 | 7.8 | 27.2 | 41.0 |
| Total | 9.2 | 6.0 | 32.6 | 52.2 |
|
Note: Includes victims with a known accused. If there were more than one accused, only the closest relationship to the victim was recorded. Excludes victims where the gender or the accused-victim relationship was unknown. The option for police to code victims and accused persons as “non-binary” in the Uniform Crime Reporting (UCR) Survey was implemented in 2018. In the context of the UCR Survey, the term “non-binary” refers to a person who publicly expresses as neither exclusively man nor exclusively woman. Given that small counts of victims and accused persons identified as being non-binary may exist, the UCR data available to the public have been recoded with these victims and accused persons distributed in the “men/boys” or “women/girls” categories based on the regional distribution of gender for the victims and accused persons. This recoding ensures the protection of the confidentiality and privacy of victims and accused persons. Firearm-related violent crimes include incidents where the most serious violation is a firearm-specific violent offence (pointing a firearm, discharging a firearm with intent, use of a firearm in the commission of an offence) and other violent crimes where the most serious weapon present in the incident was a firearm. Source: Statistics Canada, Canadian Centre for Justice and Community Safety Statistics, Uniform Crime Reporting Survey (Trend Database). |
||||
Chart 18 end
Men in urban areas were most likely to have been targeted by a stranger in violent crime incidents involving a firearm in 2022. Almost two-thirds (64%) of male victims of a firearm-related violent crime in these regions were targeted by a stranger in 2022. Conversely, women in rural areas were less likely to have been targeted by a stranger (18%) and were more likely targeted by a spouse or intimate partner (33%) or by a friend or acquaintance (35%).
Despite an increase from 2021, the proportion of firearm-related violent crimes perpetrated by a stranger has generally been declining since 2009. In 2009, nearly two-thirds (65%) of firearm-related violent crimes were perpetrated by a stranger, compared to 52% in 2022. During the same period, the proportion of firearm-related violent crimes perpetrated by a spouse or intimate partner jumped by more than half, from 6.0% in 2009 to 9.2% in 2022, mainly due to crimes perpetrated by a boyfriend or ex-boyfriend (Chart 19).
Chart 19 start

Data table for Chart 19
| Year | Spouse or intimate partner | Other family member | Friend or acquaintance | Stranger |
|---|---|---|---|---|
| percent | ||||
| 2009 | 6.0 | 4.5 | 24.8 | 64.8 |
| 2010 | 6.9 | 4.6 | 26.2 | 62.3 |
| 2011 | 7.3 | 4.9 | 25.9 | 61.9 |
| 2012 | 7.8 | 4.7 | 26.6 | 60.9 |
| 2013 | 8.0 | 5.1 | 26.5 | 60.4 |
| 2014 | 8.0 | 5.0 | 27.3 | 59.6 |
| 2015 | 7.4 | 5.5 | 26.3 | 60.9 |
| 2016 | 8.2 | 5.3 | 28.3 | 58.1 |
| 2017 | 8.2 | 5.7 | 28.4 | 57.7 |
| 2018 | 8.5 | 5.3 | 29.0 | 57.2 |
| 2019 | 9.1 | 4.8 | 30.3 | 55.8 |
| 2020 | 9.8 | 6.1 | 33.4 | 50.8 |
| 2021 | 10.6 | 6.3 | 34.9 | 48.2 |
| 2022 | 9.2 | 6.0 | 32.6 | 52.2 |
|
Note: Includes victims with a known accused. If there were more than one accused, only the closest relationship to the victim was recorded. Excludes victims for which the accused-victim relationship was unknown. Firearm-related violent crimes include incidents where the most serious violation is a firearm-specific violent offence (pointing a firearm, discharging a firearm with intent, use of a firearm in the commission of an offence) and other violent crimes where the most serious weapon present in the incident was a firearm. Source: Statistics Canada, Canadian Centre for Justice and Community Safety Statistics, Uniform Crime Reporting Survey (Trend Database). |
||||
Chart 19 end
The proportion of firearm-related violent crimes perpetrated by a friend or acquaintance also increased during this period, from 25% in 2009 to 33% in 2022. This increase is mainly due to a higher number of crimes having been committed by an acquaintance specifically. The proportion of crimes perpetrated by a neighbor also posted a sharp increase during this period; 1.2% of firearm-related violent crimes were perpetrated by a neighbor in 2009, compared to 2.5% in 2022.
Overall, the changes noted in the relationship between the victim and the accused in firearm-related violent crime mainly reflects patterns in urban areas, where these changes were noted among both male and female victims. For example, the proportion of firearm-related violent crimes in urban areas with a male victim perpetrated by a stranger went from 73% in 2009 to 64% in 2022. Among women, these proportions were 68% and 48%, respectively. During the same period, the proportion of women in urban areas who were targeted by a spouse or intimate partner increased from 11% to 21%.
This downward trend in the proportion of crimes committed by strangers is mostly observed in violent crimes involving handguns, and to a lesser extent, those involving a fully automatic or sawed-off firearm. For example, 78% of handgun-related violent crimes in 2009 were perpetrated by a stranger. This proportion had fallen to 63% in 2022.
Violent crimes involving firearms are less likely than violent crimes in general to cause injuries, but more likely to result in major injuries
Compared with violent crimes overall, victims of firearm-related violent crimes are less likely to sustain injuries. In 2022, 38% of victims of violent crimes involving a firearm sustained injuries, whether the injuries were inflicted by a firearm, another weapon or physical force. This proportion is lower than the proportion for all violent crimes, 45% of which resulted in injuries (Chart 20).Note
Chart 20 start

Data table for Chart 20
| Type of violent crime | No injury | Minor injuries | Major injuries | Death |
|---|---|---|---|---|
| percent | ||||
| Firearm-related violent crimes | 62.5 | 24.8 | 9.1 | 3.6 |
| All violent crimes | 54.9 | 42.3 | 2.6 | 0.3 |
|
Note: Includes incidents for which the police provided a victim record. Firearm-related violent crimes include incidents where the most serious violation is a firearm-specific violent offence (pointing a firearm, discharging a firearm with intent, use of a firearm in the commission of an offence) and other violent crimes where the most serious weapon present in the incident was a firearm. The data presented in this chart reflects all victims who suffered injuries, regardless of the weapon that caused the injuries. For example, some victims of firearm-related crimes may have suffered injuries that were not caused by a firearm (e.g., physical force); these victims would still be categorized as victims of a firearm-related crime who were injured. The percent calculation excludes victims for whom the level of injuries was unknown or not specified. Source: Statistics Canada, Canadian Centre for Justice and Community Safety Statistics, Uniform Crime Reporting Survey (Trend Database). |
||||
Chart 20 end
However, firearm-related violent crimes were much more likely to result in major injuries or the death of the victim. In 2022, almost 1 in 10 firearm-related violent crimes (9.1%) resulted in major injuries, and 3.6% resulted in the death of the victim. Among all violent crimes, these proportions were 2.6% and 0.3%, respectively.
This trend was similar regardless of the victim’s gender, although firearm-related violent crimes involving male victims were more likely to have resulted in major injuries (11.6%) or the death of the victim (4.6%). For crimes with female victims, these proportions were 3.9% and 1.5%, respectively.
Slight decrease in the proportion of victims injured by a firearm despite an upward trend
In 2022, the proportion of victims of firearm-related violent crime who sustained injuries caused by a firearm declined slightly from the previous year (from 30% in 2021 to 29% in 2022). However, aside from this slight decline in 2022, it is noted that an increasing proportion of victims were injured by a firearm. The year 2011 represented a low, where 23% of victims of violent crime involving firearms suffered injuries.Note Following this, the proportion generally increased year after year until 2022. A particularly large increase was seen among female victims of firearm-related violent crime. In 2013, 15% of them suffered injuries caused by a firearm. In 2022, this proportion rose to 21% (Chart 21).
Chart 21 start
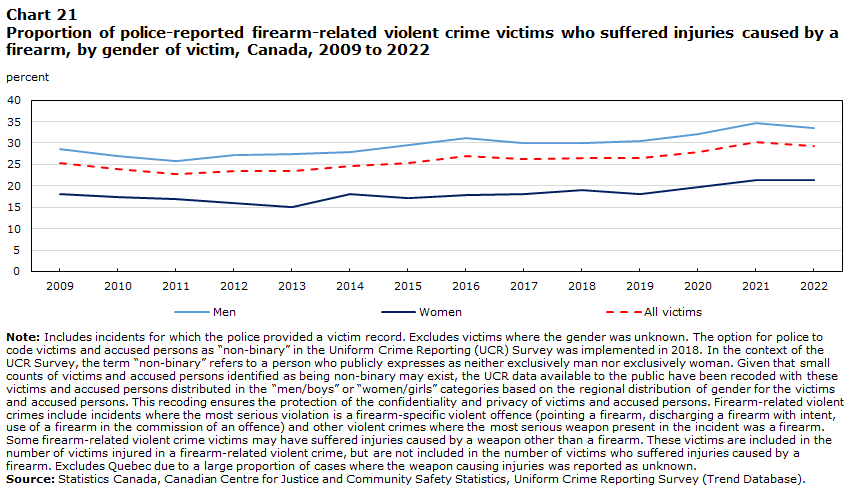
Data table for Chart 21
| Year | Men | Women | All victims |
|---|---|---|---|
| percent | |||
| 2009 | 28.7 | 18.0 | 25.3 |
| 2010 | 27.1 | 17.4 | 23.8 |
| 2011 | 25.7 | 17.0 | 22.8 |
| 2012 | 27.2 | 16.0 | 23.5 |
| 2013 | 27.5 | 15.2 | 23.6 |
| 2014 | 28.0 | 18.1 | 24.7 |
| 2015 | 29.6 | 17.2 | 25.4 |
| 2016 | 31.1 | 17.8 | 26.9 |
| 2017 | 30.1 | 18.0 | 26.2 |
| 2018 | 29.9 | 19.1 | 26.5 |
| 2019 | 30.4 | 18.0 | 26.5 |
| 2020 | 32.0 | 19.7 | 28.0 |
| 2021 | 34.8 | 21.3 | 30.3 |
| 2022 | 33.4 | 21.3 | 29.3 |
|
Note: Includes incidents for which the police provided a victim record. Excludes victims where the gender was unknown. The option for police to code victims and accused persons as “non-binary” in the Uniform Crime Reporting (UCR) Survey was implemented in 2018. In the context of the UCR Survey, the term “non-binary” refers to a person who publicly expresses as neither exclusively man nor exclusively woman. Given that small counts of victims and accused persons identified as being non-binary may exist, the UCR data available to the public have been recoded with these victims and accused persons distributed in the “men/boys” or “women/girls” categories based on the regional distribution of gender for the victims and accused persons. This recoding ensures the protection of the confidentiality and privacy of victims and accused persons. Firearm-related violent crimes include incidents where the most serious violation is a firearm-specific violent offence (pointing a firearm, discharging a firearm with intent, use of a firearm in the commission of an offence) and other violent crimes where the most serious weapon present in the incident was a firearm. Some firearm-related violent crime victims may have suffered injuries caused by a weapon other than a firearm. These victims are included in the number of victims injured in a firearm-related violent crime, but are not included in the number of victims who suffered injuries caused by a firearm. Excludes Quebec due to a large proportion of cases where the weapon causing injuries was reported as unknown. Source: Statistics Canada, Canadian Centre for Justice and Community Safety Statistics, Uniform Crime Reporting Survey (Trend Database). |
|||
Chart 21 end
Although proportionally fewer victims were injured in violent crime incidents involving firearms, the sharp rise in these crimes from 2021 to 2022 still meant that the rate of persons injured by firearms has increased slightly over this period. In fact, the rate of persons injured by firearms increased 4.8% for men and 11% for women (Chart 22).
Chart 22 start

Data table for Chart 22
| Year | Victims of firearm-related violent crime | Victims injured by a firearm | ||
|---|---|---|---|---|
| Men | Women | Men | Women | |
| rate per 100,000 population | ||||
| 2009 | 39.7 | 19.0 | 11.4 | 3.3 |
| 2010 | 33.4 | 17.1 | 8.6 | 2.7 |
| 2011 | 31.8 | 17.3 | 7.6 | 2.5 |
| 2012 | 30.6 | 15.6 | 8.1 | 2.3 |
| 2013 | 27.1 | 13.6 | 7.3 | 1.9 |
| 2014 | 28.4 | 14.7 | 7.9 | 2.5 |
| 2015 | 32.2 | 16.5 | 9.9 | 2.8 |
| 2016 | 33.4 | 15.4 | 11.2 | 2.9 |
| 2017 | 34.8 | 16.9 | 11.3 | 3.2 |
| 2018 | 33.9 | 16.4 | 11.0 | 3.2 |
| 2019 | 36.3 | 16.7 | 12.0 | 3.2 |
| 2020 | 37.0 | 17.7 | 12.6 | 3.8 |
| 2021 | 35.8 | 17.9 | 13.1 | 3.9 |
| 2022 | 38.7 | 19.5 | 13.7 | 4.4 |
|
Note: Includes incidents for which the police provided a victim record. Excludes victims where the gender was unknown. The option for police to code victims and accused persons as “non-binary” in the Uniform Crime Reporting (UCR) Survey was implemented in 2018. In the context of the UCR Survey, the term “non-binary” refers to a person who publicly expresses as neither exclusively man nor exclusively woman. Given that small counts of victims and accused persons identified as being non-binary may exist, the UCR data available to the public have been recoded with these victims and accused persons distributed in the “men/boys” or “women/girls” categories based on the regional distribution of gender for the victims and accused persons. This recoding ensures the protection of the confidentiality and privacy of victims and accused persons. Firearm-related violent crimes include incidents where the most serious violation is a firearm-specific violent offence (pointing a firearm, discharging a firearm with intent, use of a firearm in the commission of an offence) and other violent crimes where the most serious weapon present in the incident was a firearm. Some firearm-related violent crime victims may have suffered injuries caused by a weapon other than a firearm. These victims are not included in the "injured" category in this chart. Excludes Quebec due to a large proportion of cases where the weapon causing injuries was reported as unknown. Source: Statistics Canada, Canadian Centre for Justice and Community Safety Statistics, Uniform Crime Reporting Survey (Trend Database). |
||||
Chart 22 end
Men represent more than 8 in 10 victims injured by a handgun
From 2012 to 2022, firearm-related violent crime injured many more men than women. Men represented 79% of persons with injuries cause by a firearm during this period. However, this proportion varied by the type of firearm. For example, men represented 83% of persons injured by a handgun, but this proportion dropped to 72% of persons injured by a rifle or shotgun (Table 5).
The proportions of men and women among persons injured by a firearm also varied between urban and rural areas. In urban areas, men have represented 81% of victims of all firearm-related violent crime since 2012. In rural areas, this proportion goes down to 70%. In contrast, women represented more than half (56%) of victims of crimes where the injuries had been inflicted by physical force, which are much more frequent than crimes involving firearms.
Firearm-related violent crimes are more likely to result in multiple victims
Police-reported violent crime incidentsNote usually involve one victim. In 2022, among violent crime for which police provided a victim record, approximately 1 in 10 violent crimes resulted in two victims (7.2%) or three or more victims (1.8%).
Most violent crime involving firearms also involved a single victim, but to a lesser extent (78%). In 15% of firearm-related violent crime incidents in 2022, police had identified two victims; in 4.2% of incidents, there were three victims, and in 2.7% of incidents, there were 4 or more victims (Chart 23). Moreover, these proportions were more or less the same in urban and rural areas and in northern and southern regions. The proportion of firearm-related violent crime involving more than one victim was also similar whether it involved a handgun (23%) or a rifle or shotgun (24%), but slightly lower (20%) when it involved another type of firearm. Handguns were, however, slightly more likely to be involved in incidents with 4 or more victims. In 2022, handguns were involved in 53% of incidents with a single victim, but this proportion rose to 61% among incidents with 4 or more victims.
Chart 23 start
Data table for Chart 23
| Year | 2 victims | 3 victims | 4 or more victims |
|---|---|---|---|
| percent | |||
| 2009 | 15.5 | 4.9 | 3.7 |
| 2010 | 16.8 | 4.8 | 3.2 |
| 2011 | 16.9 | 5.2 | 3.3 |
| 2012 | 17.4 | 4.8 | 3.3 |
| 2013 | 15.7 | 4.8 | 3.3 |
| 2014 | 16.3 | 4.7 | 3.3 |
| 2015 | 16.0 | 4.8 | 3.2 |
| 2016 | 15.7 | 4.5 | 3.0 |
| 2017 | 16.4 | 4.3 | 3.4 |
| 2018 | 14.5 | 4.7 | 2.7 |
| 2019 | 15.5 | 3.9 | 3.4 |
| 2020 | 16.0 | 4.4 | 3.0 |
| 2021 | 15.2 | 3.5 | 2.6 |
| 2022 | 15.4 | 4.2 | 2.7 |
|
Note: Includes incidents for which the police provided a victim record. Firearm-related violent crimes include incidents where the most serious violation is a firearm-specific violent offence (pointing a firearm, discharging a firearm with intent, use of a firearm in the commission of an offence) and other violent crimes where the most serious weapon present in the incident was a firearm. Incidents with more than one victim are counted as one incident. Source: Statistics Canada, Canadian Centre for Justice and Community Safety Statistics, Uniform Crime Reporting Survey (Trend Database). |
|||
Chart 23 end
Since 2009, the proportion of firearm-related violent crime involving two victims has stayed relatively stable. However, the proportion of these incidents involving three or more victims seems to be on a slight downward trend, falling from 8.6% in 2009 to 6.9% in 2022, after reaching a low of 6.1% in 2021. This drop was observed both for incidents with 3 victims and those with 4 or more victims (Chart 23).
Start of text box 4
Text box 4
Gang-related violent crimes often involve firearms, but represent a relatively low
proportion of firearm-related violence
In 2016, the Incident-Based Uniform Crime Reporting Survey began collecting information obtained from police on organized crime and street gang activities.Note Note These data highlight some of the differences between crimes that are organized crime related and those that are not.
Organized crime-related violent crimes are much more likely to involve firearms than crimes that are not organized crime-related. In 2022, just over a third (35%) of crimes which police considered or suspected to be linked to organized crime were firearm-related, a proportion 13 times higher than among violent crimes unrelated to organized crime (2.7%).
Nevertheless, organized crime represents a fraction of crime across the country. Although organized crime or gang-related crime often involves firearms, it represented 4.3% of overall firearm-related violent crime reported by police in 2022. However, this proportion increased with the level of injury inflicted on the victim. For example, of incidents in which the victim was not injured, 2.9% were gang related. This proportion increased to 3.3% among firearm-related violent crimes in which the victim suffered minor injuries, 9.4% where the victim suffered major injuries, and almost half (48%) of the incidents where the victim died.
End of text box 4
A third of firearm-related violent crimes occurred on the street, in a park or in another open space
In general, most violent crimes occur in a residence or dwelling unit. From 2012 to 2022, almost 6 in 10 violent crimes took place in a residence. In comparison, 19% occurred in the street, a park or another public area. Firearm-related violent crimes were also common in private homes (43%). However, they were much more likely than other violent crimes to occur in the street, a park or in another open space (33%) (Table 6).
However, similar to violent crime in general, this picture differs depending on the gender of the victim. For example, more than half (53%) of firearm-related violent crimes targeting a woman between 2012 and 2022 occurred in a residence or dwelling unit, a proportion that rose to 74% in rural areas.
From 2012 to 2022, firearm-related violent crimes targeting men were slightly more likely to have occurred in the street, a park or in another open space (39%) than in a residence or dwelling unit (38%). Incidents targeting boys younger than 18 were most likely to have occurred in the street, a park or in another open space (51%).
Just under half of firearm-related violent crime incidents are cleared by charge
In 2022, police had resolved just over half (52%) of incidents of firearm-related violent crime—that is, these cases had been either cleared by charge (46%) or without charge (5.9%) (Chart 24). The remaining incidents (48%) had not yet been cleared. More precisely, 14% of incidents were still under investigation, 29% did not have enough evidence to lay charges, and 4.6% were not cleared because the complainant, the victim or key witnesses did not want to proceed. Overall, these proportions are relatively similar to violent crime in general, for which 55% of cases were cleared (resolved), including 40% that were cleared by charge.
Chart 24 start

Data table for Chart 24
| Year | Cleared by charge | Cleared otherwise | Not cleared |
|---|---|---|---|
| percent | |||
| 2009 | 41.3 | 10.5 | 48.2 |
| 2010 | 41.6 | 10.3 | 48.1 |
| 2011 | 43.4 | 10.3 | 46.3 |
| 2012 | 46.6 | 9.3 | 44.1 |
| 2013 | 48.6 | 8.9 | 42.5 |
| 2014 | 48.1 | 9.3 | 42.7 |
| 2015 | 48.5 | 7.4 | 44.0 |
| 2016 | 49.5 | 6.2 | 44.3 |
| 2017 | 51.2 | 7.2 | 41.6 |
| 2018 | 50.5 | 6.9 | 42.6 |
| 2019 | 48.0 | 5.1 | 46.9 |
| 2020 | 49.3 | 5.7 | 45.0 |
| 2021 | 48.6 | 5.7 | 45.7 |
| 2022 | 46.2 | 5.9 | 47.9 |
|
Note: Firearm-related violent crimes include incidents where the most serious violation is a firearm-specific violent offence (pointing a firearm, discharging a firearm with intent, use of a firearm in the commission of an offence) and other violent crimes where the most serious weapon present in the incident was a firearm. The number of incidents represents the number of victims, in addition to incidents for which the police did not provide victim records. In 2018, changes were made to the definition of "unfounded incident", which may have had an impact on clearance rates (See Canadian Centre for Justice Statistics, 2018). Source: Statistics Canada, Canadian Centre for Justice and Community Safety Statistics, Uniform Crime Reporting Survey (Trend Database). |
|||
Chart 24 end
Among the various offences,Note firearm-related incidents (73%) and hostage taking, kidnapping, forcible confinement or human trafficking (72%) were the most likely to have been cleared by charge in 2022. Discharging a firearm with intent (32%) and pointing a firearm (36%) incidents were the least likely to be cleared by charge (Table 2).
Firearm-related violent crime incidents were also more likely to be cleared by charge when they targeted a woman. For example, between 2012 and 2022, 60% of these incidents were cleared by charge, compared with 50% of incidents where the victim was a man. They were also slightly more likely to be cleared by charge when they occurred in rural areas (59%) than in urban areas (46%) (Table 6). Several factors can impact the incident clearance rate. For example, organized crime-related or drug-related crimes are generally less likely to be cleared, whereas crimes committed by a family member or a person known to the victim may be more easily resolved (Hotton Mahony & Turner, 2012; Paré et al., 2007).
The proportion of firearm-related violent crime incidents cleared by charge has fluctuated somewhat since 2009. From 41% of incidents cleared by charge in 2009, this proportion climbed to a peak of 51% in 2017, before going back down to 46% in 2022. The proportion of incidents cleared otherwise has generally trended downward, decreasing from 11% in 2009 to 5.9% in 2022 (Chart 24).
However, the proportion of incidents not cleared (unresolved) has increased over the past few years. In 2017, 42% of firearm-related violent crime incidents had not been cleared. In 2022, this proportion was 48%. This recent increase in the proportion of incidents not cleared may be partly due to the increase in incidents of discharging a firearm with intent and pointing a firearm, many of which are unresolved. In 2018, changes were also made to the definition of a “founded”Note incident, which may have affected the clearance rate (Canadian Centre for Justice Statistics, 2018; Moreau, 2019).
A quarter of firearm-related violent crimes involved more than one accused person
Firearm-related violent crimes were much more likely than other crimes to involve more than one accused. In 2022, one-quarter (25%) of firearm-related violent crimes involved more than one accused person. More specifically, 15% of these crimes were committed by two accused persons, 6.0% were perpetrated by three accused, and 3.6% involved four or more accused persons (Chart 25). Among all violent crimes, 4.7% involved two accused persons, and 1.3% involved three or more accused persons.
Chart 25 start

Data table for Chart 25
| Year | 2 accused | 3 accused | 4 or more accused |
|---|---|---|---|
| percent | |||
| 2009 | 16.4 | 6.5 | 3.6 |
| 2010 | 14.7 | 5.2 | 3.3 |
| 2011 | 15.0 | 4.4 | 3.8 |
| 2012 | 15.1 | 6.1 | 3.0 |
| 2013 | 14.8 | 5.1 | 3.5 |
| 2014 | 14.5 | 5.6 | 3.6 |
| 2015 | 15.0 | 5.9 | 3.9 |
| 2016 | 15.5 | 6.3 | 4.4 |
| 2017 | 16.0 | 5.7 | 4.4 |
| 2018 | 16.2 | 6.1 | 3.9 |
| 2019 | 16.4 | 5.7 | 3.6 |
| 2020 | 14.7 | 5.9 | 3.6 |
| 2021 | 14.7 | 5.3 | 3.1 |
| 2022 | 15.1 | 6.0 | 3.6 |
|
Note: Includes incidents in which police identified at least one accused. Firearm-related violent crimes include incidents where the most serious violation is a firearm-specific violent offence (pointing a firearm, discharging a firearm with intent, use of a firearm in the commission of an offence) and other violent crimes where the most serious weapon present in the incident was a firearm. Incidents with more than one victim are counted as one incident. Source: Statistics Canada, Canadian Centre for Justice and Community Safety Statistics, Uniform Crime Reporting Survey (Trend Database). |
|||
Chart 25 end
Firearm-related violent crime incidents were more likely to be committed by several accused persons in urban areas than in rural areas. In urban areas, 17% of incidents involved two accused persons, and 11% involved three or more accused persons. In rural areas, these proportions were 11% and 5.8%, respectively. In southern regions, 16% of incidents involved two accused persons and 11% involved three or more. In northern regions, these proportions were 13% and 5.6%, respectively.
Additionally, violent firearm-related violent crime incidents involving more than one accused were more likely to be considered or suspected to be linked to organized crime. For example, in 2022, 2.2%Note of incidents involving a single accused were considered to be linked to organized crime. This proportion rose to 6.1% among incidents involving two accused, and to 9.2% among incidents involving 3 or more accused.Note
Almost 9 in 10 persons accused of firearm-related violent crime are men
Police-reported violent crime in Canada predominantly involves men as accused persons, and this is even more the case for firearm-related violent crime. According to police-reported data, in 2022, about three-quarters (77%) of accused in violent crime incidents were men. This proportion rose to approximately 9 in 10 (89%) persons accused of firearm-related violent crimes. However, this proportion was slightly lower in northern rural areas and in the territories, where 85% of accused persons were men (Table 7).
More specifically, among boys aged 12 to 17, the rate of accused persons peaked in 2022, with 110.6 accused persons per 100,000 boys in this age group. This increased rate of accused youth was mainly attributable to the situation in urban areas of the provinces (112.2 accused persons per 100,000 boys aged 12 to 17). In rural areas of the Provincial South, the rate of boys aged 12 to 17 accused of firearm-related violent crimes (64.5) was almost half the corresponding rate in urban areas. In rural areas of the Provincial South, the highest rate of accused persons was among men aged 25 to 34 (92.3 accused persons per 100,000 men aged 25 to 34). The picture is similar in rural areas of the Provincial North and in the territories, where the highest rate was recorded among men aged 18 to 24 (350.1), followed by men aged 25 to 34 (338.9).
The rate of boys accused of firearm-related violent crime rose sharply from 2021 to 2022. In all urban regions (South and North), this rate increased by 54% in a single year (from 72.9 to 112.4 accused per 100,000 boys aged 12 to 17). In rural areas overall, the increase was 37% (from 73.8 to 101.2 accused per 100,000 boys aged 12 to 17), and this followed a 19% increase between 2020 and 2021 (Chart 26).
Chart 26 start
Data table for Chart 26
| Year | Urban areas | Rural areas | ||
|---|---|---|---|---|
| Boys | Girls | Boys | Girls | |
| rate per 100,000 population | ||||
| 2009 | 94.4 | 5.4 | 112.0 | 12.0 |
| 2010 | 73.4 | 4.2 | 100.1 | 9.8 |
| 2011 | 75.0 | 3.6 | 90.2 | 6.7 |
| 2012 | 68.8 | 4.1 | 104.4 | 12.0 |
| 2013 | 62.6 | 5.2 | 84.1 | 7.8 |
| 2014 | 71.1 | 4.2 | 92.8 | 2.7 |
| 2015 | 73.8 | 6.0 | 83.9 | 13.7 |
| 2016 | 73.6 | 5.6 | 112.4 | 12.0 |
| 2017 | 90.5 | 7.2 | 94.0 | 12.1 |
| 2018 | 86.8 | 7.6 | 89.4 | 13.8 |
| 2019 | 81.4 | 6.7 | 104.1 | 8.2 |
| 2020 | 77.2 | 8.7 | 62.3 | 12.8 |
| 2021 | 72.9 | 8.2 | 73.8 | 10.0 |
| 2022 | 112.4 | 7.4 | 101.2 | 8.7 |
|
Note: Data is based on the number of youth aged 12 to 17 who were either charged (or recommended for charging) by police or diverted from the formal criminal justice system through the use of warnings, cautions, referrals to community programs etc. Rural police services are those where the majority of the population lives outside of a census metropolitan area (CMA) or census agglomeration (CA). Urban police services are those where the majority of the population lives within a CMA or CA. See "Data sources and concepts" for further information. The option for police to code victims and accused persons as “non-binary” in the Uniform Crime Reporting (UCR) Survey was implemented in 2018. In the context of the UCR Survey, the term “non-binary” refers to a person who publicly expresses as neither exclusively man nor exclusively woman. Given that small counts of victims and accused persons identified as being non-binary may exist, the UCR data available to the public have been recoded with these victims and accused persons distributed in the “men/boys” or “women/girls” categories based on the regional distribution of gender for the victims and accused persons. This recoding ensures the protection of the confidentiality and privacy of victims and accused persons. Firearm-related violent crimes include incidents where the most serious violation is a firearm-specific violent offence (pointing a firearm, discharging a firearm with intent, use of a firearm in the commission of an offence) and other violent crimes where the most serious weapon present in the incident was a firearm. Source: Statistics Canada, Canadian Centre for Justice and Community Safety Statistics, Uniform Crime Reporting Survey (Trend Database). |
||||
Chart 26 end
The number of women accused of firearm-related violent crimes is on the rise
Women represent a minority of persons accused of committing firearm-related violent crimes, at just over 1 in 10 (11%) accused persons in 2022. However, the number of women accused is growing: the rate of women accused of firearm-related violent crimes (5.0 incidents per 100,000 women) rose 88% in 10 years. This trend contrasts with that observed for violent crime in general, for which the rate of female accused persons has dropped (-14%) since 2012.
The increased rate of women accused of firearm-related violent crimes was particularly high among women aged 25 to 34, for whom the rate has almost tripled (+188%) since 2012, and has been observed in both urban (+227%) and rural (+167%) areas of the Provincial South. In northern rural areas and in the territories, the rate of women accused significantly increased in all age groups, except girls aged 12 to 17, whose rate fell (-20%) (Table 7).
For men, the rate of persons accused of firearm-related violent crimes has also increased since 2012, while the rate for all violent crimes has decreased. Overall, the increase (+26%) was smaller than the increase for women (+88%). However, since most accused persons are men, this 26% increase represented just over 2,000 more accused persons than in 2012, while the 88% increase for women represented about 450 more accused persons. Generally speaking, the increase (+31%) in the rate of persons accused of firearm-related violent crimes since 2012 is therefore largely attributable to men.
Nevertheless, it is worth noting that the rate of men aged 18 to 24 accused of firearm-related violent crimes in 2022 has barely increased in 10 years (+4%). In 2012, men aged 18 to 24 reported the highest rate of accused persons among all the age groups of this gender. In 2022, the rate of accused boys aged 12 to 17 topped the rate for men aged 18 to 24.
Persons accused of firearm-related violent crimes are increasingly likely to be charged
When police identify one or more accused persons, charges are generally laid or recommended against them. However, this is not always the case. For example, charges may not be laid because of the death of the accused person or because a key witness died before charges were laid, because the complainant did not wish to proceed, or for another reason at the discretion of the police. When accused persons are minors, the police can also choose to clear the incident with an extrajudicial measure (warning, referral to a community or extrajudicial sanctions program), depending on the case.
In 2022, police laid or recommended charges against 87% of accused persons, 6 percentage points higher than 10 years earlier, when 81% of accused persons were charged. This proportion was higher in urban areas of the provinces (88%), but it was slightly lower in rural areas of the Provincial South (85%) and in northern rural areas or in the territories (81%) (Table 8).
These lower proportions of accused persons charged in rural areas and northern regions may be partly attributable to the lower proportion of crime committed by strangers. In rural areas, incidents were more likely to be cleared otherwise, particularly because the complainant did not wish to proceed.Note It is more common for an incident to be cleared otherwise for this reason when the victim and the accused person know each other, which is more common in rural areas. Nevertheless, rural areas and the territories saw the proportion of accused persons charged increase the most since 2012. In southern rural areas, this proportion rose from 72% in 2012 to 85% in 2022, whereas it increased from 68% to 81% in northern rural areas and in the territories.
The increase in the proportion of persons accused of firearm-related violent crimes who have been charged was more notable for women, for whom the proportion of accused persons charged increased from 69% in 2012 to 81% in 2022. For men, this proportion rose from 82% to 87% during the same period. This increase in charges for women is particularly notable in rural areas, both in the Provincial North and South, and in the territories. In rural areas in the Provincial South, 77% of accused persons were charged in 2022, compared with 59% 10 years earlier. In rural areas in the Provincial North and in the territories, this proportion rose from 37% in 2012 to 72% in 2022.
Firearm-related homicides in Canada, 2022
As with violent crime in general, firearm-related homicide saw an increase in 2022. In 2022, police reported 342 homicide victims killed with a firearm. This is a peak since collection of homicide data began in 1961, and 44 more than the previous peak a year earlier. From 2021 to 2022, the rate of firearm-related homicide rose from 0.78 to 0.88 homicides per 100,000 population, an increase of 13%. This gain is similar to the increase in stabbing homicides (+14%), but higher than the increase in homicides where the death was caused by beating (+5.6%) or another method (+0.6%) (Chart 27).
Chart 27 start

Data table for Chart 27
| Year | Shooting | Stabbing | Beating | All other methods |
|---|---|---|---|---|
| rate per 100,000 population | ||||
| 1972 | 0.90 | 0.35 | 0.41 | 0.48 |
| 1973 | 0.97 | 0.41 | 0.46 | 0.28 |
| 1974 | 1.24 | 0.41 | 0.57 | 0.36 |
| 1975 | 1.26 | 0.54 | 0.70 | 0.50 |
| 1976 | 1.10 | 0.58 | 0.63 | 0.53 |
| 1977 | 1.10 | 0.63 | 0.64 | 0.62 |
| 1978 | 1.04 | 0.61 | 0.63 | 0.45 |
| 1979 | 0.86 | 0.67 | 0.55 | 0.51 |
| 1980 | 0.79 | 0.56 | 0.48 | 0.54 |
| 1981 | 0.80 | 0.71 | 0.62 | 0.44 |
| 1982 | 0.99 | 0.72 | 0.49 | 0.43 |
| 1983 | 0.89 | 0.68 | 0.60 | 0.50 |
| 1984 | 0.89 | 0.74 | 0.46 | 0.50 |
| 1985 | 0.86 | 0.88 | 0.47 | 0.50 |
| 1986 | 0.67 | 0.63 | 0.48 | 0.37 |
| 1987 | 0.76 | 0.70 | 0.51 | 0.43 |
| 1988 | 0.63 | 0.63 | 0.52 | 0.35 |
| 1989 | 0.79 | 0.62 | 0.47 | 0.48 |
| 1990 | 0.70 | 0.77 | 0.47 | 0.40 |
| 1991 | 0.97 | 0.80 | 0.51 | 0.40 |
| 1992 | 0.87 | 0.74 | 0.53 | 0.42 |
| 1993 | 0.68 | 0.67 | 0.40 | 0.42 |
| 1994 | 0.68 | 0.53 | 0.37 | 0.46 |
| 1995 | 0.59 | 0.62 | 0.41 | 0.35 |
| 1996 | 0.72 | 0.66 | 0.44 | 0.28 |
| 1997 | 0.65 | 0.56 | 0.38 | 0.35 |
| 1998 | 0.50 | 0.62 | 0.41 | 0.30 |
| 1999 | 0.55 | 0.47 | 0.41 | 0.32 |
| 2000 | 0.60 | 0.49 | 0.42 | 0.25 |
| 2001 | 0.55 | 0.55 | 0.39 | 0.26 |
| 2002 | 0.49 | 0.58 | 0.40 | 0.32 |
| 2003 | 0.52 | 0.45 | 0.39 | 0.33 |
| 2004 | 0.54 | 0.64 | 0.43 | 0.30 |
| 2005 | 0.69 | 0.61 | 0.44 | 0.26 |
| 2006 | 0.59 | 0.64 | 0.37 | 0.23 |
| 2007 | 0.57 | 0.57 | 0.36 | 0.23 |
| 2008 | 0.60 | 0.61 | 0.37 | 0.23 |
| 2009 | 0.54 | 0.62 | 0.35 | 0.26 |
| 2010 | 0.52 | 0.49 | 0.34 | 0.26 |
| 2011 | 0.46 | 0.61 | 0.38 | 0.28 |
| 2012 | 0.49 | 0.47 | 0.33 | 0.24 |
| 2013 | 0.38 | 0.56 | 0.29 | 0.20 |
| 2014 | 0.44 | 0.53 | 0.29 | 0.18 |
| 2015 | 0.51 | 0.60 | 0.38 | 0.17 |
| 2016 | 0.62 | 0.48 | 0.32 | 0.22 |
| 2017 | 0.73 | 0.56 | 0.30 | 0.19 |
| 2018 | 0.68 | 0.49 | 0.33 | 0.22 |
| 2019 | 0.70 | 0.57 | 0.27 | 0.24 |
| 2020 | 0.73 | 0.63 | 0.36 | 0.22 |
| 2021 | 0.78 | 0.64 | 0.35 | 0.21 |
| 2022 | 0.88 | 0.72 | 0.37 | 0.22 |
|
Note: Rates are calculated on the basis of 100,000 population. Populations are based upon July 1 estimates from Statistics Canada, Centre for Demography. Source: Statistics Canada, Canadian Centre for Justice and Community Safety Statistics, Homicide Survey. |
||||
Chart 27 end
The rate of shooting homicides in 2022 is still far from the peak of 1975 (1.26 shooting homicides per 100,000 population), but it is the highest since 1991. Over the past few years, shooting homicides have seen a particularly pronounced increase. Since the low in 2013, the rate of firearm-related homicide has more than doubled (+130%) from 0.38 to 0.88 firearm-related homicides per 100,000 population. During the same period, the rate of homicides involving a knife, or another sharp object was up 30%, the rate of homicides by beating increased 26%, and the rate of homicides committed by another method rose 9.7%. Furthermore, since 2016, discharging a firearm has returned to being the main cause of death for homicide. Before that, from 1985 to 2015, the most common cause of death for homicide in Canada alternated between shooting and stabbing.
Handguns involved in almost two-thirds of firearm-related homicides
As has been the case each year since 1995, in 2022 handguns (63%) were the type of firearm most often used in shooting homicides in Canada, especially among homicides with a victim aged 18 to 24 (75%). Next were rifles or shotguns, involved in about one-quarter (23%) firearm-related homicides in 2022. The 216 victims of handgun-related homicide represented the largest number of victims recorded to date in the Homicide Survey, as did the corresponding rate (0.55 per 100,000 population), which topped the high in 1991 (0.48) (Chart 28).
Chart 28 start

Data table for Chart 28
| Year | Rifle or shotgun | Handgun | Other type of firearm |
|---|---|---|---|
| rate per 100,000 population | |||
| 1972 | 0.61 | 0.25 | 0.05 |
| 1973 | 0.61 | 0.26 | 0.09 |
| 1974 | 0.84 | 0.33 | 0.07 |
| 1975 | 0.83 | 0.38 | 0.05 |
| 1976 | 0.72 | 0.29 | 0.09 |
| 1977 | 0.74 | 0.26 | 0.10 |
| 1978 | 0.75 | 0.26 | 0.03 |
| 1979 | 0.57 | 0.22 | 0.06 |
| 1980 | 0.50 | 0.25 | 0.04 |
| 1981 | 0.50 | 0.24 | 0.06 |
| 1982 | 0.62 | 0.35 | 0.02 |
| 1983 | 0.52 | 0.31 | 0.06 |
| 1984 | 0.56 | 0.26 | 0.07 |
| 1985 | 0.54 | 0.28 | 0.03 |
| 1986 | 0.44 | 0.15 | 0.08 |
| 1987 | 0.43 | 0.22 | 0.11 |
| 1988 | 0.38 | 0.18 | 0.08 |
| 1989 | 0.49 | 0.20 | 0.11 |
| 1990 | 0.36 | 0.25 | 0.10 |
| 1991 | 0.46 | 0.48 | 0.03 |
| 1992 | 0.37 | 0.45 | 0.04 |
| 1993 | 0.32 | 0.32 | 0.04 |
| 1994 | 0.32 | 0.31 | 0.05 |
| 1995 | 0.26 | 0.32 | 0.01 |
| 1996 | 0.33 | 0.36 | 0.03 |
| 1997 | 0.29 | 0.33 | 0.02 |
| 1998 | 0.22 | 0.24 | 0.05 |
| 1999 | 0.21 | 0.30 | 0.04 |
| 2000 | 0.22 | 0.35 | 0.03 |
| 2001 | 0.17 | 0.36 | 0.03 |
| 2002 | 0.15 | 0.32 | 0.03 |
| 2003 | 0.15 | 0.35 | 0.02 |
| 2004 | 0.16 | 0.35 | 0.03 |
| 2005 | 0.22 | 0.41 | 0.07 |
| 2006 | 0.20 | 0.34 | 0.05 |
| 2007 | 0.15 | 0.38 | 0.04 |
| 2008 | 0.16 | 0.39 | 0.06 |
| 2009 | 0.14 | 0.33 | 0.07 |
| 2010 | 0.15 | 0.31 | 0.06 |
| 2011 | 0.13 | 0.28 | 0.05 |
| 2012 | 0.14 | 0.31 | 0.05 |
| 2013 | 0.11 | 0.26 | 0.02 |
| 2014 | 0.11 | 0.29 | 0.03 |
| 2015 | 0.17 | 0.29 | 0.05 |
| 2016 | 0.17 | 0.36 | 0.08 |
| 2017 | 0.24 | 0.40 | 0.09 |
| 2018 | 0.20 | 0.39 | 0.09 |
| 2019 | 0.23 | 0.35 | 0.12 |
| 2020 | 0.22 | 0.36 | 0.15 |
| 2021 | 0.21 | 0.44 | 0.13 |
| 2022 | 0.20 | 0.55 | 0.12 |
|
Note: Rates are calculated on the basis of 100,000 population. Populations are based upon July 1 estimates from Statistics Canada, Centre for Demography. Source: Statistics Canada, Canadian Centre for Justice and Community Safety Statistics, Homicide Survey. |
|||
Chart 28 end
In total, 76% of shooting homicides in 2022 were committed in urban areas of the Provincial South, a slightly lower proportion than the population living in these areas (81%). The remaining proportion of shooting homicides was committed in the Provincial North and in the territories (13%) or in southern rural areas (10%). As was the case for firearm-related violent crime in general, the rate of shooting homicides was higher in northern regions, including the territories (1.96 victims per 100,000 population), and it was well above that recorded in southern urban (0.83) or rural (0.72) areas.
In 2022, almost all (192 victims, or 89%) victims of handgun homicides were in southern urban areas. However, the distribution of homicides involving a rifle or shotgun across the country differed: 50% were committed in southern urban areas, 28% in northern regions and 22% in southern rural areas.
Indigenous and Black individuals are overrepresented among victims of firearm-related homicides
Some population groups are more likely to be exposed to firearm-related violence, including firearm-related homicides. For example, Indigenous individuals (i.e., First Nations people, Inuit and Métis) represented 17% of firearm-related homicide victims in 2022, both among male victims (17%) and female victims (18%). This proportion is much higher for homicides involving a rifle or shotgun (40%) than homicides involving handguns (7.6%). The proportion of Indigenous individuals among all victims of firearm-related homicides (17%) is more than three times higher than their proportion in the Canadian population (5%). However, Indigenous people accounted for an even higher proportion of homicides that did not involve a firearm in 2022 (33%). Both the National Inquiry into Missing and Murdered Indigenous Women and Girls and the Truth and Reconciliation Commission of Canada have indicated that persistent and deliberate human and Indigenous rights violations and the resulting abuses are the root cause of the increased rates of violence against Indigenous individuals (National Centre for Truth and Reconciliation 2015; National Inquiry into Missing and Murdered Indigenous Women and Girls 2019).
Racialized individuals are also overrepresented among victims of firearm-related homicides. While they represented just over a quarter (26.5%) of the population in the 2021 Census, they accounted for almost half (48%) of firearm-related homicide victims in 2022, a proportion that rises to 61% for homicides involving handguns. Black individuals were especially overrepresented, accounting for a quarter (25%) of firearm-related homicide victims and nearly a third (32%) of victims of homicides involving handguns. In contrast, they represent 4.3% of the total Canadian population. South Asian individuals were also overrepresented among firearm-related homicide victims (13%) compared with their proportion in the entire population (7.1%), but to a lesser extent than Black individuals. Racialized individuals encounter various types of discrimination and systemic racism, as well as socioeconomic marginalization, which—like with Indigenous people—has influenced their representation among crime victims.
Few accused in firearm-related homicides had a valid firearm licence
The firearms used in homicidesNote were rarely legal firearms used by their legal owners who were in good standing. In around half of the firearm-related homicides in 2022 for which this information was known (113 homicides), the firearm was legal in origin—that is, it had initially been obtained legally in half of cases (58 of 113 homicides). Rifles or shotguns were slightly more likely to be of legal origin (58%, or 22 of 38 homicides) than handguns (49%, or 36 of 74 homicides). Among incidents in which the firearm had initially been obtained legally, the accused was the legal firearm owner in 44% of cases (24 of 54 homicides).
Among the incidents in which the firearm had not initially been obtained legally, or in which the firearm was not legally owned at the time of the homicide, and for which this information was known (49 homicides), the firearm had been stolen from the legal Canadian owner in eight cases, and in five other cases, it had been purchased illegally from the legal Canadian owner. In most cases (36 homicides), the firearm was illegal; that is, it had never been legally owned in Canada. Of these 36 illegal firearms, 20 were sent for tracing: 6 of these were American in origin, while the origin of the 14 others was not known. In total, 79 firearms were sent for tracing, including those that turned out to be legal. Of these 79 firearms, 16 were of Canadian origin, 14 of American origin, 1 of foreign origin, and 48 of unknown origin.
In most firearm-related homicides, the accused did not have a valid firearm licence for the class of firearm used. Among the homicides for which the information was available, the accused had a licence in 13% (16 of 119 homicides) of homicides involving a handgunNote and in 12% (7 of 59) of homicides involving a rifle or shotgun.Note
A history of violence is more common in firearm-related homicides, except in spousal or family homicides
Persons accused of firearm-related homicide are more likely to have a criminal history than persons accused of homicide committed by another method. In 2022, close to 7 in 10 (69%) persons accused of firearm-related homicide had a criminal history, compared with 57% of persons accused of homicides committed by another method. What’s more, around half (51%) had a history of violence (compared with 45%), 45% had a history pertaining to property crime (compared with 38%), and 62% had a history pertaining to other Criminal Code or federal statute offences, such as drug- or firearm-related offences (compared with 42%).
However, it was slightly less common for the police to be aware of a history of violence in cases of spousal or family homicide committed with a firearm than in cases of homicides committed by another method. In one-third (33%) of firearm-related homicides committed by a spouse, an intimate partner or another family member between 2013 and 2022, the police were aware of a history of family or spousal violence between the victim and the accused. This proportion was 43% for homicides committed by another method. In other words, spousal or family homicides involving a firearm were slightly more likely than homicides committed by another method to have occurred within a couple or a family with no history of violence known to the police.
Almost half of firearm-related homicides were related to organized crime
Generally speaking, firearm-related homicides are more likely to be connected with illegal activities. In 2022, more than two-thirds (69%) of victims of firearm-related homicides were involved in illegal activities, compared with one-third (33%) of victims of homicides that did not involve a firearm.
According to police data, almost half (47%) of shooting homicides were confirmed or suspected to be organized crime related in 2022, compared with 7% of homicides committed using other methods.Note Proportions varied according to the type of firearm: 52% of handgun homicides were organized crime related, as were 26% of homicides involving a rifle or a shotgun.
In other words, most (82%) organized crime-related homicides involved discharging a firearm, and two-thirds (70%) of these homicides were committed with a handgun.
For more information on homicide in Canada in 2022, see Statistics Canada, 2023, November 29.
Start of text box 5
Text box 5
Other firearm-related crimes in Canada
Firearm-related crimes are not all classified as violent. There are a number of non-violent crimes, including breaking and entering to steal a firearm and a number of firearm-related administrative offences for which police report information through the Uniform Crime Reporting Survey (UCR). For detailed statistics based on offences, the following tables can be consulted: 35-10-0001-01, 35-10-0002-01, 35-10-0026-01, 35-10-0061-01 to 35-10-0064-01, 35-10-0066-01, 35-10-0067-01 and 35-10-0177-01 to 35-10-0191-01.
Additionally, another measure of firearm-related crime in Canada is the number of incidents in which a firearm was reported missing to the police. Through the UCR, police can identify up to five different types of stolen property in an incident, including four categories of firearms: restricted weapons, rifles, shotguns and other firearms. In 2022, there were 2,086 incidents where at least one firearm was included in the stolen property,Note which represents a 5% decrease in the number of incidents, compared with 2021 (2,196). In fact, the number of incidents in which a firearm was stolen significantly dropped from 2019 to 2020 (-21%), then again from 2020 to 2021 (-16%). The COVID-19 pandemic and the associated restrictions may have contributed to the drop recorded over these years, as is the case for many other types of crime, especially crime against property (Moreau, 2022). That said, incidents in which firearms were stolen have been trending downward since 2015, when they peaked at 4,138 incidents.
In 2022, rifles were the firearm type most often reported stolen (1,208 incidents involving at least one stolen rifle), followed by shotguns (564), other firearms (440) and restricted firearms (299).Note Rifles have been the firearm type most frequently reported stolen since 2009, when comparable trend data became available.
End of text box 5
Summary
In 2022, police services in Canada reported about 14,000 firearm-related violent crimes, which represents a rate of 36.7 incidents per 100,000 population. This rate is 8.9% higher than that recorded in the previous year (33.7 incidents per 100,000 population) and represents a peak since collection of comparable data began in 2009. The rate of firearm-related homicide (0.88 incidents per 100,000) was also the highest rate recorded since 1991. Since 2016, shooting has been the main method for committing homicide, surpassing stabbing.
The increase in the rate of firearm-related violent crime from 2021 is mainly attributable to the increase in Ontario (+24%), New Brunswick (+24%) and British Columbia (+12%). That said, since the rate of firearm-related violent crime reached a low in 2013, all provinces and territories have had an increase in the firearm-related violent crime rate. Since 2013, the highest rate increases have been recorded in the Northwest Territories (+303%), Saskatchewan (+165%), Yukon (+149%) and New Brunswick (+126%).
Overall, the increase in the rate of firearm-related violent crime since the low of 2013 was larger in rural areas of the Provincial North (+141%), in the territories (+139%) and in urban areas of the Provincial North (+89%). While the overall increase in the rate of firearm-related violent crime since 2013 was observed less in southern urban areas (+45%), some census metropolitan areas saw a relatively significant increase over the past few years. In 10 years, the rate almost quadrupled in Greater Sudbury, Thunder Bay and Regina.
The increase in firearm-related violent crime rate since the low in 2013 is partly attributable to violent crime in general, whether or not it was committed with a firearm, being on the rise. However, violent crime is also more likely to be committed with a firearm. In 2013, 2.2% of violent crime was committed with a firearm, a proportion that rose to 2.8% in 2022. Since 2013, the rate of firearm-related violent crime increased more rapidly than the rate of violent crime in general (+55% compared with +24%).
Moreover, the rate of firearm-related violent crime increased for most offences. The largest increase since the low in 2013 was among firearm-specific offences—discharging a firearm with intent, using a firearm during the commission of an offence, and pointing a firearm—which saw a 120% increase. This was followed by threats, extortion or intimidation incidents (+93%) and homicide, other offences causing death, and attempted murder (+64%).
Not only are violent crimes increasingly likely to involve a firearm, but they are also causing an increasing number of injuries. In 2022, 1.7% of injured victims of violent crimes were injured by a firearm, compared with 1.0% in 2013.
The increase in the rate of firearm-related violent crime can also be seen for all types of firearms. Since 2013, the rate of crime involving a handgun, which represented 52% of firearm-related violent crime in 2022, has increased by 50%. This increase is smaller than the one for crimes involving a firearm-like weapon or an unknown type (+76%), but higher than the gain for crimes involving a rifle or a shotgun (+45%) or a fully automatic or sawed-off weapon (+35%).
Boys aged 12 to 17 were most likely to be accused of firearm-related violent crime in 2022. They represented 18% of all accused persons. The rate of young accused persons from this age group (110.6 accused persons per 100,000 boys aged 12 to 17) has risen 47% since 2012, surpassing the rate recorded among men aged 18 to 24, for whom the rate has increased 4% since 2012 to 100.8 in 2022.
Firearm-related violent crime was more likely than violent crime in general to involve more than one accused person (25% of firearm-related violent crime compared with 6.0%) or to have more than one victim (22% compared with 10%). Around 4% of firearm-related violent crime was or thought to be attributable to gangs or organized crime. However, this proportion rapidly increased with the level of injury suffered by the victim.
Detailed data tables
Table 4 Police-reported firearm-related violent crime incidents, by type of firearm, 2009 to 2022
Data sources and concepts
Uniform Crime Reporting Survey
The Uniform Crime Reporting (UCR) Survey was established in 1962 with the co-operation and assistance of the Canadian Association of Chiefs of Police. The survey is a compilation of police-reported crimes that have been reported to federal, provincial/territorial and municipal police services in Canada.
One incident can involve multiple offences. In order to ensure comparability, counts presented in this article are based on the most serious offence in the incident. The most serious violation is determined by police according to standardized classification rules in the UCR which consider, for instance, whether or not the offence is violent as well as the maximum penalty imposed by the Criminal Code.
For the purposes of this analysis, a firearm-related violent crime refers to a crime where a firearm was present during the commission of the offence and for which police determined that the firearm was relevant to the crime, whether or not it was used. Crimes involving a firearm-like weapon, such as an imitation weapon or a pellet gun, are also included in the analyses. Firearm-specific offences—such as discharging a firearm with intent, pointing a firearm and using a firearm during the commission of an offence—are also counted as crimes involving firearms, including cases in which information on the weapon was unknown.
In Quebec, the information management system used by most police services produces a relatively high proportion of unknown values for the variable “most serious weapon present.” Although firearm-related crime is probably correctly recorded in most cases, an undercount remains possible. Therefore, caution should be exercised when comparing Quebec data to data from the other provinces or territories.
Incident-based Uniform Crime Reporting Survey, Trend Database
The Incident-based Uniform Crime Reporting (UCR2) Survey Trend Database is a microdata survey that captures detailed information on crimes reported to and substantiated by police, including the characteristics of victims, accused persons and incidents. Coverage from the UCR2 between 2009 and 2022 is estimated at 99% of the population of Canada and includes only those police services who have consistently responded to the survey in order to allow for comparisons over time.
In the present study, data from the Québec City Police Service are excluded due to concerns about the data quality for the variable “most serious weapon present.” Analyses based on UCR2 also exclude data for the Saint John Police Service (SJPS). The Canadian Centre for Justice and Community Safety Statistics, in communication with the SJPS, made the decision to remove SJPS data from the 2016, 2017, 2018 and 2019 research files due to concerns with data quality in these years. As a result, SJPS data has also been removed from the microdata trend file which includes only those police services who have consistently reported data each year from 2009 to 2022.
Homicide Survey
The Homicide Survey collects police-reported data on the characteristics of all homicide incidents, victims and accused persons in Canada. The Homicide Survey began collecting information on all homicides in 1961.
Whenever a homicide becomes known to police, the investigating police service completes the survey questionnaires, which are then sent to Statistics Canada. There are cases where homicides become known to police months or years after they occurred. These incidents are counted in the year in which they become known to police. Information on persons accused of homicide are only available for solved incidents (i.e., where at least one accused has been identified). Accused characteristics are updated as homicide cases are solved and new information is submitted to the Homicide Survey.
Information collected through the victim and incident questionnaires are also updated accordingly as a result of a case being solved.
The Homicide Survey recently underwent a redesign to improve data quality and enhance relevance. Changes were made to existing questions and additional questions have been added for the 2019 reporting period.
Urban and rural regions
Rural police services are those where the majority of the population served lives outside of a census metropolitan area (CMA) or census agglomeration (CA). Urban police services are those where the majority of the population lives within a CMA or CA. A CMA or a CA is formed by one or more adjacent municipalities centered on a population centre (known as the core). A CMA requires a total population of at least 100,000 of which 50,000 or more must live in the core. A CA must have a core population of at least 10,000. To be included in the CMA or CA, other adjacent municipalities must have a high degree of integration with the core, as measured by commuting flows derived from previous census place of work data, where 50% or more of the population commutes into the core. It should be noted that information was not available for all police services to determine whether they were rural or urban.
Rural North and rural South: Rural North includes all rural police services in the Territories or in the Provincial North. Provincial North encompasses the northern regions of Newfoundland and Labrador, Quebec, Ontario, Manitoba, Saskatchewan, Alberta and British Columbia (North and South - Variant of Standard Geographical Classification 2021). Rural South refers to rural police services in the southern regions of these provinces as well as Prince Edward Island, Nova Scotia and New Brunswick. Of note, the Nunavik Police Service reports their data through the UCR1 Survey. As such, Quebec northern areas in this article refer to northern regions south of Nunavik.
Types of firearm
For the purposes of the UCR and the Homicide Survey, a firearm is any barrelled weapon from which any shot, bullet, or other missile can be discharged and is capable of causing serious bodily injury or death to a person. Different types of firearms are distinguished as such by the two surveys (presented in descending order of seriousness according to the hierarchy for determining most serious weapon):
- Fully automatic firearm: Any firearm that allows continuous and rapid firing of bullets with one pull of the trigger.
- Sawed-off rifle or shotgun: Any rifle or shotgun with a barrel length which has been altered to less than 457 millimetres, or with an overall weapon length of less than 660 millimetres.
- Handgun: Any firearm designed to be held and fired by the action of one hand.
- Rifle or shotgun: Any long-barrelled firearm with a barrel length greater than or equal to 457 millimetres, or with an overall length of 660 millimetres or more.
- Firearm-like weapon: Any weapon capable of propelling any object through a barrel by means of gunpowder, compressed carbon dioxide, pumped air, or any other means. Includes, for example, flare guns or pellet guns. For UCR data, this category also includes all unknown types of firearms.
References
Allen, M. & Perreault, S. (2015). Police-reported crime in Canada’s Provincial North and Territories, 2013. Juristat. Statistics Canada catalogue no. 85-002-X.
Canadian Border Services Agency. (2023, June 21). CBSA takes part in national operation to combat 3D printed guns. News Release.
Canadian Centre for Justice Statistics. (2018). Revising the classification of founded and unfounded criminal incidents in the Uniform Crime Reporting Survey. Juristat. Statistics Canada catalogue no. 85-002-X.
Cotter, A. (2021). Criminal victimization in Canada, 2019. Juristat. Statistics Canada catalogue no. 85-002-X.
Glasser, N. J., Pollack, H. A., Ranney, M. L., & Betz, M. E. (2022). Economics and Public Health: Two Perspectives on Firearm Injury Prevention. The ANNALS of the American Academy of Political and Social Science, 704(1), 44-69.
Holloway, K., Cahill, G., Tieu, T., & Njoroge, W. (2023). Reviewing the literature on the impact of gun violence on early childhood development. Current Psychiatry Reports, 1-9.
Hotton Mahony, T. & Turner, J. (2012). Police-reported clearance rates in Canada, 2010. Juristat. Statistics Canada catalogue no. 85-002-X.
Irvin-Erickson, Y., Lynch, M., Gurvis, A., Mohr, E., & Bai, B. (2017). Gun violence affects the economic health of communities. Washington, DC: The Urban Institute,151(1).
Mauro, E. & Mancini, M. (2023, January 10). Untraceable 3D-printed ’ghost guns’ on the rise in Canada. Canadian Broadcasting Corporation News.
Moreau, G. (2019). Police-reported crime statistics in Canada, 2018. Juristat. Statistics Canada catalogue no. 85-002-X.
Moreau, G. (2022). Police-reported crime statistics in Canada, 2021. Juristat. Statistics Canada catalogue no. 85-002-X.
National Centre for Truth and Reconciliation. (2015). Honouring the truth, reconciling for the future: Summary of the final report of the truth and reconciliation commission of Canada.
National Inquiry into Missing and Murdered Indigenous Women and Girls.(2019). Reclaiming Power and Place: The Final Report of the National Inquiry into Missing and Murdered Indigenous Women and Girls.
Paré, P. P., Felson, R. B., & Ouimet, M. (2007). Community variation in crime clearance: A multilevel analysis with comments on assessing police performance. Journal of Quantitative Criminology, 23, 243-258.
Perreault, S. (2019). Police-reported crime in rural and urban areas in the Canadian provinces, 2017. Juristat. Statistics Canada catalogue no. 85-002-X.
Perreault, S. (2023). Police-reported crime in rural and urban areas in the Canadian provinces, 2021. Juristat. Statistics Canada catalogue no. 85-002-X.
Public Safety Canada. (2021, December 2). Gun and Gang Violence.
Public Safety Canada. (2023, November 3). Firearms.
Royal Canadian Mounted Police. (2023, September 19). RCMP warn the public of the dangers of 3D printed firearms.
Statistics Canada (2023, July 27). Police-reported crime statistics in Canada, 2022. The Daily.
Statistics Canada. (2023, November 29). Homicide Trends in Canada, 2022. The Daily.
Turner, H. A., Mitchell, K. J., Jones, L. M., Hamby, S., Wade Jr, R., & Beseler, C. L. (2019). Gun violence exposure and posttraumatic symptoms among children and youth. Journal of Traumatic Stress, 32(6), 881-889.
- Date modified: