
Adult and youth correctional statistics in Canada, 2018/2019

Archived Content
Information identified as archived is provided for reference, research or recordkeeping purposes. It is not subject to the Government of Canada Web Standards and has not been altered or updated since it was archived. Please "contact us" to request a format other than those available.
by Jamil Malakieh, Canadian Centre for Justice and Community Safety Statistics
In Canada, the administration of correctional services is a shared responsibility between the federal, provincial and territorial governments. The Correctional Service of Canada is responsible for the federal system and has jurisdiction over adults (aged 18 years and older) serving custodial sentences of two years or more, and it is responsible for supervising adults on conditional release in the community.Note Adults serving custodial sentences less than two years and those held while awaiting trial or sentencing, as well as those serving community sentences, fall under the purview of provincial and territorial correctional services programs. For youth, provinces and territories are responsible for administering correctional services for both custody and community sentences, including youth who are held while awaiting trial or sentencing.
This Juristat article provides an overview of adult and youth correctional services in Canada in 2018/2019.Note The use of correctional services is described using three measures: average counts, admissions and, for youth, initial entries. Average counts provide a snapshot of the correctional population and represent the number of adults and youth in custody or under community supervision on any given day. Admissions are counted each time an individual begins or moves to a new type of custody or community supervision over the fiscal year; the same person can be included numerous times in the admissions count, as they move from one type of supervision to another. As such, the count of admissions provides an important indicator of the flow of persons through the correctional system for a given year. Initial entries represent the number of youth entering the correctional system for a period of supervision (for additional information see Text box 1).
This report serves as a summary of the current state of correctional services in Canada. Populations and movements of persons within correctional services are explored in order to quantify changes in workload over time. This article also provides information regarding the characteristics of persons admitted to identify populations that are overrepresented in the correctional system. Statistics Canada will also be releasing a special topic Juristat at a later date focused on the overrepresentation of Indigenous persons under correctional supervision using new robust data from the Canadian Correctional Services Survey (CCSS), which will allow for the production of detailed population-based indicators.
Adult correctional services
Adult incarceration rate continues to decline
The adult incarceration rate represents the average number of adults in custody per day for every 100,000 individuals in the adult population (aged 18 years and older). It includes adults in sentenced custody, remand and other temporary detention.
- In 2018/2019, the national incarceration rate was 127 adults per 100,000 population, this was 4% below the rate from the previous year (Table 1). There was an average of 37,854 adults in provincial/territorial and federal custody per day; of this number, 23,783 adults were in provincial/territorial custody (a rate of 80 adults per 100,000 population) and 14,071 were in federal custody (a rate of 47 adults per 100,000 population).
- The national incarceration rate has declined annually for the last four years.Note Between 2017/2018 and 2018/2019, the incarceration rate decreased in 8 of the 13 reporting provinces and territories.Note Meanwhile, rates increased in Prince Edward Island (+13%), Yukon (+10%), Nunavut (+4%), the Northwest Territories (+3%) and Saskatchewan (+1%) (Table 1).
- In 2018/2019, the four provinces that had rates higher than the average adult provincial/territorial incarceration rate were Saskatchewan (215 adults per 100,000), Manitoba (201 adults per 100,000 population), Alberta (108 adults per 100,000), and Prince Edward Island (82 adults per 100,000) (Table 1). Despite having among the highest incarceration rates of the provinces, Manitoba and Alberta saw a decrease in their incarceration rate between 2017/2018 and 2018/2019. SixNote of the 13 reporting provinces and territories had an incarceration rate lower than the average provincial/territorial rate of 80 adults per 100,000 population.
- The incarceration rate in all three territories was well above the provincial/territorial average (80 adults per 100,000 population) in 2018/2019, with Yukon at 206 adults per 100,000 population, the Northwest Territories at 534 per 100,000 and Nunavut at 667 per 100,000 (Table 1). The relatively small populations in the territories leads to unstable rates, therefore comparisons between jurisdictions should be made with caution.
Changes in federal and provincial/territorial custodial populations during the COVID-19 pandemic
- While balancing public safety concerns, reducing the number of persons held in correctional institutions is seen as a preventive measure to reducing public health risk associated with COVID-19 transmission.
- In response to the need for information on the impact of COVID-19 on the custodial population in Canada, Statistics Canada has undertaken more frequent collection of average daily counts of adults in federal and provincial/territorial custody. At the time of this report, additional monthly data for April to June 2020 are available. Two reports have been produced by Statistics Canada, looking at changes in counts between February and April 2020 and an update on changes between May and June 2020 (Statistics Canada 2020a; Statistics Canada 2020b).
- In February 2020, there was an average of 37,976 adults in federal and provincial/territorial custody on any given day. In March, when the COVID-19 pandemic was declared mid-month, there were 3% fewer people in custody across Canada and by May, the count was down 19% from February to 30,795. In June, the average daily count declined slightly (-1%) from the previous month. Historically, monthly changes in counts are rarely more than 1%.
- The average count of adults in federal custody declined from 13,891 in February to 13,141 in June 2020, an overall decline of 5%.
- The average count of adults in provincial/territorial custody fell from February to May 2020, from 24,085 adults to 17,320, a 28% decline. Most of this decrease occurred from March to April (-21%) with smaller declines from February to March (-4%) and April to May (-4%). However, from May to June 2020, the count of adults in provincial/territorial custody increased slightly (+1%) to 17,439 people.
Adults in remand outnumber those in sentenced custody in the provinces and territories
- Since 2004/2005, the average number of adults in the remand population (awaiting trial or sentencing) in provincial/territorial correctional services has been greater than the adult sentenced custody population (Correctional Services Program 2017).
- In 2018/2019, there was 70% more adults in remand on an average day than in sentenced custody (14,778 versus 8,708) in the provinces and territories (Table 2). Having a high number of adults in remand can lead to various challenges associated with providing services to inmates—such as housing and rehabilitation—due to the uncertainty regarding their length of stay (John Howard Society of Ontario 2007).
- Among 10 of the 13 provinces and territories in 2018/2019, the adult remand population accounted for more than half of all adults in custody (those in remand and sentenced custody combined). These included Ontario (72% of adults in remand), Nova Scotia (71%), Alberta (71%), Yukon (70%), Manitoba (68%), British Columbia (67%), Nunavut (56%), the Northwest Territories (54%), New Brunswick (53%) and Saskatchewan (51%). The inverse was true for Newfoundland and Labrador (46%), Quebec (45%) and Prince Edward Island (29%), where remand accounted for the minority of adults in custody (Chart 1).
- In 2018/2019, the rate of adults in remand (49 adults per 100,000 population) decreased slightly from the previous year (2% decline), while the rate of adults in sentenced custody (29 adults per 100,000 population) decreased by 10%. The rate of adults in remand decreased in 6 of the 13 reporting provinces and territories,Note with the greatest decrease in Manitoba (-14%). Yukon and Prince Edward Island had the largest increases in the rate of remand with 25% and 22%, respectively (Table 2).
- In 2018/2019, the rate of adults in sentenced custody decreased compared to the previous year in 10 of the 13 reporting provinces and territories,Note with the greatest decrease in Nova Scotia (-20%). Meanwhile, the Northwest Territories (+13%), Prince Edward Island (+10%) and Nunavut (+3%) saw increases between 2017/2018 and 2018/2019 (Table 2).
- The rate of adults in federal sentenced custody (47 adults per 100,000 population) decreased 2% compared to 2018/2019 (Table 2).
Most adults continue to be supervised in the community
- In 2018/2019, in the 10 reporting provinces and territories,Note there was an average of 89,838 adults under supervision through community programs such as probation, conditional sentences and provincial parole, representing almost 80% of the provincial/territorial correctional population. At the federal level, the Correctional Service of Canada supervised an average of 9,278 adults per day on day parole, full parole, statutory release and long term supervision, representing 40% of the federal correctional population (Table 1).
- Community sentences are used to allow convicted persons access to community resources, giving them the opportunity to deal with their underlying criminogenic needs while ensuring proper oversight and accountability (Klingele 2013).
- In 2018/2019, the rate of adults under community supervisionNote in the provinces and territories was 321 adults per 100,000 population. This represented a decrease of 6% from the previous year. The rate of federal offenders under community supervision was largely unchanged (1% increase) from the previous year, with a rate of 31 adults per 100,000 population in 2018/2019 (Table 1).
- In provincial/territorial correctional services, probation was by far the most common supervision program. On average, there were 82,500 adults on probation on any given day in 2018/2019. This represented 92%Note of the population under community supervision and 73%Note of all adults under correctional supervision in the 10 reporting provinces and territories (Table 2).Note
- In 2018/2019, the rate of adults on probation (294 adults per 100,000 population) decreased by 6% compared to 2017/2018 (Table 2). The rate decreased in seven of the nine reporting jurisdictions while increases were seen in Nunavut (+13%) and the Northwest Territories (+8%) (Table 2).Note
Admissions to adult correctional services decrease
An admission is counted each time an individual begins any type of custody or community supervision program and is therefore a measure of activity within the correctional services programs. The same person may be included several times in the admission counts when they move from one correctional program to another (e.g., from remand to sentenced custody) or re-enters the system in the fiscal period. This provides an indication of the client workload of various programs within correctional services.
- In 2018/2019, there were a total of 383,369 admissions to adult correctional services, with 368,821 admissions to provincial/territorial corrections and 14,548 admissions to federal corrections. Overall, the total number of admissions was down 6% compared to the previous year (Table 3). This change was driven by a decrease in provincial/territorial admissions to custody and community services (-6%), while federal admissions increased 1% in 2018/2019.
- In 2018/2019, admissions to custody decreased 7% in the provinces and territories, and admissions to community supervision decreased 5%. Admissions to correctional services overall decreased in 9 of the 13 jurisdictionsNote with Nova Scotia recording the largest decrease (-18%). In contrast, Nunavut recorded the largest increase (+32%) which was driven by a large increase (+50%) in custody admissions since the previous year (Table 3).
- At the federal level, admissions to custody increased by 3% while admissions to community supervision decreased by 2% (Table 3).
Adults who identify as First Nations, Métis or Inuit are overrepresented in admissions to custody
- In 2018/2019, IndigenousNote adults accounted for 31% of admissions to provincial/territorial custody and 29% of admissions to federal custody, while representing approximately 4.5% of the Canadian adult population.Note These proportions were virtually unchanged from the previous year.
- The Gladue sentencing principle seeks to recognize and address the overrepresentation of Indigenous persons in custody. Section 718.2 of the Criminal Code, as well as the Supreme Court of Canada in R v. Gladue (1999), instructs judges that sentences should consider all available sanctions other than imprisonment with particular attention to and recognition of the adverse background of Indigenous offenders in historical context (Legal Services Society 2018).Note
- Among the provinces in 2018/2019, Indigenous adults represented three-quarters of admissions to custody in Manitoba (75%) and Saskatchewan (75%). According to Census projections, the highest proportion of Indigenous adults live in these two provinces, representing 16% of the population in Manitoba and 14% of the population in Saskatchewan.Note
- In the provinces and territories in 2018/2019, Indigenous females accounted for 42% of female custody admissions, while Indigenous males accounted for 28% of male custody admissions (Table 4).
- Overall, in 2018/2019, the number of adult admissions of Indigenous males decreased 6% while admissions of non-Indigenous males decreased 7% in the provinces and territories compared with the previous year. Admissions of Indigenous females decreased 8% while admissions of non-Indigenous females decreased 6% (Table 4).
- In federal corrections, Indigenous males accounted for 29% of male admissions to custody whereas Indigenous females represented 41% of female admissions to custody. Compared to 2017/2018, admissions to federal corrections increased for both Indigenous males (+6%) and Indigenous females (+4%) (Table 4).
Younger male adults are overrepresented in custody admissions
- In 2018/2019, males accounted for 85% of adult admissions to provincial/territorial custody and 93% of adult admissions to federal custody (Chart 2; Chart 3).
- Overall, males aged 20 to 39 years accounted for over one-half of admissions to provincial/territorial (58%) and federal (61%) custody in 2018/2019, while representing 17% of the adult population aged 18 years and olderNote (Chart 2; Chart 3). In comparison, police data show similar overrepresentation of males of the same age, with this group accounting for half (51%) of adults charged by police in 2018.Note
- Compared to their male counterparts, females aged 20 to 39 years accounted for a much smaller proportion of custodial admissions in 2018/2019 (11% of provincial/territorial and 5% of federal), while representing 17% of the adult population aged 18 years and olderNote (Chart 2; Chart 3). Females aged 20 to 39 years who were charged by police in 2018 accounted for about one-sixth (15%) of all adults charged.Note
Majority of adults in provincial and territorial custody stay less than 30 days
- In 2018/2019, in the 11 reporting provinces and territories, nearly two in three (60%) adults in sentenced custody had a length of stay of one month or less, while one in three (30%) had a length of stay of one week or less.
- For adults released from remand, three-quarters (75%) were held for one month or less while just over half (50%) were held for one week or less.Note
- Females tend to spend less time in remand and sentenced custody than their male counterparts. In 2018/2019, 82% of females released from remand were held for one month or less compared to 73% of males. For sentenced custody, 68% of females were held for one month or less compared to 58% of males (Chart 4).
Operating expenditures increase in adult correctional services
- In 2018/2019, after adjusting for inflation, operating expenditures for adult correctional services in Canada totaled over $5 billion,Note a 1% decrease from the previous year but a 4% increase from five years prior (Table 5).
- Per capita expenditures were $74 for provincial/territorial correctional services and $65 for federal correctional services (Table 5).Note
- Custodial services expenditures totaled over $2.2 billion accounting for 82% of correctional expenditures from reporting provinces and territoriesNote in 2018/2019 (Table 5). Meanwhile, community supervision expenditures totaled almost $380 million,Note accounting for 14% of total expenditures (Table 5).
- The costs for keeping adults in custody are typically higher for the federal system. On average, in 2018/2019, custodial services expenditures amounted to around $318 per day per federal offender, or $116,070 annually, compared to $259Note per day per provincial/territorial offender, or $94,535 annually (Table 5).
Youth correctional services
In Canada, the Youth Criminal Justice Act (YCJA), enacted in 2003, is the legislation that governs how youth aged 12 to 17 years are dealt with by the Canadian justice system. The YCJA provides for a separate youth justice system based on the principle of diminished moral blameworthiness or culpability of youth.
Youth incarceration rate continues to decline
- In 2018/2019, there were a total of 716 youth in custody on average per day in the 12 reporting jurisdictions,Note representing a national incarceration rate of 4 youth per 10,000 population, a 10% decrease from the previous year and a 32% decrease from 2014/2015 (Table 6).Note
- In 2018/2019, the youth incarceration rate fell from the previous year in 9 of the 12Note reporting jurisdictions. Among the provinces, the largest declines were seen in Nova Scotia (-43%), followed by Prince Edward Island (-37%) and British Columbia (-35%) (Table 6).
- In 2018/2019, youth incarceration rates were highest in Manitoba (16 youth per 10,000 population), Saskatchewan (14), Nunavut (11) and the Northwest Territories (10). In each of the remaining jurisdictions, the incarceration rate was less than the national rate of 4 youth per 10,000 population (Table 6).
Rate of youth in the correctional system continues to decline
- In 2018/2019, on average per day, there were 6,401 youth in custody or a supervised community program in the 10 reporting jurisdictions.Note This represented a rate of 36 youth per 10,000 population, a 10% decrease from the previous year and a 32% decrease from 2014/2015 (Table 6).
- Youth in custody (716 youth on average per day) accounted for 11% of the average correctional population whereas youth under community supervision (5,713 youth on average per day) accounted for 89% of the average population supervised in the community in 2018/2019 (Table 6).
- In 2018/2019, the rate of youth in custody was 4 youth per 10,000 population in the 12 reporting jurisdictions,Note a 10% decrease compared to the previous year. The rate of youth under community supervision was 32 youth per 10,000 population in the 10 reporting jurisdictions, a 10% decrease from 2017/2018 (Table 6).
- SevenNote of the 10 reporting jurisdictions noted a decline in the overall youth correctional services rate between 2017/2018 and 2018/2019. Newfoundland and Labrador (-17%), Saskatchewan (-17%), Prince Edward Island (-16%) and Manitoba (-15%) had the largest decreases among the provinces (Table 6).
- The national rate of youth charged by police has also decreased in recent years, with a 21% decrease between 2013 and 2017 (Allen 2018).Note
- As with previous years, the vast majority (89%) of youth in the correctional population in the 10 reporting jurisdictionsNote were under community supervision on an average day in 2018/2019 (Table 6).
Majority of youth enter correctional services under community supervision
Initial entry measures the number of youth commencing an uninterrupted period of correctional supervision, which may include custody, community supervision or both. Under the YCJA, the youth criminal justice system supports reintegration and rehabilitation by referring young persons to community programs or agencies when appropriate to address offending behaviour.
- In 2018/2019, nearly three in four (72%) youth entered correctional services under community supervision in the reporting jurisdictions,Note a decrease of 10% from the previous year. These youth were primarily entering a period of probation (47% of all initial entries) or other community supervision (23% of all initial entries)—which includes bail (supervised in Saskatchewan and British Columbia), non-residential programs, fine options, orders for restitution, compensation or other community or personal services, and other sentences deemed appropriate by the youth justice court (Table 7).
- The remaining 28% of initial entries for youth in the reporting jurisdictionsNote in 2018/2019 were to custody (predominantly pre-trial detention, at 26% of all initial entries). This represented a decrease in admissions to custody of 18% from the previous year and a 30% decrease from five years prior (Table 7).
Youth admissions to correctional services declined
In contrast to initial entries, which measures an uninterrupted period of correctional supervision, admissions are counted each time a person begins any period of supervision in a correctional institution or in the community. The same person may be included several times in the admission counts when moving from one correctional program to another (e.g., from remand or pre-trial detention to sentenced custody) or re-enters the system later in the same year.
- In 2018/2019, the number of youth admissions to correctional services among the 11 reporting jurisdictions totalled 14,578.Note This was a decrease of 15% compared to 2017/2018. Admissions to community supervision decreased by 12% while admissions to custody decreased by 20% between 2017/2018 and 2018/2019 (Table 8).
- In 2018/2019, there were decreases in total youth admissions in all 11 reporting jurisdictions compared to the previous year.Note Among the provinces, Manitoba (-25%), Nova Scotia (-24%), Prince Edward Island (-19%) and Newfoundland and Labrador (-16%) had large decreases in the number of admissions to correctional services compared to 2017/2018 (Table 8).
- Among the territories, Yukon had the largest decrease in total admissions (-49%) in 2018/2019 (Table 8). The relatively small youth population in the territories may lead to unstable rates, therefore comparisons between jurisdictions should be made with caution.
Indigenous youth continue to be overrepresented in the correctional system
- In 2018, Indigenous youth represented 8.8% of the youth population in Canada. Meanwhile, Indigenous youth represented 43% of youth admissions to correctional services in 2018/2019 (Table 9).Note
- The YCJA states that measures taken against young persons who commit offences should respond to the particular vulnerabilities of Indigenous youth. This provision for youth emphasizes meaningful consequences by way of rehabilitation and reintegration to reduce the overrepresentation of Indigenous youth in custody.
- Indigenous youth are overrepresented in both custody and community supervision, representing 47% of custody admissions and 40% of community admissions in 2018/2019 in the reporting jurisdictions (Table 9).
Males and older youth account for the majority of youth admissions
- In 2018/2019 in the reporting provinces and territories,Note over three-quarters (77%) of youth admitted into correctional services were male. Among youth admissions, males accounted for 79% of custody admissions and 77% of community supervision admissions (Table 9). These proportions were virtually unchanged from 2017/2018.
- The majority (53%) of youth admissions to correctional services in 2018/2019 involved youth aged 16 to 17 at the time of admission. Youth of this age range accounted for an even larger proportion of custody admissions (59%), while they represented just under half (48%) of community admissions (Table 9).
- In 2018/2019, males aged 16 to 17 years accounted for 41% of total youth admissions to correctional services. In comparison, females of the same age group represented 11% of youth admissions (Chart 5).
Start of text box 1
Text box 1
Surveys, concepts and coverage
Average counts provide a snapshot of the adult or youth corrections population and represent the number of youth or adults in custody or under community supervision on any given day. Usually, corrections officials perform daily counts of persons in their facilities and month-end counts of those under community supervision. These are used to calculate the annual average daily custody and community counts used in this article.
Initial entry represents the first point at which a youth commences an uninterrupted period of supervision in the correctional system. Each person is counted only once during their period of involvement with correctional services, regardless of subsequent changes in legal status. Initial entry provides an indication of new workload entering correctional services.
Admissions are counted each time a person begins any period of supervision in a correctional institution or in the community. These data describe and measure the flow of persons through correctional services over time. The same person may be included several times in the admission counts where they move from one correctional program to another (e.g., from remand or pre-trial detention to sentenced custody) or re-enters the system later in the same year. Admissions therefore represent the number of entries of persons during a fiscal year to pre-trial detention, sentenced custody or a community supervision program, regardless of the previous legal status.
The adult incarceration rate represents the average number of adults (aged 18 years and older) in custody per day for every 100,000 individuals in the adult population. It includes adults in sentenced custody, remand and other temporary detention.
The youth incarceration rate represents the average number of youth (aged 12 to 17 years) in secure or open custody per day for every 10,000 individuals in the youth population. It includes youth in sentenced custody, youth in Provincial Director Remand being held following the breach of a community supervision condition, youth in pre-trial detention awaiting trial or sentencing, and youth in other temporary detention.
Changes in rates are calculated using unrounded numbers and therefore may not be equivalent to the change of the presented figures.
Jurisdictions excluded from particular analyses due to non-reporting are noted throughout the article. The provinces and territories that did not report complete data for 2018/2019 are as follows:
Adult
- Average counts data exclude Newfoundland and Labrador, Nova Scotia and New Brunswick for community supervision.
Youth
- Average counts, initial entries and admissions data exclude Quebec.
- Average counts data exclude Nova Scotia and New Brunswick (community supervision and total correctional services).
- Initial entry data exclude Quebec, Manitoba, Alberta, Yukon and Prince Edward Island (community supervisions).
- Admissions data exclude Quebec and Alberta.
These data are administrative and jurisdictions are asked to provide data in a standardized way following certain definitions; however, limitations due to differences in jurisdictional operations can restrict uniform application of the definitions in some situations. Therefore, caution is required when making comparisons between jurisdictions.
It should be noted that some of the jurisdictional counts presented in this analysis, particularly those for youth in custody, are small. As a result, small changes in the counts can lead to large year-over-year percentage changes.
End of text box 1
Charts
Chart 1 start

Data table for Chart 1
| Provinces and territories | |||||||||||||
|---|---|---|---|---|---|---|---|---|---|---|---|---|---|
| Ont. | N.S. | Alta. | Y.T. | Man. | B.C. | Nvt. | N.W.T | N.B. | Sask. | N.L. | Que. | P.E.I. | |
| Percent of average daily counts | |||||||||||||
| Remand | 72 | 71 | 71 | 70 | 68 | 67 | 56 | 54 | 53 | 51 | 46 | 45 | 29 |
| Sentenced custodyData table Note 1 | 28 | 29 | 29 | 30 | 32 | 33 | 44 | 46 | 47 | 49 | 54 | 55 | 71 |
Source: Statistics Canada, Canadian Centre for Justice and Community Safety Statistics, Adult Corrections Key Indicator Report. |
|||||||||||||
Chart 1 end
Chart 2 start

Data table for Chart 2
| Age group (years) | ||||||||
|---|---|---|---|---|---|---|---|---|
| 18 to 19 | 20 to 24 | 25 to 29 | 30 to 34 | 35 to 39 | 40 to 44 | 45 to 49 | 50 and older | |
| percent | ||||||||
| Male | 3 | 13 | 16 | 16 | 13 | 9 | 6 | 10 |
| Female | 1 | 2 | 3 | 3 | 2 | 1 | 1 | 1 |
|
Note: Additional data are available on Statistics Canada tables 35-10-0015 and 35-10-0017. Age represents the age of the person at the time of admission. Admissions for Canadian Centre for Justice and Community Safety Statistics surveys are counted each time a person begins any period of supervision in a correctional institution or in the community. These data describe and measure the flow of persons through correctional services over time. The same person may be included several times in the admission counts where he/she moves from one correctional program to another (e.g., from remand to sentenced custody) or re-enters the system later in the same year. Excludes admissions of unknown sex or age. Source: Statistics Canada, Canadian Centre for Justice and Community Safety Statistics, Adult Correctional Services Survey, Integrated Correctional Services Survey and Canadian Correctional Services Survey. |
||||||||
Chart 2 end
Chart 3 start

Data table for Chart 3
| Age group (years) | ||||||||
|---|---|---|---|---|---|---|---|---|
| 18 to 19 | 20 to 24 | 25 to 29 | 30 to 34 | 35 to 39 | 40 to 44 | 45 to 49 | 50 and older | |
| percent | ||||||||
| Male | 1 | 12 | 19 | 17 | 13 | 10 | 7 | 14 |
| Female | 0 | 1 | 2 | 1 | 1 | 1 | 1 | 1 |
|
Note: Additional data are available on Statistics Canada table 35-10-0022. Age represents the age of the person at the time of admission. Excludes admissions of unknown sex or age. Source: Statistics Canada, Canadian Centre for Justice and Community Safety Statistics, Adult Correctional Services Survey, Integrated Correctional Services Survey and Canadian Correctional Services Survey. |
||||||||
Chart 3 end
Chart 4 start

Data table for Chart 4
| Time served | Type of custody and sex | |||
|---|---|---|---|---|
| Sentenced custody males | Sentenced custody females | Remand males | Remand females | |
| percent | ||||
| 1 week or less | 29 | 37 | 49 | 57 |
| Greater than 1 week to 1 month | 29 | 31 | 24 | 25 |
| Greater than 1 month to 6 months | 31 | 27 | 22 | 16 |
| More than 6 months | 10 | 5 | 5 | 2 |
|
Note: Excludes Alberta and British Columbia due to the unavailability of data. Releases of unknown length of stay are excluded. Additional data are available on Statistics Canada table 35-10-0024. Source: Statistics Canada, Canadian Centre for Justice and Community Safety Statistics, Adult Correctional Services Survey, Integrated Correctional Services Survey and Canadian Correctional Services Survey. |
||||
Chart 4 end
Chart 5 start
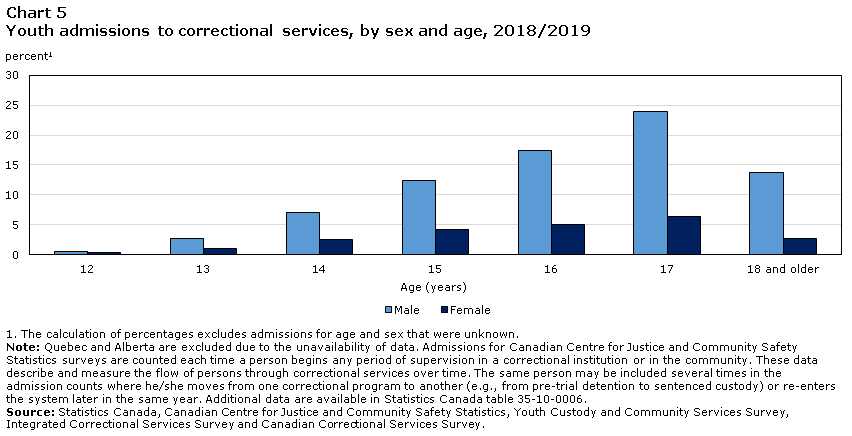
Data table for Chart 5
| Age (years) | |||||||
|---|---|---|---|---|---|---|---|
| 12 | 13 | 14 | 15 | 16 | 17 | 18 and older | |
| percentData table Note 1 | |||||||
| Male | 1 | 3 | 7 | 12 | 17 | 24 | 14 |
| Female | 0 | 1 | 3 | 4 | 5 | 6 | 3 |
Source: Statistics Canada, Canadian Centre for Justice and Community Safety Statistics, Youth Custody and Community Services Survey, Integrated Correctional Services Survey and Canadian Correctional Services Survey. |
|||||||
Chart 5 end
Detailed data tables
Table 4 Admissions to adult custody, by sex and by Indigenous identity and jurisdiction, 2018/2019
Table 5 Operating expenditures of the adult correctional system, by jurisdiction, 2018/2019
Key terminology and definitions
Community portion of custody sentence: This is the portion of the young person’s custody sentence (intensive rehabilitative custody and conditional supervision, custody and conditional supervision, or custody and community supervision) that must be served in the community under supervision. The Youth Criminal Justice Act stipulates that the final one-third of most custody sentences shall be served under community supervision.
Conditional sentences: This is an adult sentencing option where the person is given a conditional sentence of imprisonment that is served in the community. According to the terms of the conditional sentence, the offender will serve the term of imprisonment in the community provided that they abide by conditions imposed by the court as part of the conditional sentence order. If the offender violates these conditions, they may be sent to prison to serve the balance of that sentence.
Deferred custody and supervision: Similar to a conditional sentence with adult sentencing, deferred custody is a community-based alternative to a custodial sentence for youth. Under a deferred custody order, the young person will serve their sentence in the community under a set of strict conditions. If these conditions are not followed, the young person may be sent to custody to serve the balance of that sentence.
Intensive support and supervision: Similar to probation, an intensive support and supervision order is a youth sentencing option that is served in the community under conditions, but provides closer monitoring and support than a probation order to assist the young person in changing their behaviour. This is an “opt-in” sanction under the Youth Criminal Justice Act, meaning that provinces and territories may choose not to implement this option.
Intermittent sentences: This refers to an adult sentence to custody which is to be served periodically over an extended period of time (e.g., weekend only or select days of the week).
Pre-trial detention: This is the temporary detention of a youth in custody, while awaiting trial or sentencing.
Probation: A common type of community-based sentence, where the young person or adult is placed under the supervision of a probation officer or other designated person. There are mandatory conditions (e.g., keep the peace) and there may be optional conditions that are put in place for the duration of the probation order.
Provincial Director Remand: When a young person is serving the community portion of a custody and supervision order or a deferred custody and supervision order, and the provincial director has reasonable grounds to believe that the young person has breached, or is about to breach, a condition of the young person’s conditional supervision, the provincial director may issue a warrant of apprehension to suspend the conditional supervision and remand the young person in an appropriate youth facility.
Remand: Remand is the detention of an adult temporarily in custody, while awaiting trial or sentencing.
Sentenced custody (youth): Youth being held in sentenced custody can be held in secure or open facilities.
- Secure custody: A facility is considered “secure” when youth offenders are detained by security devices, including those facilities which operate with full perimeter security features and/or where youth are under constant observation. The extent to which facilities are “secure” varies across jurisdictions.
- Open custody: A facility is considered “open” when there is minimal use of security devices or perimeter security. The extent to which facilities are “open” varies across jurisdictions. Open custody facilities include community residential centres, group homes, childcare institutions, forest or wilderness camps, etc.
Survey description
The Adult Correctional Services Survey (ACS) collects aggregate data on the number and characteristics (e.g., sex, age group, Indigenous identity, length of time served) of admissions to and releases from adult correctional services. The following jurisdictions responded to the ACS in 2018/2019: Prince Edward Island, Quebec, Manitoba, Yukon, the Northwest Territories and Nunavut.
The Adult Corrections Key Indicator Report (CKIR-A) collects aggregate data on average daily custody counts and month-end supervised community corrections counts in the provincial/territorial and federal adult systems. The following exclusions are noted for historical data: Newfoundland and Labrador (2009/2010 for data on community supervision), Prince Edward Island (2005/2006), Nova Scotia (2006/2007 to 2015/2016 for data on community supervision), Alberta (2013/2014 all data and 2014/2015 for data on community supervision) and the Northwest Territories (2003/2004 to 2007/2008 for data on community supervision). The following jurisdictions responded to the CKIR-A in 2018/2019: Prince Edward Island, Nova Scotia, New Brunswick, Quebec, Ontario, Manitoba, Alberta, Yukon, the Northwest Territories and Nunavut.
The Youth Corrections Key Indicator Report (CKIR-Y) collects aggregate data on average daily custody counts and month-end supervised community corrections counts for youth under correctional supervision. The following exclusions are noted for historical data: Prince Edward Island (2005/2006 for data on community supervision), Nova Scotia (2006/2007 to 2015/2016 for data on community supervision), New Brunswick (2004/2005 to 2015/2016 for data on community supervision), Quebec (2011/2012 to 2015/2016), Alberta (2013/2014 for data on both custody and community supervision and 2014/2015 for data on community supervision) and the Northwest Territories (2004/2005 to 2007/2008 for data on community supervision). The following jurisdictions responded to the CKIR-Y in 2018/2019: Prince Edward Island, Nova Scotia, New Brunswick, Ontario, Manitoba, Alberta, Yukon, the Northwest Territories and Nunavut.
The Youth Custody and Community Services Survey (YCCS) collects aggregate data on the number and characteristics (e.g., sex, age, Indigenous identity) of youth admissions to and releases from correctional services. The following jurisdictions reported survey data in 2018/2019: Prince Edward Island, Manitoba, Yukon, the Northwest Territories and Nunavut.
The Integrated Correctional Services Survey (ICSS) collects microdata on adults and youth under the responsibility of the federal and provincial/territorial correctional systems. Data include socio-demographic characteristics (e.g., sex, age, Indigenous identity) as well as information pertaining to correctional supervision, including admissions and releases by legal hold status (e.g., remand, sentenced, probation). The following jurisdictions responded to the ICSS in 2018/2019: Newfoundland and Labrador (adults only), New Brunswick, Ontario and the Correctional Service of Canada.
The Canadian Correctional Services Survey (CCSS) was designed as a replacement for the ICSS. It also collects microdata on adults and youth under the responsibility of the federal and provincial/territorial correctional systems. Data include socio-demographic characteristics (e.g., age, Indigenous identity) as well as information pertaining to correctional supervision, including admissions and releases by legal hold status (e.g., remand, sentenced, probation). The following jurisdictions responded to the CCSS in 2018/2019: Newfoundland and Labrador (youth only), Nova Scotia, Saskatchewan, Alberta (adult only) and British Columbia.
References
Allen, M. 2018. “Police-reported crime statistics, 2017.” Juristat. Statistics Canada Catalogue no. 85-002-X.
Chartrand, L., and K. Horn. 2016. A Report on the Relationship between Restorative Justice and Indigenous Legal Traditions in Canada. The Department of Justice Canada. (accessed January 15, 2020).
Correctional Services Program. 2017. “Trends in the use of remand in Canada, 2004/2005 to 2014/2015.” Juristat. Statistics Canada Catalogue no. 85-002-X.
Criminal Code of Canada. RSC, 1985, c. C-46. (Current to December 12, 2018).
John Howard Society of Ontario. 2007. “Remand in Ontario. Second report to the Board, Standing Committee on Prison Conditions in Ontario.” John Howard Society of Ontario. (accessed January 15, 2020).
Klingele, C.. 2013. “Rethinking the use of community supervision.” Journal of Criminal Law and Criminology. Vol. 103, No. 4. (accessed January 15, 2020).
Legal Services Society. 2018. Gladue Report Guide. Legal Services Society of British Columbia.
R v. Gladue. 1999. SCC 26300, [1999] 1 S.C.R. 688.
Rudin, J. 2005. “Aboriginal Peoples and the Criminal Justice System.”‖Ipperwash Inquiry. (accessed January 15, 2020).
Statistics Canada 2020a. “Changes in federal, provincial and territorial custodial populations during the COVID-19 pandemic, April 2019 to April 2020. August 12, 2020.” The Daily.
Statistics Canada 2020b. “After three months of unprecedented declines, monthly decreases in the adult custodial population in Canada slowed in June. October 27, 2020.” The Daily.
Youth Criminal Justice Act. YCJA. 2003. Parliament of Canada. c .1, section 3(1).
- Date modified: