
Section 2: Police-reported intimate partner violence in Canada, 2017
by Marta Burczycka
Eight in ten victims of police-reported intimate partner violence were female
- Intimate partner violence (IPV) includes violent offences that occur between current and former legally married spouses, common-law partners, dating partners and other kinds of intimate partners.Note In 2017, IPV represented close to one-third (30%) of all police-reported violent crime in Canada, affecting almost 96,000 victims aged 15 to 89.Note Note In comparison, 33% of violent crime victims had been subjected to violence by a person they knew other than an intimate partner or family member, and 26% had been victimized by a stranger (Table 2.1).
- Women were overrepresented as victims of IPV, accounting for almost 8 in 10 victims (79%). IPV was the most common kind of violence experienced by women (45% of all female victims aged 15 to 89) (Table 2.1).
- The rate of police-reported IPV in Canada declined by 14% between 2009 and 2017, despite a 1% increase between 2016 and 2017. The longer-term decline was less pronounced, however, than the concurrent decrease in violence outside intimate relationships (-22%, from 929 victims per 100,000 to 721) (Chart 2.1).Note
- The decline in IPV rates recorded between 2009 and 2017 was more pronounced among females (-16%, from 579 victims per 100,000 to 487) than males (-7%, from 145 per 100,000 to 134) (Chart 2.1).

Data table for Chart 2.1
| Year | Intimate partner violence | Non-intimate partner violence | ||||
|---|---|---|---|---|---|---|
| female victims | male victims | total victims | female victims | male victims | total victims | |
| rate per 100,000 population | ||||||
| 2009 | 579 | 145 | 365 | 725 | 1,139 | 929 |
| 2010 | 576 | 148 | 365 | 729 | 1,094 | 909 |
| 2011 | 544 | 140 | 344 | 668 | 1,021 | 842 |
| 2012 | 519 | 137 | 330 | 641 | 984 | 811 |
| 2013 | 487 | 131 | 311 | 589 | 883 | 735 |
| 2014 | 468 | 129 | 300 | 555 | 838 | 695 |
| 2015 | 479 | 131 | 307 | 565 | 854 | 708 |
| 2016 | 481 | 133 | 309 | 569 | 847 | 707 |
| 2017 | 487 | 134 | 313 | 592 | 853 | 721 |
|
Note: Rates are calculated on the basis of 100,000 population aged 15 to 89 years. Populations based upon July 1st estimates from Statistics Canada, Demography Division. Victims refer to those aged 15 to 89 years. Victims aged 90 years and older are excluded from analyses due to possible instances of miscoding of unknown age within this age category. Excludes victims where the sex or the age was unknown or where the accused-victim relationship was unknown. Based on the Incident-based Uniform Crime Reporting Survey, Trend Database, which, as of 2009, includes data for 99% of the population in Canada. As a result, numbers may not match those presented elsewhere in the report. Source: Statistics Canada, Canadian Centre for Justice Statistics, Incident-based Uniform Crime Reporting Survey, Trend Database. |
||||||
Police-reported violence more common between dating partners than spouses
- In 2017, violence between people in dating relationships was more common than violence between spouses (17% of all victims of violent crime versus 13%) and, among all victims of IPV, it was twice as common between current partners (20%) than former partners (10%)Note (Table 2.1).
- The highest rates of police-reported IPV were experienced by people aged 25 to 34 years, a finding consistent for males as well as females in 2017. In comparison, rates of non-IPV were highest among those aged 15 to 24 and declined with age (Table 2.2).
- Women were more likely to be physically assaulted by an intimate partner than by someone else (359 victims per 100,000 versus 298). In contrast, police-reported sexual assault by an intimate partner was considerably less common than non-IPV sexual assault (24 victims per 100,000 population versus 90) (Table 2.2).Note
Police-reported violence by a spouse less likely to result in charges than violence by dating partners
- A criminal incident is considered cleared when a charge is laid or recommended, or when it is dealt with by police in another way (for example, through referral to a diversionary program). When it came to incidents that were cleared, dating violence was more likely to result in a charge than violence by a spouse. In cases of physical assault, 91% of dating violence victims saw charges laid in relation to the incidents in which they were involved, compared to 78% for spousal violence (Table 2.3).
Presence of firearms rare in instances of police-reported intimate partner violence
- About 7 in 10 (72%) victims of IPV had physical force used against them, as opposed to weapons such as firearms, knives or blunt instruments. This was a higher proportion than among victims of non-IPV (57%).Note Among IPV victims, weapons such as firearms, knives and others were more common among male victims (25%) than female victims (13%) (Table 2.4).
- Firearms were the least common type of weapon present during police-reported violence between intimate partners in 2017 (1%). In comparison, 4% of victims of non-IPV were involved in incidents where a firearm was present (Table 2.4).
- When it came to the level of injury sustained by victims of IPV in 2017, more than half (55%) reported minor physical injuries that did not require medical attention beyond some first aid. Major injuries and death resulted for 2% of victims, while 42% did not sustain any physical injury. These proportions were similar for male and female victims—a contrast to non-IPV, where males were considerably more likely than females to sustain an injury (both minor and major) (Table 2.4).
Police-reported intimate partner violence rates highest among accused aged 25 to 34
- For both males and females accused of police-reported IPV in 2017, rates were highest among accused aged 25 to 34 years (797 accused persons per 100,000 population and 192, respectively) (Table 2.5).Note
- For males in this age group (25 to 34 years) in particular, accused rates for IPV far exceeded those for other types of violence, at more than double those of violence committed against a friend, acquaintance or other non-family member known to the accused (363 per 100,000 population) (Table 2.5).
Police-reported intimate partner violence rates higher in rural areas
- As with violence that happened outside intimate relationships, IPV rates among the provinces were highest in Saskatchewan (682 victims per 100,000 people) and Manitoba (599) and lowest in Ontario (223) and Prince Edward Island (225). In all provinces and territories, non-IPV rates were two to three times higher than IPV rates (Table 2.6).
- In most provinces and territories, rates of IPV recorded in 2017 were fairly stable in comparison to 2016. Exceptions included increases in the Northwest Territories (+12%), New Brunswick (+8%), Nova Scotia (+5%) and Quebec (+5%), and decreases in Prince Edward Island (-5%), Alberta (-3%) and Yukon (-3%) (Table 2.6).Note
- Overall, rates of police-reported violent crime were higher in rural areas than in urban ones in 2017, and the same was true for IPV (474 victims per 100,000 population versus 276).Note However, the gap between urban and rural crime rates was slightly more pronounced when it came to violence between intimate partners: rural crime rates for IPV were 1.7 times higher than in urban areas, compared to 1.3 times higher for non-IPV rates (Table 2.7).
- Male victims in urban areas had the lowest overall rates of IPV in 2017 (117 victims per 100,000 population). IPV rates among female victims were also lower in urban areas, but remained close to four times higher than among their male counterparts (431). Women in rural areas experienced the highest overall rates of IPV (743 victims per 100,000 population), with rates that were three and a half times higher than those for men in these areas (211) (Chart 2.2).
- Among Canada’s largest cities, in 2017, the highest rates of police-reported IPV were found in the census metropolitan areas (CMAs)Note of Thunder Bay (439 victims per 100,000 population), Regina (425), and Moncton (402). These CMAs also reported the highest rates of IPV among women in particular, and Moncton and Thunder Bay reported some of the highest rates among men. A relatively high rate of IPV among male victims was also reported in Gatineau (193 per 100,000) (Table 2.8).
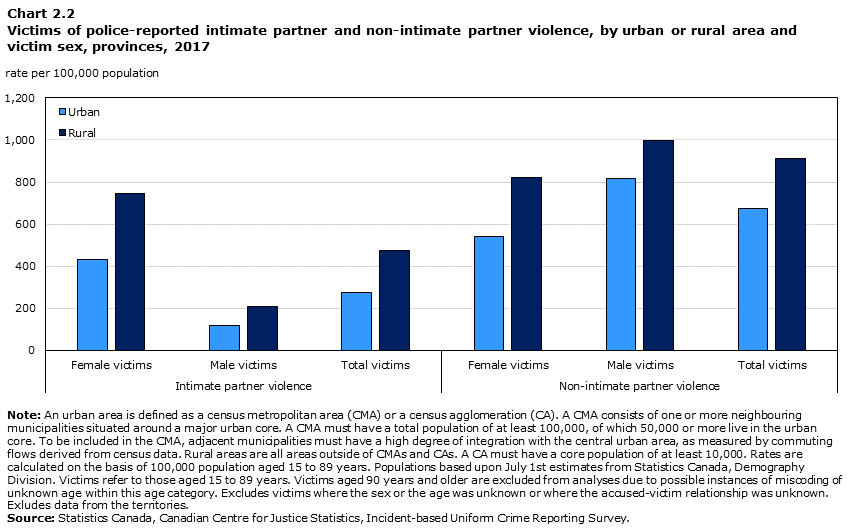
Data table for Chart 2.2
| Intimate partner violence | Non-intimate partner violence | |||||
|---|---|---|---|---|---|---|
| Female victims | Male victims | Total victims | Female victims | Male victims | Total victims | |
| rate per 100,000 population | ||||||
| Urban | 431 | 117 | 276 | 540 | 816 | 676 |
| Rural | 743 | 211 | 474 | 819 | 997 | 909 |
|
Note: An urban area is defined as a census metropolitan area (CMA) or a census agglomeration (CA). A CMA consists of one or more neighbouring municipalities situated around a major urban core. A CMA must have a total population of at least 100,000, of which 50,000 or more live in the urban core. To be included in the CMA, adjacent municipalities must have a high degree of integration with the central urban area, as measured by commuting flows derived from census data. Rural areas are all areas outside of CMAs and CAs. A CA must have a core population of at least 10,000. Rates are calculated on the basis of 100,000 population aged 15 to 89 years. Populations based upon July 1st estimates from Statistics Canada, Demography Division. Victims refer to those aged 15 to 89 years. Victims aged 90 years and older are excluded from analyses due to possible instances of miscoding of unknown age within this age category. Excludes victims where the sex or the age was unknown or where the accused-victim relationship was unknown. Exludes data from the territories. Source: Statistics Canada, Canadian Centre for Justice Statistics, Incident-based Uniform Crime Reporting Survey. |
||||||
Most intimate partner homicides involve female victims, arguments and quarrels
- Intimate partner homicides occur within complex interpersonal contexts that often involve a history of violence. When it came to homicides between spouses specifically,Note almost two-thirds (62%) of those which occurred between 2007 and 2017 were preceded by a history of family violence. The primary motive in these cases was most often an argument or quarrel (50%), frustration, anger or despair (24%) and jealousy (17%), a range of emotions typical of offenders exerting control over victims.Note
- Analyses of police-reported motives are important for violence prevention policy. Between 2007 and 2017, an argument or quarrel was the most common primary motive for intimate partner homicides occurring between 2007 and 2017 (39%), including those involving spouses as well as dating partners. This was followed by frustration, anger or despair (27%) and jealousy (19%) (Table 2.9).
- Of the 933 intimate partner homicides which occurred between 2007 and 2017, a large majority (79%) involved female victims. Most female victims of intimate partner homicide were killed by a current or former legally married or common-law husband (75%), and boyfriends were responsible for the other quarter (25%) of female victims’ deaths. Most male victims were also killed by current or former legally married or common-law wives (59%) and girlfriends (27%), but a notable proportion were killed by same-sex spouses or dating partners (14%) (Table 2.10).
Detailed data tables
Table 2.10 Victims of intimate partner homicide, by victim sex and year, Canada, 2007 to 2017
- Date modified: