
Education, learning and training: Research Paper Series
Postsecondary students receiving payments from the Canada Emergency Response Benefit (CERB) and the Canada Emergency Student Benefit (CESB) in 2020
Skip to text
Text begins
In 2020, the federal government implemented the Canada Emergency Response Benefit (CERB) and the Canada Emergency Student Benefit (CESB) to provide financial support to employees, self-employed individuals and students directly affected by COVID-19.
The CERB was available for individuals who stopped working or were working reduced hours because of COVID-19, and who met various other eligibility criteria.Note CERB applicants received $2,000 for an initial four-week period and could reapply for additional periods, eventually extending to 28 weeks, for a maximum benefit of $14,000. The benefit covered the period from March 15 to September 26, 2020.
The CESB was available to students enrolled in a postsecondary educational program leading to a degree, diploma, or certificate, who were ineligible for the CERB or EI benefits, but met various other eligibility criteria.Note The benefit was active between May 10 and August 29, 2020. Eligible CESB applicants received $1,250 for an initial four-week period and could reapply for additional periods, up to 16 weeks, for a maximum benefit of $5,000. Additionally, applicants with a disability or dependant(s) could receive a benefit top-up, in which case they were eligible to receive $2,000 every four weeks, up to a maximum benefit of $8,000.
The CESB addressed a gap left by the CERB, which excluded students who were not employed at the start of the pandemic but would typically be looking for work during the summer of 2020. In 2019, for example, the Labour Force Survey showed that 69% of persons aged 20 to 24 who were full-time students in March 2019 and planned on returning to school in the fall were employed in August 2019.
This paper provides insights into the differences in the rate of receipt of CERB and CESB of postsecondary students who received emergency benefit payments in 2020. Emergency benefit receipt is examined along various educational and socio-demographic characteristics to highlight some of the key differences. The analysis is limited to Canadian citizens and permanent residents who were enrolled full-time or part-time in a public postsecondary institution in the fall of 2019 in a program leading to a degree, diploma, or certificate.Note
In this paper, “emergency benefits” is the general term to refer to either CERB, CESB, or both.
The majority of postsecondary students received emergency benefits
Almost two-thirds of postsecondary students (65.4%) received emergency benefits. This is likely because, at the start of the pandemic, students worked in industry sectors that were heavily impacted, and, by the summer, these industries had not sufficiently recovered so as to allow students to find summer jobs. The number of students aged 20 to 24 who were employed in May 2020 (276,200) was 42.3% lower than in May 2019 (478,600).
More students received CERB (41.9%) than CESB (28.7%), due, in part, to the fact that one of the eligibility requirements for CESB was that the individual could not apply for, receive, or qualify for CERB during the same eligibility period, but could qualify for different types of benefits in different eligibility periods. Therefore, only those students who were ineligible for CERB could apply for CESB. It was uncommon (5.2%) for students to receive both benefits.

Data table for Chart 1
| Type of emergency benefits received | Number of individuals |
|---|---|
| count | |
| CERB Only | 564,200 |
| CESB Only | 362,010 |
| Both | 80,090 |
| Neither CERB nor CESB | 533,000 |
| Source: Statistics Canada, Postsecondary Student Information System (PSIS), 2019-2020, Emergency and recovery benefits (ERB), March to September 2020 and T4A Slip data, 2020. | |
For those who received CESB, the average amount ($4,200) corresponds to students receiving CESB benefits for between three and four of the four CESB eligibility periods. For those who received CERB, the average amount ($8,200) corresponds to students receiving CERB benefits for between four and five of the seven eligibility periods. As shown in Table 1, on average, students who only received CERB received twice as much ($8,800) as students only having received CESB ($4,400).
| Grouping | Individuals | Average amount of CERB received | Average amount of CESB received | |
|---|---|---|---|---|
| number | percent of total | dollars | ||
| All students enrolled during the fall of 2019 | 1,539,300 | 100 | Note ...: not applicable | Note ...: not applicable |
| Students who received emergency benefits (CERB, CESB, or both) | 1,006,300 | 65.4 | 5,300 | 1,900 |
| Students who received CERB | 644,280 | 41.9 | 8,200 | 400 |
| Students who only received CERB | 564,200 | 36.7 | 8,800 | Note ...: not applicable |
| Students who received both CESB and CERB | 80,090 | 5.2 | 4,000 | 3,500 |
| Students who received CESB | 442,100 | 28.7 | 700 | 4,200 |
| Students who only received CESB | 362,010 | 23.5 | Note ...: not applicable | 4,400 |
| Students who received both CESB and CERB | 80,090 | 5.2 | 4,000 | 3,500 |
| Students who received CESB disability or dependant top-up amount for at least one eligibility period | 58,980 | 3.8 | 1,000 | 6,500 |
| Students who did not receive emergency benefits | 533,000 | 34.6 | Note ...: not applicable | Note ...: not applicable |
|
... not applicable Note: Totals may not equal the sum of their parts due to rounding. Note: The CESB top-up amount, for students who had a disability or had at least one child under the age of 12 or other dependants, is included in the average amount of CESB received. Note: The "Average amount of CERB received" measurement includes $0 observations in some cases, and excludes $0 observations in other cases, depending on the grouping. For example, the value in this column for the "Students who received CERB" grouping does not include any $0 observations, but the value in this column for the "Students who received CESB" column does include $0 observations. Note: The "Average amount of CESB received" measurement includes $0 observations in some cases, and excludes $0 observations in other cases, depending on the grouping. For example, the value in this column for the "Students who received CESB" grouping does not include any $0 observations, but the value in this column for the "Students who received CERB" column does include $0 observations. Source: Statistics Canada, Postsecondary Student Information System (PSIS), 2019-2020, Emergency and recovery benefits (ERB), March to September 2020 and T4A Slip data, 2020. |
||||
Women received CERB more than men, but men received CESB more than women
A higher percentage of female postsecondary students received CERB (43.0%) than their male counterparts (40.3%). By contrast, a higher percentage of male postsecondary students received CESB (30.6%) than their female counterparts (27.4%). This may be due to women having been more severely affected by employment losses in the service sector than men during the COVID-19 pandemic; therefore, more likely to be eligible for CERB.
Additionally, according to the Labour Force Survey, younger workers were hit harder during the early stages of the pandemic. As shown in Chart 2, younger students were more likely to receive emergency benefits. This may be partly due to older students having had a stronger attachment to the labour market and being less likely to have had their employment status affected by the pandemic.
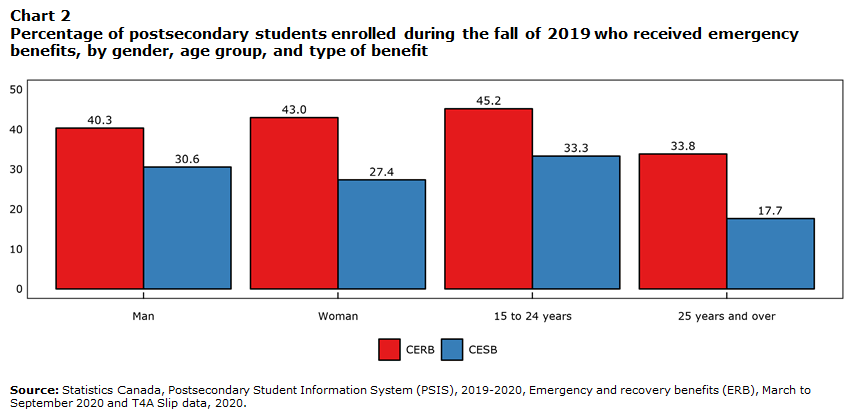
Data table for Chart 2
| Grouping | CERB | CESB |
|---|---|---|
| percent | ||
| Man | 40.3 | 30.6 |
| Woman | 43.0 | 27.4 |
| 15 to 24 years | 45.2 | 33.3 |
| 25 years and over | 33.8 | 17.7 |
| Source: Statistics Canada, Postsecondary Student Information System (PSIS), 2019-2020, Emergency and recovery benefits (ERB), March to September 2020 and T4A Slip data, 2020. | ||
Students in graduate-level degree programs were less likely to receive emergency benefits
For all selected educational qualifications,Note except for doctoral degrees, students received CERB payments at higher rates than CESB payments. Graduate-level degree program (master’s and doctoral degrees) students were less likely to receive emergency benefits than students enrolled in an undergraduate degree or a college-level program. However, students in graduate-level degree programs received CESB at a higher rate than students enrolled in college-level certificate programs. Undergraduate degree students received CESB payments at the highest rate (34.4%), while college-level diploma students received CERB payments at the highest rate (48.3%). A recent study demonstrated similar trends for CERB payments by educational qualification for recent graduates.
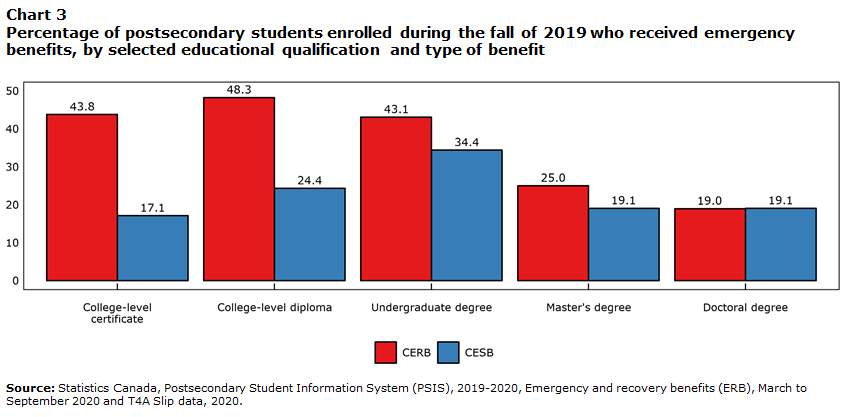
Data table for Chart 3
| Educational qualification | CERB | CESB |
|---|---|---|
| percent | ||
| College-level certificate | 43.8 | 17.1 |
| College-level diploma | 48.3 | 24.4 |
| Undergraduate degree | 43.1 | 34.4 |
| Master's degree | 25.0 | 19.1 |
| Doctoral degree | 19.0 | 19.1 |
| Source: Statistics Canada, Postsecondary Student Information System (PSIS), 2019-2020, Emergency and recovery benefits (ERB), March to September 2020 and T4A Slip data, 2020. | ||
Since college-level diplomas and undergraduate degrees represent the most numerous of all educational qualifications in Canada, and since students pursuing these educational qualifications accessed emergency benefits at the highest rates, the remainder of the analysis focuses on students enrolled in these two educational qualifications during the fall of 2019.
A higher percentage of postsecondary students received CERB than CESB in all provinces of study and for nearly all fields of study
For all provinces and territories, students in a college-level diploma or an undergraduate degree were more likely to receive CERB than CESB. The percentage of students receiving emergency benefits varied by the province of their educational institution. For both educational qualifications, students attending postsecondary institutions in Prince Edward Island received CERB at the highest rates. Individuals pursuing undergraduate degrees in Ontario received CESB at higher rates than students attending institutions in other provinces and territories. The differences between provinces may be due to differences in public health measures or differences in job opportunities in different parts of the country at specific points during the pandemic. Statistics Canada has developed the COVID-19 Restrictions Index to measure the stringency of the public health measures by province. The index reveals that Prince Edward Island had among the most stringent public health measures at the initial onset of the pandemic, which overlaps with the first two eligibility periods for CERB. Additionally, during part of the summer of 2020, when students were able to apply for CESB, the COVID-19 Restrictions Index was the highest in Ontario.
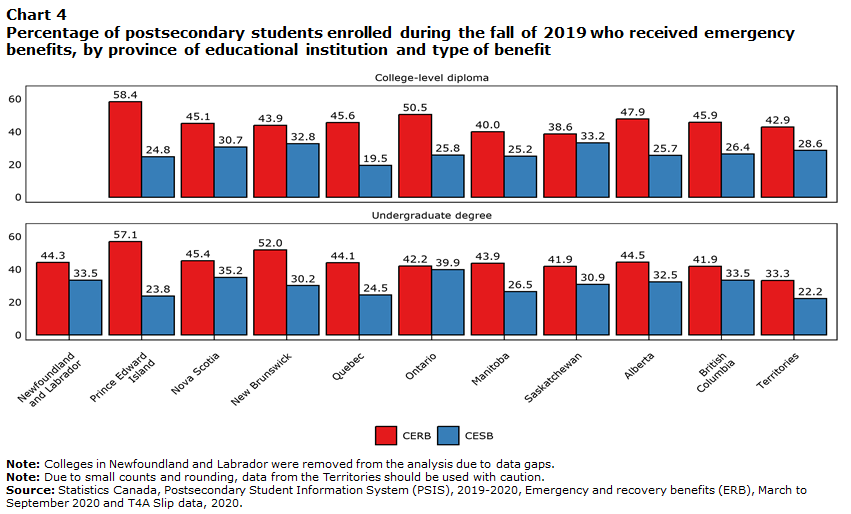
Data table for Chart 4
| Province of educational institution | Educational qualification | CERB | CESB |
|---|---|---|---|
| percent | |||
| Newfoundland and Labrador | College-level diploma | Note x: suppressed to meet the confidentiality requirements of the Statistics Act | Note x: suppressed to meet the confidentiality requirements of the Statistics Act |
| Newfoundland and Labrador | Undergraduate degree | 44.3 | 33.5 |
| Prince Edward Island | College-level diploma | 58.4 | 24.8 |
| Prince Edward Island | Undergraduate degree | 57.1 | 23.8 |
| Nova Scotia | College-level diploma | 45.1 | 30.7 |
| Nova Scotia | Undergraduate degree | 45.4 | 35.2 |
| New Brunswick | College-level diploma | 43.9 | 32.8 |
| New Brunswick | Undergraduate degree | 52.0 | 30.2 |
| Quebec | College-level diploma | 45.6 | 19.5 |
| Quebec | Undergraduate degree | 44.1 | 24.5 |
| Ontario | College-level diploma | 50.5 | 25.8 |
| Ontario | Undergraduate degree | 42.2 | 39.9 |
| Manitoba | College-level diploma | 40.0 | 25.2 |
| Manitoba | Undergraduate degree | 43.9 | 26.5 |
| Saskatchewan | College-level diploma | 38.6 | 33.2 |
| Saskatchewan | Undergraduate degree | 41.9 | 30.9 |
| Alberta | College-level diploma | 47.9 | 25.7 |
| Alberta | Undergraduate degree | 44.5 | 32.5 |
| British Columbia | College-level diploma | 45.9 | 26.4 |
| British Columbia | Undergraduate degree | 41.9 | 33.5 |
| Territories | College-level diploma | 42.9 | 28.6 |
| Territories | Undergraduate degree | 33.3 | 22.2 |
|
x suppressed to meet the confidentiality requirements of the Statistics Act Note: Colleges in Newfoundland and Labrador were removed from the analysis due to data gaps. Note: Due to small counts and rounding, data from the Territories should be used with caution. Source: Statistics Canada, Postsecondary Student Information System (PSIS), 2019-2020, Emergency and recovery benefits (ERB), March to September 2020 and T4A Slip data, 2020. |
|||
Students pursuing college-level diplomas were more likely to receive CERB than CESB for all fields of study. For undergraduate degrees, students were more likely to receive CERB than CESB, except for those pursuing studies in “physical and life sciences and technologies”, “mathematics, computer and information sciences”, and “architecture, engineering, and related technologies”.
Students enrolled in undergraduate degree programs received CESB payments at a higher rate than college-level diploma students for all fields of study.
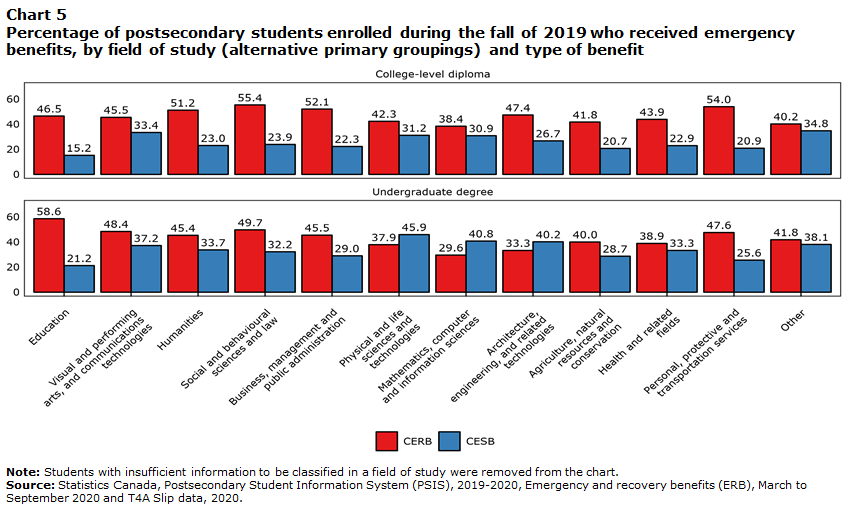
Data table for Chart 5
| Field of study | Educational qualification | CERB | CESB |
|---|---|---|---|
| percent | |||
| Education | College-level diploma | 46.5 | 15.2 |
| Education | Undergraduate degree | 58.6 | 21.2 |
| Visual and performing arts, and communications technologies | College-level diploma | 45.5 | 33.4 |
| Visual and performing arts, and communications technologies | Undergraduate degree | 48.4 | 37.2 |
| Humanities | College-level diploma | 51.2 | 23.0 |
| Humanities | Undergraduate degree | 45.4 | 33.7 |
| Social and behavioural sciences and law | College-level diploma | 55.4 | 23.9 |
| Social and behavioural sciences and law | Undergraduate degree | 49.7 | 32.2 |
| Business, management and public administration | College-level diploma | 52.1 | 22.3 |
| Business, management and public administration | Undergraduate degree | 45.5 | 29.0 |
| Physical and life sciences and technologies | College-level diploma | 42.3 | 31.2 |
| Physical and life sciences and technologies | Undergraduate degree | 37.9 | 45.9 |
| Mathematics, computer and information sciences | College-level diploma | 38.4 | 30.9 |
| Mathematics, computer and information sciences | Undergraduate degree | 29.6 | 40.8 |
| Architecture, engineering, and related technologies | College-level diploma | 47.4 | 26.7 |
| Architecture, engineering, and related technologies | Undergraduate degree | 33.3 | 40.2 |
| Agriculture, natural resources and conservation | College-level diploma | 41.8 | 20.7 |
| Agriculture, natural resources and conservation | Undergraduate degree | 40.0 | 28.7 |
| Health and related fields | College-level diploma | 43.9 | 22.9 |
| Health and related fields | Undergraduate degree | 38.9 | 33.3 |
| Personal, protective and transportation services | College-level diploma | 54.0 | 20.9 |
| Personal, protective and transportation services | Undergraduate degree | 47.6 | 25.6 |
| Other | College-level diploma | 40.2 | 34.8 |
| Other | Undergraduate degree | 41.8 | 38.1 |
|
Note: Students with insufficient information to be classified in a field of study were removed from the chart. Source: Statistics Canada, Postsecondary Student Information System (PSIS), 2019-2020, Emergency and recovery benefits (ERB), March to September 2020 and T4A Slip data, 2020. |
|||
Conclusion
Among students enrolled in postsecondary studies during the fall of 2019, almost two-thirds (65.4%) received emergency benefits in response to the COVID-19 pandemic. This is due in part to the difficulties they experienced in the labour market. Students were more likely to receive CERB than CESB, regardless of gender, age group, and the province of study. Of the selected educational qualifications, students in college-level diploma programs were the most likely to receive CERB payments while doctoral degree students were the least likely. Additionally, CESB payments were received at the highest rate by undergraduate degree students and the lowest rate by students in college-level certificate programs. The rate of received CERB payments was comparatively high in Prince Edward Island. Future research could attempt to further understand why the identified groups accessed emergency benefits at different rates than others.
Melissa Van Bussel, George Marshall and Eric Fecteau are analysts with the Canadian Centre for Education Statistics at Statistics Canada.
Notes to readers
This report uses the Education and Labour Market Longitudinal Platform (ELMLP), which is an environment where the administrative data from the Canada Emergency Student Benefit (CESB) and the Canada Emergency Response Benefit (CERB) can be integrated with the Postsecondary Student Information System (PSIS). The CESB data used in this release come from the 2020 T4A slip from Canada Revenue Agency (CRA). The CERB data used in this release come from Employment and Social Development Canada (ESDC) and contain information on initial payments from both streams of the program, one administered by ESDC and the other by CRA on its behalf.
The study population is restricted to: “Canadian citizens” and “permanent residents”;Note students who were enrolled full-time or part-time in a public postsecondary institution in the fall of 2019;Note students in a program that leads to a degree, diploma, or certificate;Note and students not in a “basic education” or “apprenticeship” program. Individuals with insufficient information to create an anonymous key to integrate the CERB and CESB data to PSIS were removed from the analysis.
Only one record was retained for each individual. Since students can be enrolled in multiple programs at once, a set of sequential rules were applied in the following order to choose the most relevant record to retain for the analysis: 1) keep the record with a graduation flag (i.e., prioritise graduation over enrolments); 2) keep the record with the highest program type (e.g., graduate program level is retained over undergraduate level); 3) if program types are the same, then keep the record with the highest credential type (e.g., degree is retained over diploma). If after this process an individual still had multiple records, one record was selected randomly.
- Date modified: