
Education, learning and training: Research Paper Series
Graduates of 2010 to 2018 receiving payments from the Canada Emergency Response Benefit (CERB) program in 2020
Skip to text
Text begins
In 2020, the federal government implemented the Canada Emergency Response Benefit (CERB) program to provide financial support to employees and self-employed Canadians directly affected by COVID-19. The CERB was available for individuals who fulfilled all of the following criteria:
- resided in Canada
- were at least 15 years old
- had stopped working or had been working reduced hours because of COVID-19
- did not expect to earn over $1,000 in employment or self-employment income for at least 14 days in a row during a four-week period
- had employment or self-employment income of at least $5,000 in 2019 or in the 12 months prior to the date of their application
- had not quit their job voluntarily.
Applicants received $2,000 for an initial four-week period and could reapply for additional periods, eventually extending to 28 weeks, for a maximum benefit of $14,000. The program covered the period from March 15 to September 26,
This paper compares the proportion of 2010 to 2018 postsecondary graduates who received CERB payments in 2020, by various educational and socio-demographic characteristics, to the proportion of “all workers” who received CERB, as outlined in a recent Statistics Canada publication entitled “Workers receiving payments from the Canada Emergency Response Benefit program in 2020”. The 2010 to 2018 graduates are of particular interest because, while they are younger and typically have less seniority, having a recent education qualification may have helped them keep their employment. The analysis is limited to individuals who earned at least $5,000 in 2019.Note
Appendix A provides additional information on the proportion of graduates who received CERB payments by characteristics such as sex, age group (in 2020), province of residence (in 2020), field of study (in the year of graduation) and industry of employment (in 2019), for the graduates of 2010 and 2018 who graduated with a college-level certificate, a college-level diploma, an undergraduate degree, a master's degree or a doctoral degree.
A higher proportion of college-level graduates received CERB payments than university-level graduates
A higher proportion of the most recent graduates (33.4% for 2018) received CERB payments, compared to the least recent graduates (19.9% for 2010),Note Note but those who graduated between 2010 and 2018, regardless of the year of graduation, had a lower proportion than “all workers”Note (35.2%).
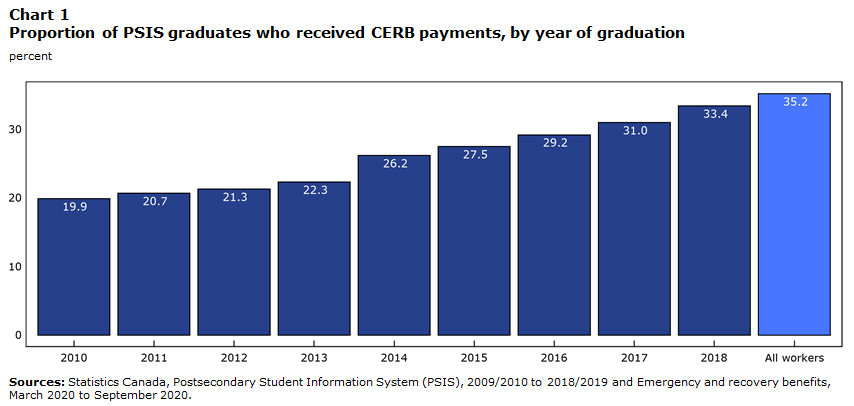
Data table for Chart 1
| Year of graduation | Proportion of PSIS graduates who received CERB payments |
|---|---|
| percent | |
| 2010 | 19.9 |
| 2011 | 20.7 |
| 2012 | 21.3 |
| 2013 | 22.3 |
| 2014 | 26.2 |
| 2015 | 27.5 |
| 2016 | 29.2 |
| 2017 | 31.0 |
| 2018 | 33.4 |
| All workers | 35.2 |
| Sources: Statistics Canada, Postsecondary Student Information System (PSIS), 2009/2010 to 2018/2019 and Emergency and recovery benefits, March 2020 to September 2020. | |
The remainder of the paper focuses on the 2018 graduates. This year of graduation was selected since it was the most recent year of graduation available.
A smaller proportion of graduates from 2018 with higher educational qualifications received CERB payments than those with lower educational qualifications.Note The four university-level educational qualifications included in this analysis had a lower proportion of graduates who received CERB payments than the general working population. Both college-level educational qualifications included in this analysis had a higher proportion of graduates who received CERB payments than the general working population.

Data table for Chart 2
| Educational qualification | Proportion of PSIS graduates who received CERB payments |
|---|---|
| percent | |
| College-level certificate | 45.8 |
| College-level diploma | 41.1 |
| Undergraduate degree | 31.4 |
| Professional degree | 17.3 |
| Master's degree | 19.0 |
| Doctoral degree | 13.3 |
| All workers | 35.2 |
| Sources: Statistics Canada, Postsecondary Student Information System (PSIS), 2009/2010 to 2018/2019 and Emergency and recovery benefits, March 2020 to September 2020. | |
Graduates of 2018 in the “Visual and performing arts, and communications technologies” field of study had the highest proportion of graduates who received CERB payments
Students who graduated in 2018 from the “Visual and performing arts, and communications technologies” field of
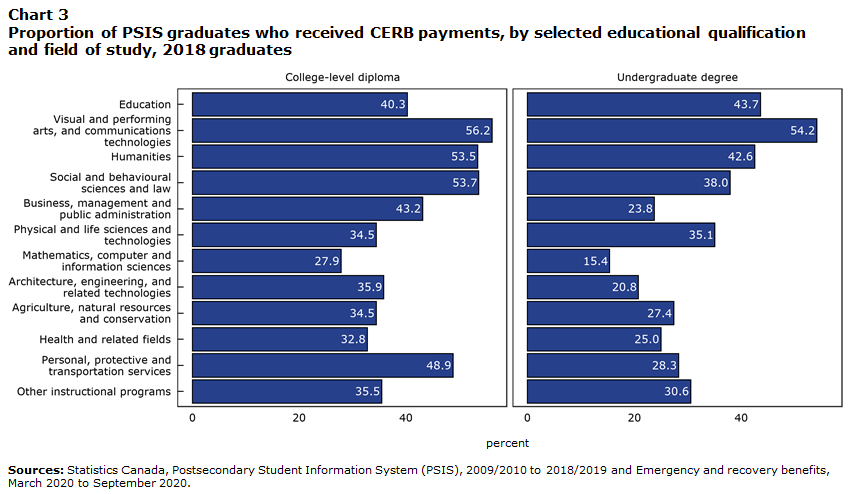
Data table for Chart 3
| Field of Study | Educational qualification | |
|---|---|---|
| College-level diploma | Undergraduate degree | |
| percent | ||
| Education | 40.3 | 43.7 |
| Visual and performing arts, and communications technologies | 56.2 | 54.2 |
| Humanities | 53.5 | 42.6 |
| Social and behavioural sciences and law | 53.7 | 38.0 |
| Business, management and public administration | 43.2 | 23.8 |
| Physical and life sciences and technologies | 34.5 | 35.1 |
| Mathematics, computer and information sciences | 27.9 | 15.4 |
| Architecture, engineering, and related technologies | 35.9 | 20.8 |
| Agriculture, natural resources and conservation | 34.5 | 27.4 |
| Health and related fields | 32.8 | 25.0 |
| Personal, protective and transportation services | 48.9 | 28.3 |
| Other instructional programs | 35.5 | 30.6 |
| Sources: Statistics Canada, Postsecondary Student Information System (PSIS), 2009/2010 to 2018/2019 and Emergency and recovery benefits, March 2020 to September 2020. | ||
A greater proportion of female graduates received CERB payments than male graduates, for graduates who earned a college-level diploma or an undergraduate degree
A recent study has shown that the pandemic disproportionately impacted women; more specifically, women have been more severely affected by employment losses in the services sector than their male counterparts. The occupations and sectors in which women were more likely to be employed were most impacted by emergency measures, including “retail trade”, “accommodation and food services”, and other service industries that involve face-to-face contact.Note In the current study, more female graduates received CERB payments than male graduates for college-level diploma graduates and undergraduate degree graduates. The same tendency was also present among “all workers”.
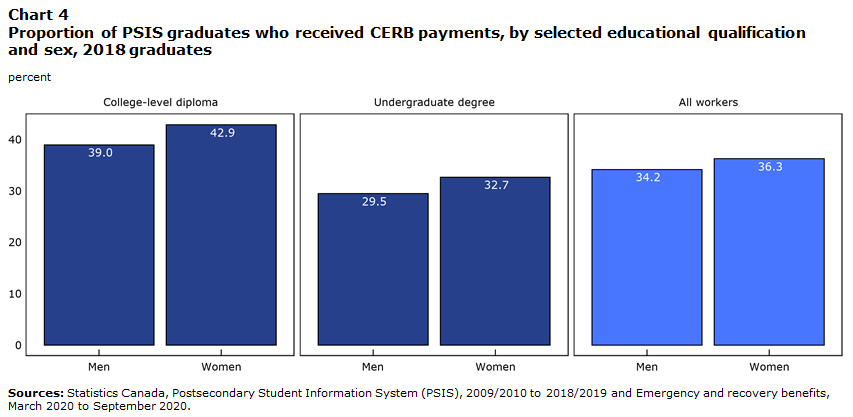
Data table for Chart 4
| Sex | Educational qualification | ||
|---|---|---|---|
| College-level diploma | Undergraduate degree | All workers | |
| percent | |||
| Men | 39.0 | 29.5 | 34.2 |
| Women | 42.9 | 32.7 | 36.3 |
| Sources: Statistics Canada, Postsecondary Student Information System (PSIS), 2009/2010 to 2018/2019 and Emergency and recovery benefits, March 2020 to September 2020. | |||
Conclusion
This study shows that 2010 to 2018 graduates were less likely to receive CERB payments than the general working population. When considering time since graduation, the study also demonstrated that, while graduates in all years were less likely to receive CERB payments than the general working population, the most recent graduates were more likely to receive the CERB than less recent graduates. However, when disaggregating the data of the 2018 graduates, not all educational qualifications were less likely to receive the CERB than “all workers.” Those who graduated with a college-level certificate or a college-level diploma in 2018 were more likely to have received the CERB than the “all workers” category. Likely due to the impact of COVID-19 on the culture, arts, entertainment and recreation industries, those who graduated in 2018 with a college-level diploma or an undergraduate degree in the “Visual and performing arts, and communications technologies” field of study were the most likely to receive CERB payments. Finally, men were less likely to receive CERB payments than women, both among 2018 graduates and the general working population.
Further studies could be conducted to take into account the interaction between the various educational and socio-demographic factors impacting the likelihood of receiving CERB payments. Other factors that could be considered in further studies include the educational qualification of the “all workers” category and their field of study and occupation.
George Marshall and Eric Fecteau are analysts with the Canadian Centre for Education Statistics at Statistics Canada.
Notes to readers
This report uses the Education and Labour Market Longitudinal Platform (ELMLP), which creates an environment where the administrative data from the CERB program can be integrated to the Postsecondary Student Information System (PSIS). Earnings in 2019 were gleaned from employee T4 slips and net self-employment income and eligible dividends reported on T1 Income Tax and Benefit Return forms. The CERB data highlighted in this release come from Employment and Social Development Canada (ESDC) and contain information on initial payments from both streams of the program, one administered by ESDC and the other by the Canada Revenue Agency on its behalf.
For more information on the methodology used to create the cohorts of graduates, the exclusions and the data limitations of this methodology, see the Labour market outcomes for college and university graduates, technical reference guide. Individuals with insufficient information to create an anonymous key to integrate the CERB data to PSIS data were removed from the 2010 to 2018 graduate’s analysis.
Appendix A
| College-level certificate | College-level diploma | Undergraduate degree | Master's degree | Doctoral degree | |
|---|---|---|---|---|---|
| percent | |||||
| Total | 45.8 | 41.1 | 31.4 | 19.0 | 13.3 |
| Sex | |||||
| Male | 43.0 | 39.0 | 29.5 | 19.8 | 13.5 |
| Female | 48.1 | 42.9 | 32.7 | 18.4 | 12.9 |
| Age groups (in 2020) | |||||
| 15 to 24 | 48.4 | 43.4 | 32.2 | 19.6 | Note x: suppressed to meet the confidentiality requirements of the Statistics Act |
| 25 to 34 | 45.0 | 38.6 | 31.8 | 20.4 | 10.4 |
| 35 to 44 | 41.9 | 38.9 | 25.1 | 15.6 | 15.6 |
| 45 to 54 | 38.5 | 40.9 | 21.5 | 13.5 | 17.3 |
| 55 to 64 | 38.8 | 38.1 | 21.5 | 17.9 | 19.0 |
| Province of residence (in 2020) | |||||
| Newfoundland and Labrador | 38.9 | 31.3 | 34.0 | 17.5 | Note x: suppressed to meet the confidentiality requirements of the Statistics Act |
| Prince Edward Island | 37.0 | 33.6 | 33.3 | 9.5 | Note x: suppressed to meet the confidentiality requirements of the Statistics Act |
| Nova Scotia | 42.7 | 35.5 | 29.9 | 14.4 | 16.7 |
| New Brunswick | 42.7 | 32.4 | 29.4 | 13.8 | Note x: suppressed to meet the confidentiality requirements of the Statistics Act |
| Quebec | 50.0 | 35.1 | 31.0 | 21.1 | 14.3 |
| Ontario | 52.4 | 45.7 | 33.5 | 20.2 | 13.4 |
| Manitoba | 35.6 | 28.7 | 28.6 | 14.7 | 5.9 |
| Saskatchewan | 38.2 | 28.6 | 23.6 | 13.0 | 16.7 |
| Alberta | 46.3 | 41.5 | 30.2 | 17.2 | 13.8 |
| British Columbia | 42.9 | 37.0 | 28.7 | 15.6 | 9.5 |
| Territories | 31.6 | 28.0 | 15.0 | Note x: suppressed to meet the confidentiality requirements of the Statistics Act | Note x: suppressed to meet the confidentiality requirements of the Statistics Act |
| Field of study (in 2018) | |||||
| Education | 64.9 | 40.3 | 43.7 | 19.3 | 14.7 |
| Visual and performing arts, and communications technologies | 56.1 | 56.2 | 54.2 | 49.0 | 41.7 |
| Humanities | 54.2 | 53.5 | 42.6 | 30.5 | 22.9 |
| Social and behavioral sciences and law | 50.7 | 53.7 | 38.0 | 20.4 | 12.2 |
| Business, management and public administration | 40.0 | 43.2 | 23.8 | 12.6 | 5.6 |
| Physical and life sciences and technologies | Note x: suppressed to meet the confidentiality requirements of the Statistics Act | 34.5 | 35.1 | 18.9 | 11.5 |
| Mathematics, computer and information sciences | 30.8 | 27.9 | 15.4 | 13.3 | 10.0 |
| Architecture, engineering, and related technologies | 43.6 | 35.9 | 20.8 | 20.6 | 12.7 |
| Agriculture, natural resources and conservation | 47.7 | 34.5 | 27.4 | 19.0 | 12.5 |
| Health and Related Fields | 45.0 | 32.8 | 25.0 | 22.6 | 7.7 |
| Personal, protective and transportation services | 50.7 | 48.9 | 28.3 | 9.1 | Note x: suppressed to meet the confidentiality requirements of the Statistics Act |
| Other instructional programs | Note x: suppressed to meet the confidentiality requirements of the Statistics Act | 35.5 | 30.6 | 19.4 | 14.3 |
| Industry of employment (in 2019) | |||||
| Agriculture, forestry, fishing and hunting | 35.4 | 31.7 | 28.7 | 22.2 | Note x: suppressed to meet the confidentiality requirements of the Statistics Act |
| Mining, quarrying, and oil and gas extraction | 29.4 | 30.2 | 20.2 | 17.4 | Note x: suppressed to meet the confidentiality requirements of the Statistics Act |
| Utilities | 25.0 | 18.0 | 9.6 | 5.3 | Note x: suppressed to meet the confidentiality requirements of the Statistics Act |
| Construction | 46.2 | 43.1 | 33.7 | 26.9 | Note x: suppressed to meet the confidentiality requirements of the Statistics Act |
| Manufacturing | 42.9 | 38.5 | 26.1 | 21.6 | 11.1 |
| Wholesale trade | 40.0 | 37.1 | 23.9 | 15.0 | Note x: suppressed to meet the confidentiality requirements of the Statistics Act |
| Retail trade | 48.7 | 50.1 | 47.2 | 36.0 | Note x: suppressed to meet the confidentiality requirements of the Statistics Act |
| Transportation and warehousing | 44.1 | 40.8 | 37.8 | 27.0 | 33.3 |
| Information and cultural industries | 36.4 | 32.5 | 24.7 | 13.5 | 22.2 |
| Finance and insurance | 28.0 | 21.7 | 13.6 | 7.2 | Note x: suppressed to meet the confidentiality requirements of the Statistics Act |
| Real estate and rental and leasing | 45.5 | 45.5 | 38.2 | 31.0 | Note x: suppressed to meet the confidentiality requirements of the Statistics Act |
| Professional, scientific and technical services | 36.8 | 30.4 | 22.1 | 15.5 | 11.3 |
| Management of companies and enterprises | 35.3 | 31.0 | 22.4 | 11.8 | Note x: suppressed to meet the confidentiality requirements of the Statistics Act |
| Administrative and support, waste management and remediation services | 46.2 | 42.2 | 36.0 | 27.3 | 28.6 |
| Educational services | 59.4 | 52.5 | 37.4 | 19.1 | 13.8 |
| Health care and social assistance | 48.4 | 38.8 | 26.9 | 21.0 | 10.4 |
| Arts, entertainment and recreation | 67.2 | 71.9 | 64.9 | 53.3 | 42.9 |
| Accommodation and food services | 63.8 | 60.9 | 65.9 | 54.5 | Note x: suppressed to meet the confidentiality requirements of the Statistics Act |
| Other services (except public administration) | 53.6 | 56.5 | 38.6 | 22.0 | 11.1 |
| Public administration | 24.9 | 20.8 | 15.5 | 6.7 | 2.2 |
|
x suppressed to meet the confidentiality requirements of the Statistics Act Notes: The industries are defined using the North American Industry Classification System (NAICS) for Canada (for more information, see Statistics Canada’s industry classification). Graduates 65 years of age or older in the year of graduation (2018) are excluded from the graduate population used in this table. Graduates who were less than 65 in 2018, but more than 65 years old or older in 2020 are also excluded. Sources: Statistics Canada, Postsecondary Student Information System (PSIS), 2009/2010 to 2018/2019 and Emergency and recovery benefits, March 2020 to September 2020. |
|||||
| College-level certificate | College-level diploma | Undergraduate degree | Master's degree | Doctoral degree | |
|---|---|---|---|---|---|
| percent | |||||
| Total | 31.0 | 24.7 | 18.1 | 13.3 | 9.5 |
| Sex | |||||
| Male | 29.1 | 22.4 | 17.4 | 13.5 | 9.2 |
| Female | 32.8 | 26.2 | 18.5 | 13.1 | 9.8 |
| Age groups (in 2020) | |||||
| 25 to 34 | 32.4 | 24.1 | 17.2 | 13.2 | Note x: suppressed to meet the confidentiality requirements of the Statistics Act |
| 35 to 44 | 31.2 | 26.2 | 20.4 | 13.3 | 7.5 |
| 45 to 54 | 28.7 | 24.9 | 18.2 | 12.8 | 12.6 |
| 55 to 64 | 26.2 | 26.0 | 20.3 | 14.3 | 13.2 |
| Province of residence (in 2020) | |||||
| Newfoundland and Labrador | 31.3 | 22.5 | 17.7 | 12.2 | Note x: suppressed to meet the confidentiality requirements of the Statistics Act |
| Prince Edward Island | 31.8 | 22.2 | 14.3 | Note x: suppressed to meet the confidentiality requirements of the Statistics Act | Note x: suppressed to meet the confidentiality requirements of the Statistics Act |
| Nova Scotia | 32.9 | 27.4 | 16.5 | 8.9 | Note x: suppressed to meet the confidentiality requirements of the Statistics Act |
| New Brunswick | 26.7 | 33.3 | 15.1 | 12.5 | Note x: suppressed to meet the confidentiality requirements of the Statistics Act |
| Quebec | 42.9 | 23.4 | 19.5 | 14.4 | 12.4 |
| Ontario | 35.1 | 36.5 | 19.2 | 13.4 | 8.8 |
| Manitoba | 27.3 | 33.3 | 12.3 | 10.0 | Note x: suppressed to meet the confidentiality requirements of the Statistics Act |
| Saskatchewan | 27.2 | 16.7 | 11.5 | 9.6 | Note x: suppressed to meet the confidentiality requirements of the Statistics Act |
| Alberta | 31.0 | 25.1 | 15.9 | 13.9 | 9.1 |
| British Columbia | 31.2 | 26.7 | 18.1 | 13.6 | 9.1 |
| Territories | 27.3 | 22.2 | 6.1 | 9.1 | Note x: suppressed to meet the confidentiality requirements of the Statistics Act |
| Field of study (in 2010) | |||||
| Education | 50.0 | 31.3 | 17.7 | 8.7 | 8.7 |
| Visual and performing arts, and communications technologies | 40.5 | 42.5 | 37.1 | 36.8 | 33.3 |
| Humanities | 38.5 | 36.6 | 21.8 | 20.2 | 10.0 |
| Social and behavioral sciences and law | 40.5 | 29.6 | 20.3 | 13.0 | 10.7 |
| Business, management and public administration | 26.6 | 24.5 | 15.6 | 11.0 | Note x: suppressed to meet the confidentiality requirements of the Statistics Act |
| Physical and life sciences and technologies | Note x: suppressed to meet the confidentiality requirements of the Statistics Act | 17.3 | 17.2 | 11.8 | 9.0 |
| Mathematics, computer and information sciences | 22.0 | 18.2 | 11.6 | 9.6 | 4.5 |
| Architecture, engineering, and related technologies | 31.6 | 22.5 | 12.3 | 14.8 | 12.1 |
| Agriculture, natural resources and conservation | 19.0 | 19.1 | 13.8 | 12.1 | 8.3 |
| Health and Related Fields | 26.5 | 21.0 | 15.4 | 16.7 | 5.3 |
| Personal, protective and transportation services | 35.4 | 18.0 | 13.0 | Note x: suppressed to meet the confidentiality requirements of the Statistics Act | Note x: suppressed to meet the confidentiality requirements of the Statistics Act |
| Other instructional programs | Note x: suppressed to meet the confidentiality requirements of the Statistics Act | Note x: suppressed to meet the confidentiality requirements of the Statistics Act | 20.2 | 9.1 | Note x: suppressed to meet the confidentiality requirements of the Statistics Act |
| Industry of employment (in 2019) | |||||
| Agriculture, forestry, fishing and hunting | 28.2 | 19.4 | 24.2 | Note x: suppressed to meet the confidentiality requirements of the Statistics Act | Note x: suppressed to meet the confidentiality requirements of the Statistics Act |
| Mining, quarrying, and oil and gas extraction | 25.7 | 18.4 | 12.5 | 15.8 | Note x: suppressed to meet the confidentiality requirements of the Statistics Act |
| Utilities | Note x: suppressed to meet the confidentiality requirements of the Statistics Act | Note x: suppressed to meet the confidentiality requirements of the Statistics Act | 3.2 | Note x: suppressed to meet the confidentiality requirements of the Statistics Act | Note x: suppressed to meet the confidentiality requirements of the Statistics Act |
| Construction | 40.9 | 34.6 | 26.9 | 24.1 | Note x: suppressed to meet the confidentiality requirements of the Statistics Act |
| Manufacturing | 29.7 | 26.3 | 16.4 | 13.0 | 7.7 |
| Wholesale trade | 23.5 | 20.7 | 13.5 | 10.1 | Note x: suppressed to meet the confidentiality requirements of the Statistics Act |
| Retail trade | 37.6 | 38.7 | 30.4 | 29.8 | Note x: suppressed to meet the confidentiality requirements of the Statistics Act |
| Transportation and warehousing | 27.8 | 28.2 | 24.8 | 21.1 | Note x: suppressed to meet the confidentiality requirements of the Statistics Act |
| Information and cultural industries | 23.1 | 19.1 | 13.5 | 9.2 | 20.0 |
| Finance and insurance | 15.0 | 10.5 | 7.0 | 4.6 | Note x: suppressed to meet the confidentiality requirements of the Statistics Act |
| Real estate and rental and leasing | 34.4 | 28.6 | 31.1 | 29.6 | Note x: suppressed to meet the confidentiality requirements of the Statistics Act |
| Professional, scientific and technical services | 30.0 | 24.2 | 17.2 | 15.1 | 12.0 |
| Management of companies and enterprises | 26.7 | 15.4 | 10.4 | 3.4 | Note x: suppressed to meet the confidentiality requirements of the Statistics Act |
| Administrative and support, waste management and remediation services | 33.3 | 34.2 | 27.0 | 27.1 | Note x: suppressed to meet the confidentiality requirements of the Statistics Act |
| Educational services | 43.2 | 27.1 | 16.5 | 11.4 | 5.7 |
| Health care and social assistance | 37.4 | 21.3 | 19.7 | 16.6 | 10.0 |
| Arts, entertainment and recreation | 59.1 | 64.0 | 52.3 | 43.2 | Note x: suppressed to meet the confidentiality requirements of the Statistics Act |
| Accommodation and food services | 63.2 | 66.7 | 63.5 | 66.7 | Note x: suppressed to meet the confidentiality requirements of the Statistics Act |
| Other services (except public administration) | 42.4 | 39.5 | 24.8 | 14.5 | Note x: suppressed to meet the confidentiality requirements of the Statistics Act |
| Public administration | 11.1 | 6.4 | 5.5 | 3.7 | 4.4 |
|
x suppressed to meet the confidentiality requirements of the Statistics Act Notes: As a result of limited data availability, these estimates exclude college graduates for the following provinces and territories: Ontario, New Brunswick, Manitoba, Territories. Graduates 65 years of age or older in the year of graduation (2010) are excluded from the graduate population used in this table. Graduates who were less than 65 in 2010, but more than 65 years old or older in 2020 are excluded. The industries are defined using the North American Industry Classification System (NAICS) for Canada (for more information, see Statistics Canada’s industry classification). Sources: Statistics Canada, Postsecondary Student Information System (PSIS), 2009/2010 to 2018/2019 and Emergency and recovery benefits, March 2020 to September 2020. |
|||||
- Date modified: