
Income Research Paper Series
Construction of a Northern Market Basket Measure of poverty for Nunavut
Skip to text
Text begins
As stated in the Poverty Reduction Act, the Market Basket Measure (MBM) is now Canada’s Official Poverty Line.

This discussion paper describes the proposed methodology for a new Northern Market Basket Measure (MBM-N) for Nunavut which builds on the existing MBM-N methodology for Yukon and the Northwest Territories.Note The methodology proposed in this discussion paper is for the construction of a 2018-base MBM-N for Nunavut. However, there will be a comprehensive review of the MBM and the MBM-N methodologies, which is expected to occur in 2023.Note
The paper presents initial MBM-N thresholds and provides preliminary poverty estimates for reference years 2018 to 2021. In addition, it presents the thresholds for 2022 reference year. A review period will follow the release of this paper, during which Statistics Canada and Employment and Social Development Canada (ESDC) will welcome feedback from interested parties and work with experts, stakeholders, Inuit Organizations, and federal, provincial, and territorial officials to validate the results.
The MBM-N Nunavut methodology proposed in this paper is derived from the MBM methodology currently applied in the provinces and the MBM-N methodology applied in the other two territories. For example, the Nunavut MBM-N’s transportation component includes similar adaptations to those that were made for the fly-in communities in the Northwest Territories’ MBM-N. Following the existing MBM methodologies, its construction is comprised of the same five major components (e.g., food, clothing, transportation, shelter and other necessities) with a proposal to include a separate component unique to the Nunavut MBM-N. This new component would represent the costs associated with activities linked to the preservation of Inuit knowledge, culture, traditions and way of life. In general, the MBM-N for Nunavut is intended to capture the spirit of the existing MBMs (i.e., to represent a modest, basic standard of living) while accounting for adjustments needed to reflect life in Nunavut.Note
Acknowledgements
This discussion paper would not have been possible without the invaluable contributions from the Government of Nunavut’s Department of Family Services and Nunavut Tunngavik Incorporated (NTI). We would like to thank them for their support and time in helping create the methodology for the Nunavut MBM-N, and for their help with reviewing this paper.
In addition, the country food and harvesting methodology of the food component would not have been possible without the expertise and assistance of the Office of Nutrition Policy and Promotion at Health Canada.
Finally, we are grateful for the guidance and feedback we received by participants at the 2019 and 2022 Nunavut Roundtables on Poverty Reduction.Note
Introduction
On August 21, 2018, the Government of Canada released Opportunity for All, Canada’s First Poverty Reduction Strategy, which outlined activities and long-term commitments to guide current and future government actions and investments to reduce poverty. The Poverty Reduction Act legislated key commitments made in the Strategy, including the adoption of the MBM as Canada’s Official Poverty Line.
As part of its Data and Measurement Plan, Opportunity for Allspecified that Statistics Canada would explore the feasibility of producing MBM thresholds for the territories so that Canada’s Official Poverty Line could be calculated for Canada’s territorial residents. To this end, Statistics Canada first developed a methodology for Yukon and the Northwest territories, Construction of a Northern Market Basket Measure of poverty for Yukon and the Northwest Territories, and continued to work collaboratively with the Government of Nunavut (GN) to identify what specific changes, compared to the existing MBM and the MBM-N for Yukon and the Northwest Territories, would need to be considered in order to construct MBM-N thresholds for Nunavut.
Similar to the MBM-N for Yukon and the Northwest Territories, foundational work for the Nunavut MBM-N originates from a 2012 study by an informal working groupNote that assessed the technical feasibility of developing a MBM-N for the territories. For the Nunavut MBM-N, this seminal work was further built upon by discussions held during both the 2019 and the 2022 Nunavut Roundtable for Poverty Reduction.
Working with Indigenous peoples
In Opportunity for All, the government of Canada committed to “work[ing] with National Indigenous Organizations and others to identify and co-develop indicators of poverty and well-being, including non-income-based measures of poverty, that reflect the multiple dimensions of poverty and well-being experienced by First Nations, Inuit and Métis.”Note The development of the MBM-N methodologies complements these ongoing efforts.
The government is working to better understand poverty and well-being from the perspective of Indigenous peoples and Nunavummiut Inuit in particular. There are ongoing efforts to encourage the co-development of complementary indicators of poverty and well-being, including non-income-based measures of poverty, that reflect the multiple dimensions of poverty and well-being experienced by Nunavummiut Inuit. Given that the majority of Nunavut’s population reports having an Indigenous identityNote , integrating such additional indicators of poverty in analyses is particularly important.
Start of text boxIn 2010, the Government of Nunavut and Nunavut Tunngavik Incorporated agreed to co-sponsor a public engagement process to create a poverty reduction action plan and form the Nunavut Roundtable for Poverty Reduction. In 2011, The Makimaniq Plan: A Shared Approach to Poverty Reduction was released, describing poverty reduction measures grouped in themes and actions faithful to the priorities identified in the public engagement process. The Makimaniq Plan II is its successor.
The Makimaniq Plan II expresses Roundtable members’ shared understanding of how poverty can be reduced in Nunavut. There is an emphasis in The Makimaniq Plan on healing, reconciliation and empowerment as principal areas of action to reduce poverty. It identifies eight long term outcomes to work towards in addressing the complex and overlapping challenges of poverty.
At the heart of The Makimaniq Plan II is the belief that to address the systemic causes of poverty in Nunavut, we must all work together more often and more effectively. It defines poverty, as a situation that exists today in Nunavut when people cannot access the supports they need to maintain their connection to the land or to participate fully in the wage-based economy.
The MBM methodology is not intended to create a prescriptive and inflexible basket of goods and services. While changes to the MBM-N for Nunavut have been proposed to better reflect the needs of the Inuit population, the underlining concepts are based on non-Indigenous standards and constructs. As is the case with the other MBMs, it is important to remember that the overall cost associated with each component should be validated and not the individual enumerated items themselves.
Summary of proposed MBM-N Nunavut methodology
It is proposed that the MBM-N for Nunavut establishes poverty thresholds based on the cost of a “basket” for the same five components found in the other MBMs (i.e., food, clothing, shelter, transportation, and other necessities), with the addition of a separate “inuusiqattiarniq” component.Note The inuusiqattiarniq component would only be applied to Indigenous families.Note As is done with the other MBMs, families with disposable incomes less than their applicable thresholds, given their family size and region of residence, will be considered living in poverty. The following is the proposed methodology for a 2018-baseNote MBM-N for Nunavut. Additional details on these proposals are described in Appendix A: Proposed methodology for the Nunavut MBM-N regions, family size, components and disposable income.
Start of text boxAn Inuit Nunangat specific Market Basket Measure (MBM-IN) is currently being developed by Inuit Tapiriit Kanatami (ITK), and is described in the paper Cost of Living Index Development and Economic Analysis for Poverty Reduction in Inuit Nunangat (a copy can be requested by contacting ITK at: info@itk.ca) While there are similarities between Statistics Canada’s proposed MBM-N for Nunavut and this measure, the two serve different objectives and are built for two different populations.
Notable differences between the MBM-N for Nunavut and ITK’s MBM-IN include: shelter component calculations, the MBM-N for Nunavut has a larger reference family size and a Nunavut specific basket component (i.e., the inuusiqattiarniq component), different methodologies to account for traditional clothing and country food, and the data used to estimate poverty thresholds. These differences make basket cost and poverty estimate comparisons difficult.
The existence of varying methodologies can help promote discussions. Therefore, we encourage readers to consider the MBM-IN methodology when reviewing the MBM-N methodology for Nunavut.
Nunavut MBM-N regions
It is proposed that the Nunavut MBM-N provides poverty thresholds for four regions across Nunavut: one for Iqaluit and three additional geographies.Note Under guidance from the representatives from the GN, the development of the Nunavut MBM-N regions responds to the need for sufficient detail on price differences across communities, while keeping price measurement requirements within reasonable parameters.Note
Reference family
To reflect relatively larger and younger families in NunavutNote , compared to the rest of the country, it is proposed to increase the size of the MBM-N Nunavut reference family to a five-person family by adding a four-year-old girl.Note The age and gender were chosen to demonstrate the younger population, and were required to get, for example, the proper nutritional guidelines for adding an extra person to the family. Adjustments to other family sizes will continue to use the square root equivalence scale.
Summary of proposed methodology for the Nunavut MBM-N basket
Shelter component
The proposed methodology for the Nunavut MBM-N shelter component would be based on the rental of a three-bedroom dwelling, in-line with the National Occupancy StandardNote set out by the Canada Mortgage and Housing Corporation (CMHC). The rental prices for a dwelling would be derived from the 2016 Census data and adjusted to the 2018 base year.Note
Clothing and footwear component
The proposal for the clothing and footwear component would be to base it on the Social Planning Council of Winnipeg and Winnipeg Harvest’s 2012 Acceptable Living Level (ALL) for the Nunavut MBM-N reference family, while making adjustments to account for the colder climate in the territory and for the inclusion of traditional clothing.
Food component
The food component would be based on Health Canada’s 2019 National Nutritious Food Basket (NNFB). This food list would be modified to reflect Nunavut MBM-N reference family and to include country food and harvesting.
Transportation component
The transportation methodology would be similar to the one used for the fly-in communities of the Northwest Territories under the MBM-N methodology. It would have the costs associated with owning, maintaining, and operating both an all-terrain vehicle (ATV) and a snowmobile.
Other necessities component
The other necessities component costs would use a multiplierNote which would be applied to the food and clothing costs. This is a similar costing methodology used for the other MBMs. An amount would also be added to reflect the widespread need for cellular telephone services.
Inuusiqattiarniq component
An additional component is being proposed for the Nunavut MBM-N, called the inuusiqattiarniq component. Feedback from previous working groups and roundtables identified this component as central to the creation of a Nunavut MBM-N methodology to capture an estimate of costs of goods and services required to preserve Inuit knowledge, culture, traditions and way of life. Given the importance of maintaining and promoting these elements, these costs would be presented in a separate component from the typical five components found in the other MBMs. The inuusiqattiarniq component costs would use a multiplier based on expert judgement from Statistics Canada, ESDC and the GN, and be informed by multiple data sources. It would only be added to the cost of the basket for families with at least one adult member reporting an Indigenous identity on the Canadian Income Survey (CIS).
Indexation
As the “all-items” index is the lowest product level index category publicly available for Nunavut, it is proposed that it be used to adjust all the components of the MBM-N Nunavut basket for inflation.Note
Summary of proposed methodology for calculating Nunavut MBM-N’s disposable income
Defining disposable income
Nunavut’s MBM-N definition of disposable income would mirror the 2018-base methodology found in the provincial MBM and the MBM-N for the other two territories, except for a small change to the TTAs discussed below. Specifically, the MBM-N methodology for Nunavut would define disposable income as total income (including government transfers) after deducting not only income tax, but also several non-discretionary expenses (e.g., contributions to the Canada Pension Plan and Employment Insurance, union dues, childcare expenses, support payments paid, etc.).
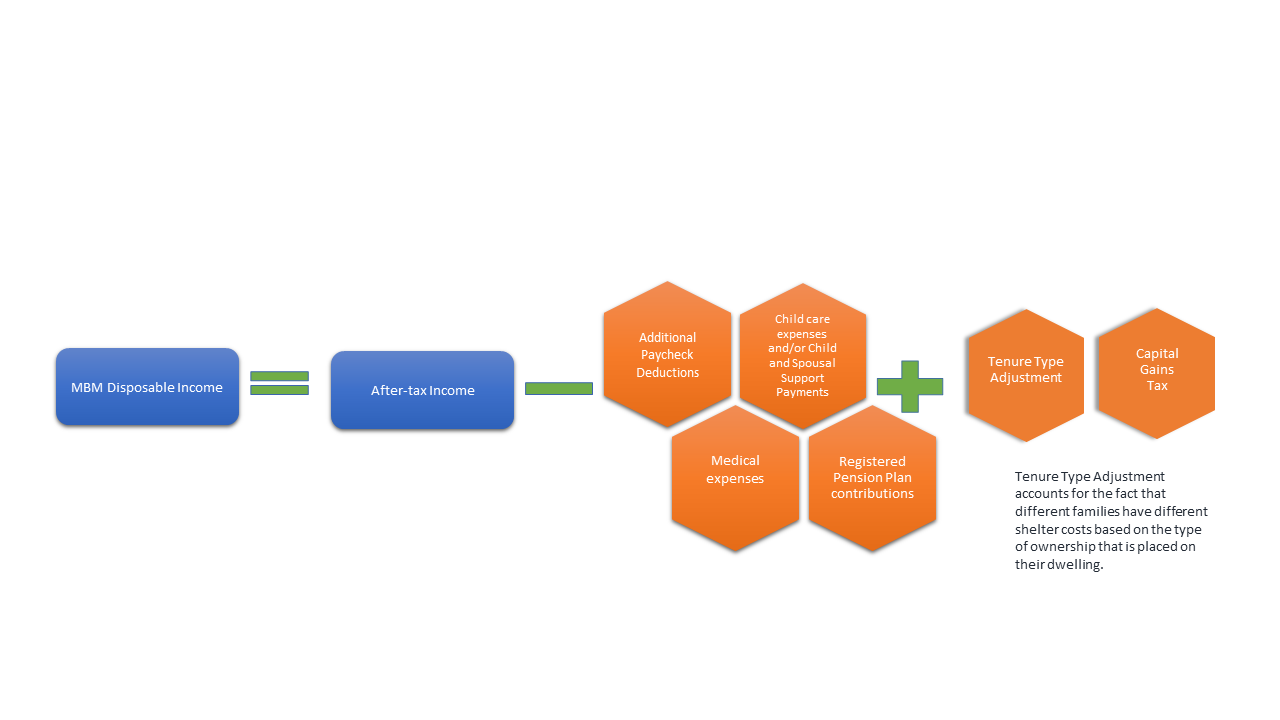
Description for Figure 1
Figure 1 provides a visualization of the disposable income calculation for the Northern Market Basket Measure. On the left of the equal assign is a blue rounded box with MBM Disposable Income written inside it. On the right of the equal sign is a blue rounded box with After-tax Income written inside it. Followed by a negative sign and four orange hexagons, with each hexagon having one of the following written inside it: Additional Paycheck Deductions; Child care expenses and/or Child and Spousal Support Payments; Medical expenses; Registered Pension Plan contributions. Followed by a plus sign and two orange hexagons, with each hexagon having one of the following written inside it: Tenure Type Adjustment; Capital Gains Tax.
There is a note in the bottom right that reads: Tenure Type Adjustments account for the fact that different families have different shelter costs based on the type of ownership that is placed on their dwelling.
The source for the figure is Statistics Canada.
Tenure Type Adjustment (TTA)
The Tenure Type Adjustment (TTA) that was done in the 2018 methodology for the provinces and the other two territories is repeated in Nunavut. A small change is required due to sample size. The TTA is only possible for two regions, those living in Iqaluit and those living outside of Iqaluit, unlike the other MBMs where each region had its own TTA. As it is done with the other MBMs, the TTA would add the difference between the cost of the shelter component found in the Nunavut MBM-N basket and the typical shelter costs for the other tenure types to the disposable income of families with the corresponding tenure type.
Medical expense imputation amounts
Medical expenses are derived directly from administrative tax data. When no medical expense data is available, a value would be imputed using territorial data from the Survey of Household Spending (SHS).
Nunavut MBM-N thresholds and poverty rates
In this section we describe the MBM-N thresholds and poverty rates obtained with the proposed methodology for Nunavut. These results should be treated as preliminary given that the review phase of this discussion paper is not complete.
The thresholds presented in Table 1 are developed for the five-person reference family (two adultsNote and three childrenNote ) and include a component cost unique to Nunavut, the inuusiqattiarniq component. These two modifications need to be considered when comparing the thresholds to the other MBM-N thresholds. The reference family approach is different to the one used in the MBM for the provinces and in the MBM-N for Yukon and the Northwest Territories. In order to compare the Nunavut MBM-N thresholds to the provincial MBM thresholds and other territorial MBM-N thresholds, the inuusiqattiarniq component must be removed and they must be adjusted to a four-person family size using the square root equivalence scale methodology [i.e., multiplying the thresholds by ]. The equivalence scale method is commonly used to adjust low-income thresholds (e.g., Low Income Measure) to different family sizes and is recommended for use in poverty measurement.Note
Table 1 shows the preliminary Nunavut MBM-N thresholds for a five-person family for each of the MBM-N Nunavut regions under the proposed methodology for the 2018 to 2022 reference years. While the thresholds presented in Table 1 include the inuusiqattiarniq component cost, they were only applied to Indigenous families when determining their poverty status.Note For non-Indigenous families, the thresholds applied to determine the poverty status of a family excluded the inuusiqattiarniq component. In general, even after considering the larger family size, the MBM-N thresholds for Nunavut are the highest in the country. For example, currently the highest threshold outside of Nunavut is in the Sahtu region of the Northwest Territories at $72,526 in 2018 current dollars, which is $26,657 less expensive compared to the most expensive Iqaluit threshold, after adjusting the Nunavut MBM-N’s five-person threshold to a family size of four using the equivalency scale for comparison purposes ($99,183). For a comparison of selected MBM and MBM-N thresholds please see Table H in the Appendix.
| MBM-N Geography | 2018 | 2019 | 2020 | 2021 | 2022 |
|---|---|---|---|---|---|
| current dollars | |||||
| Region | |||||
| Baffin, excluding Iqaluit | 105,953 | 107,757 | 107,757 | 109,233 | 113,498 |
| Kivalliq | 92,981 | 94,564 | 94,564 | 95,859 | 99,601 |
| Kitikmeot | 98,864 | 100,548 | 100,548 | 101,925 | 105,904 |
| Iqaluit | 110,890 | 112,778 | 112,778 | 114,323 | 118,786 |
|
Note: MBM-N thresholds are preliminary. Source: Statistics Canada. Custom tabulation. |
|||||
The higher thresholds in Nunavut are mainly due to higher costs in the shelter and food components. The more expensive food and clothing components also consequently increased the costs for the other necessities components, which is derived through a multiplier applied to both food and clothing costs. Finally, additional costs associated with maintaining and promoting Inuit culture, captured through the proposed inuusiqattiarniq component, contribute to increase total threshold costs by about $7,000.
In 2018, the communities located in the Kivalliq Region ($92,981) and Kitikmeot Region ($98,864) had the lowest Nunavut MBM-N thresholds based on a five-person reference family. Nunavut’s capital, Iqaluit, had the highest threshold at $110,890, while those communities in the Baffin Region excluding Iqaluit had the second highest at $105,953.
Table 2 shows the poverty rates for 2018 to 2021 as measured using the CIS and the proposed Nunavut MBM-N thresholds, for Nunavut, and by selected age groups and family types.Note According to the Nunavut MBM-N, the preliminary poverty rate went down from 43.2% in 2018 to 39.7% in 2021 in Nunavut. For the preliminary estimates on the number of persons in poverty, please see Appendix B. Estimates for small domains should be used with caution (For more information see text box Survey error within territorial estimates).
| Persons in poverty | ||||||||||||
|---|---|---|---|---|---|---|---|---|---|---|---|---|
| 2018 | 2019 | 2020 | 2021 | |||||||||
| percent | ||||||||||||
| Lower bound |
Estimate | Upper bound |
Lower bound |
Estimate | Upper bound |
Lower bound |
Estimate | Upper bound |
Lower bound |
Estimate | Upper bound |
|
| Geography | ||||||||||||
| Nunavut | 37.9 | 43.2 | 48.4 | 32.2 | 38.7 | 45.3 | 27.8 | 37.5 | 47.1 | 31.8 | 39.7 | 47.6 |
| Age group | ||||||||||||
| Persons under 18 years | 45.5 | 53.9 | 62.3 | 35.9 | 45.0 | 54.2 | 32.5 | 47.9 | 63.4 | 33.4 | 46.5 | 59.6 |
| Persons 18 to 64 years | 31.7 | 36.2 | 40.7 | 29.5 | 35.5 | 41.6 | 24.1 | 32.0 | 39.8 | 27.2 | 36.1 | 44.9 |
| Persons 65 years and over | 29.6 | 43.1 | 56.6 | 11.2 | 26.8 | 42.5 | Note F: too unreliable to be published | Note F: too unreliable to be published | Note F: too unreliable to be published | Note F: too unreliable to be published | Note F: too unreliable to be published | Note F: too unreliable to be published |
| Family Type | ||||||||||||
| Persons in economic families | 38.0 | 44.2 | 50.4 | 30.7 | 37.9 | 45.2 | 26.3 | 36.8 | 47.3 | 29.6 | 39.0 | 48.3 |
| Persons not in an economic family | 16.8 | 32.2 | 47.6 | 36.4 | 47.3 | 58.2 | 25.1 | 44.4 | 63.8 | 20.4 | 46.6 | 72.9 |
F too unreliable to be published
Source: Canadian Income Survey, Statistics Canada. Custom tabulation. |
||||||||||||
Similar to the poverty estimates for Yukon and the Northwest Territories, the poverty estimates for Nunavut should be used in combination with their respective quality indicators. As these estimates are derived from a survey, they are subject to survey error.
In this paper the quality indicator chosen was to provide the upper and lower bounds of the 95% confidence interval.
For more information on measuring survey error and the importance of considering an estimate’s quality indicator, please see the Measuring survey error and Survey error within territorial estimates sections of Construction of a Northern Market Basket Measure of poverty for Yukon and the Northwest Territories.
On average, from 2018 to 2021, childrenNote experienced a larger decrease in their poverty rate compared to non-senior adults.Note Over the same period, the poverty rate of persons living in economic families has decreased, while the poverty rate of unattached individuals (i.e., persons not in an economic family) has increased. None of the changes in Table 2 were statistically significant.
The poverty rates presented in Table G.1 of the Appendix show the impact of not including the inuusiqattiarniq component. The corresponding number of persons in poverty can also be found in the Appendix (Table G.2). These estimates are presented to evaluate the impact that this unique component would have on the poverty rates.
A Nunavut MBM-N forward-looking research agenda
Several research topics were identified during the creation of the proposed Nunavut MBM-N methodology. Given their complexity and uncertain feasibility in implementation, these specific topics will require further study before the next MBM-N rebasing exercise.Note
Community level sharing: While the MBM-N for Nunavut accounts for other sources of food (i.e., country food), it does not account for community sharing of country food nor shared resources like country freezers. Statistics Canada will research possible approaches to account for community level sharing of country food resources.
Second-hand clothing: The MBM methodology assumes purchases of all new clothing, because second-hand clothing items typically do not guarantee adequacy, availability or quality of clothing. Given the large second-hand market in Nunavut, Statistics Canada will research the feasibility of including pricing to reflect the presence of second-hand markets for a future Nunavut MBM-N.Note
In-kind benefits: While a certain level of in-kind income (e.g., home production of food) has been incorporated in the Nunavut MBM-N, Statistics Canada will research if is it possible to include other non-cash or in-kind benefits (e.g., goods and services produced for barter).
Conclusion
This discussion paper describes the proposed MBM-N methodology for Nunavut. It provides and compares provisional Nunavut MBM-N thresholds and poverty rates, which were the result of collaboration between Statistics Canada, ESDC, and representatives for the GN and NTI.
The paper has also proposed three topics in a forward-looking research agenda for the Nunavut MBM-N that Statistics Canada and ESDC intend to study in preparation for the next comprehensive review, scheduled for 2023.
It is important to note that the fundamental purpose of this paper is to foster engagement with key stakeholders on the proposed methodology. Therefore, following the release of this paper, there will be a review period during which Statistics Canada and ESDC will engage with experts, stakeholders, Indigenous organisations, and federal, provincial and territorial officials to help validate the results. The review period is expected to end in the fall of 2023. We encourage readers to contact us to share their views, suggestions and feedback by sending an email to:
statcan.market.basket.measure-mesure.du.panier.de.consommation.statcan@statcan.gc.ca
If access to email is impractical or not possible, we can also be reached by contacting Statistics Canada’s general enquiries line:
Appendix A: Proposed methodology for the Nunavut MBM-N regions, family size, components and disposable income
Proposed methodology for the Nunavut MBM-N regions
Under guidance from the representatives from the GN, the Nunavut MBM-N regions were based, where appropriate, on the census division boundaries, while also taking into consideration other similarities between communities in order to make logical geographical groupings. The intent is to have the most detailed price differentials for goods and services for the communities, while keeping price measurement within reasonable parameters. It is proposed that the MBM-N provides poverty thresholds for four regions across Nunavut: one for the territorial capital and three additional geographical groupings.
Specifically, it is proposed that the Nunavut MBM-N thresholds be defined for Iqaluit, Baffin region excluding Iqaluit, the Kivalliq region, and the Kitikmeot Region.Note
There are several issues that make measuring poverty in Nunavut particularly challenging, especially for geographies outside of the capital. These challenges can impact both the expenditure and income sides of the Nunavut MBM-N methodology. For example, the logistical challenges of isolated communities with limited infrastructure can impact the availability of food and clothing price collection when estimating the Nunavut MBM-N basket costs. Similar logistical challenges, along with the need to protect the confidentiality of survey respondents, can impact the availability of income data. For example, the income source for the annual poverty estimates is the CIS which excludes households in remote areas with a very low population density. Although this impact is smallNote , it is important to note because the excluded areas are composed primarily of Inuit people.Note
Proposed methodology for the Nunavut MBM-N reference family
The methodology for the MBM requires defining a reference family before defining a basket of goods and services. In the current MBM for the provinces and the other two territories, the reference family is defined as one male and one female adult aged 25-49 with two children (a girl aged 9 and a boy aged 13). Given that families in Nunavut are on average larger and younger, it is proposed that the typical MBM reference family be increased by adding a 4-year-old girl.
To arrive at thresholds for different family sizes, the MBM-N methodology for Nunavut will continue to use a square root equivalence scale, which is used in the other MBMs. This equivalence approach is a widely accepted method to adjust incomes for family size differences and is recommended for use in poverty measures (UNECE, 2011).Note To compute thresholds for different family sizes, values from Table A.1 can be used.
| Family size |
Square root scale |
Multiply the threshold value by |
|---|---|---|
| 1 | 1.0 | 0.4 |
| 2 | 1.4 | 0.6 |
| 3 | 1.7 | 0.8 |
| 4 | 2.0 | 0.9 |
| 5 | 2.2 | 1.0 |
| 6 | 2.4 | 1.1 |
|
Note:
corresponds to the square-root of the reference family size Source: Statistics Canada. Custom tabulation. |
||
This method of equivalizing thresholds for different family sizes should only be applied to the total threshold value and should not be applied to threshold’s individual components.Note
Proposed methodology for the Nunavut MBM-N basket
The MBM-N basket for Nunavut consists of the five typical components (e.g., clothing, food, shelter, transportation and other necessities), plus an additional inuusiqattiarniq component used to capture costs associated with preserving Indigenous knowledge, culture and traditions, community wellbeing and way of life. In general, the five typical components found in the MBM, and the MBM-N for Yukon and the Northwest Territories would be adapted to reflect life in Nunavut, while the additional inuusiqattiarniq component is unique to the MBM-N for Nunavut.Note
Clothing and footwear component
The Nunavut MBM-N clothing and footwear component is based on the 2012 Social Planning Council of Winnipeg and Winnipeg Harvest Acceptable Living Level (ALL) Basket, with several adjustments to account for the colder climate in Nunavut and for the inclusion of traditional clothing. The ALL clothing and footwear list was adapted for use in the Nunavut MBM-N by specifying the quantity, quality, and replacement schedule for each of the items required by the Nunavut MBM-N reference family (i.e., two adults and three children). In general, it provides clothing and footwear for most common work, school and social occasions.

Depending on the MBM-N region and taking into account purchasing practices, prices were collected from stores in Yellowknife (for Kitikmeot), Winnipeg (for Kivalliq) or a combination of Iqaluit and Ottawa (for Baffin excluding Iqaluit, Iqaluit) for the 2018 base year. The arithmetic average of the three lowest price observations for the year was calculated for each item in the basket. In addition, a three-year average of each item’s annual price was taken to ensure that price volatility was minimized. These prices, combined with specified quantities and replacement schedules, derived the cost of the clothing component. In general, the pricing methods for the Nunavut MBM-N are similar to the other MBMs.Note
In order to adapt to the specific needs of Nunavut, it is proposed that several adjustments be made to the ALL clothing and footwear list. During the consultation process of 2012 MBM-N feasibility study, it was proposed that certain items found in the ALL clothing basket were unnecessary or not typically used in the territory, and therefore should be removed. Conversely, new items were to be added.
| MBM-N Geography | 2018 | 2019 | 2020 | 2021 | 2022 |
|---|---|---|---|---|---|
| current dollars | |||||
| Region | |||||
| Baffin, excluding Iqaluit | 7,300 | 7,424 | 7,424 | 7,526 | 7,820 |
| Kivalliq | 6,017 | 6,120 | 6,120 | 6,204 | 6,446 |
| Kitikmeot | 6,027 | 6,129 | 6,129 | 6,213 | 6,456 |
| Iqaluit | 6,034 | 6,137 | 6,137 | 6,221 | 6,464 |
|
Note: MBM-N thresholds are preliminary. Source: Statistics Canada. Custom tabulation. |
|||||
Also, it is proposed that the replacement schedule (i.e., the lifespan of clothing items) for certain items be adjusted. Following the MBM-N methodology for Yukon and the Northwest Territories, an adjustment would be made to the replacement schedule, to account for the higher use of winter clothes in the territory.
Using Environment and Climate Change Canada temperature data from Winnipeg, the city where the 2012 ALL basket is based, and comparing it to Iqaluit temperature data, an adjustment ratio was created.Note It is proposed that this ratio be used to adjust the 2012 ALL clothing basket replacement schedule for summer and winter clothes. For example, this ratio would increase how often a family would need to replace typical winter items like scarfs and toques, while decreasing how often they would need to replace typical summer items like bathing suits (see text box - Perceived subjectivity in the MBM).
Both of these adjustments reflect the need for warmer clothes in the territory, particularly during the winter months, as well as the more frequent use of certain items due to the cold climate.Note
Start of text boxThe itemized list of clothing or food items are sometimes met with criticism, since there is a perceived subjectivity in its creation. For example, the changes made to the clothing item list might seem subjective and restrictive, but they should not be viewed as prescriptive and inflexible. They are not meant to be a detailed list of items a family must buy. Rather, they are meant to represent the clothing and footwear components that are reasonable for the reference family.
A similar consideration should be taken into account when examining the food component.
Unique to the MBM-N for Nunavut, it is proposed that the clothing component also include costs associated with traditional clothing, since traditional clothing items are culturally important to Nunavut inhabitants and are typically warmer than non-traditional clothing. In addition, it is proposed that all winter outerwear be replaced by traditional clothing items.Note The proposed methodology for traditional clothing would be to assume the material (e.g., furs, thread, etc.) and labour costs would be represented by the selling price of the traditional clothing items and, therefore, would be included in the clothing and footwear component. While the costs associated with the equipment needed to make traditional clothing items (e.g., sewing machines, scissors, patterns, etc.) would be accounted for in the inuusiqattiarniq component. This change allows for more comparability with the other MBMs’ clothing components outside of Nunavut.Note
Prices were collected for traditional clothing items using available sources (e.g., Facebook Marketplace, iValu, etc.), but it was not possible to gather a robust sample of prices using this collection method. Therefore, the prices for non-traditional clothing items that were deemed acceptable for the Nunavut climate were used as proxy prices for the traditional clothing items. For example, instead of pricing sealskin boots, the proposed methodology would price Baffin boots, as they are often worn in Nunavut and there are more observable prices.
Given the higher quality and inherent ability to be repairable, the replacement schedule for the traditional clothing items was adjusted to reflect a longer lifespan and a repair cost (e.g., replacing the liner in a parka, etc.) was included. Note
For estimating costs in areas outside of the capital, a weighted average method is being proposed, which incorporates the costs associated with travel to the designated regional centre(s) for clothing purchases and the cost of ordering online. The price of the trip to a regional center would include food at restaurants, hotel and plane tickets.Note The shipping cost associated with online purchases would be estimated on an annual basis, under the assumption of monthly bulk orders. The relative weights of purchasing methods would have a rural and urban delineation and would be based on the percentage of people in Nunavut with internet access, either at home or on a mobile device, and who have purchased physical goods or services onlineNote using the 2021 Northern Canada Internet Use Survey (NCIUS). Table A.2 shows the preliminary clothing and footwear component estimates for the Nunavut MBM-N regions.
Food component
The proposed food component MBM-N methodology for Nunavut differs slightly from the methodology used in the other provincial and territorial MBMs. It is being proposed to use a modified version of the 2019 National Nutritious Food Basket (NNFB) developed by Health CanadaNote to calculate the cost of the food component. The foods in the NNFB are consistent with the 2019 Canada’s Food Guide and are foods that Canadians reported consuming in the 2015 Canadian Community Health Survey-Nutrition (CCHS-Nutrition), the most recently available survey of food consumption (see text box - Perceived subjectivity in the MBM).

The 2019 NNFB includes fresh, frozen and canned food formats to balance considerations of cost, access and availability (see text box - Food insecurity in Nunavut). Additionally, 5% is added to the total cost of the basket for miscellaneous foods and beverages such as coffee, tea, herbs, spices and condiments.
Two modifications to the food component are being proposed to better reflect life in the territory. First, the food component would include additional quantities for the proposed fifth reference family member. Second, the items and quantities would be adjusted to include and account for the nutritional value provided by country food.
The first proposed modification would increase the quantities found in the NNFB so it would reflect the additional nutritional requirements needed for the proposed fifth reference family member (i.e., a girl aged 4).
Given the importance of maintaining Inuit culture and traditions and for practical requirements, the second proposed modification to the NNFB would be to include some hunted and harvested country foods. Health Canada worked in conjunction with GN nutritionists for the proposed inclusion of costs associated with hunting and harvesting for country food which is a unique addition to the MBM-N for Nunavut. Table A.3 shows the preliminary food component estimates for the Nunavut MBM-N regions.
| MBM-N Geography | 2018 | 2019 | 2020 | 2021 | 2022 |
|---|---|---|---|---|---|
| current dollars | |||||
| Region | |||||
| Baffin, excluding Iqaluit | 27,717 | 28,189 | 28,189 | 28,576 | 29,691 |
| Kivalliq | 23,704 | 24,107 | 24,107 | 24,438 | 25,392 |
| Kitikmeot | 26,717 | 27,172 | 27,172 | 27,544 | 28,620 |
| Iqaluit | 26,367 | 26,816 | 26,816 | 27,184 | 28,245 |
|
Note: MBM-N thresholds are preliminary. Source: Statistics Canada. Custom tabulation. |
|||||
It has been found that the intake of traditional foods amongst Indigenous peoples, even in small amounts, improves diet quality. Therefore, a selection of commonly consumed country foods, using various reviewed resources and discussions with Inuit partners, has been integrated in the proposed MBM-N. Examples of resources used to inform this process include the 2007 Inuit Health Survey and some findings of the Food Book study.Note It is proposed that the following country food items be included:
- Wild blueberries
- Beluga, muktuk
- Arctic char
- Ringed seal meat
- Caribou (Reindeer) meat
To incorporate country foods in the food component of the Nunavut MBM-N, the costs of nutritionally comparable market foods are used. When developing the methodology, the nutrient content of these comparable market foods was established using the values found in the 2015 Canadian Nutrient File. The protein and energy content of each country food were compared to the list of foods reported in the 2015 CCHS-Nutrition.Note Note
The differences between the protein and energy content of each country food and each food listed in the shortened 2015 CCHS-Nutrition list were calculated. The market food items that had the smallest sum of absolute differences were considered the most nutritionally comparable to the country foods.Note
These nutritionally comparable market foods were used for the costing calculation.
To determine the quantity of each food item included in the NNFB, the nutrient profiles of foods in the formats in which they are typically consumed were used (e.g., cooked meats, raw fruits, and cooked grains). However, when costing the basket, the amounts of foods were adjusted to convert their quantities from ‘as consumed’ to ‘as purchased’ (or ‘as hunted/foraged’). This accounts for changes in yield when people prepare foods at home. To support costing activities, a list of conversion factors was established for each country food item added to the 2019 NNFB, and for their comparable market food item.
When developing the methodology, the conversion factors found in the United States Department of Agriculture’s Food Intakes Converted to Retail Commodities DatabasesNote were used as the starting point. Most country foods did not have conversion factors available in the database. Therefore, estimates were calculated using foods from the database that were considered comparable. These estimates were developed by calculating the averages of the conversion factors of foods in the database. Assumptions were made on the cuts of meat, method of cooking, and most comparable market food for the various country foods added to the 2019 NNFB.
It is proposed that the store-bought price for the nutrient equivalents identified by Health Canada would then be used as a proxy price for the country food. A conceptual break is caused by this methodology, since income does not include consumption from own production (such as product from hunting, farming, or fishing) but it is included as a cost. In addition, by putting a market value on a traditional Inuit activity, this methodology applies a market-economy lens that does not align with Inuit traditional views. While both of these are valid criticisms of the methodology, there are undeniable costs (e.g., opportunity costs) associated with country food that should be considered.
Similar to what is being proposed in the clothing component, the additional equipment costs related to hunting and harvesting for country food (e.g., hunting attire, rifles, ammunition, additional gasoline, etc.) will be factored in the inuusiqattiarniq component.
Food prices were collected in 2018 by Statistics Canada in Iqaluit, the territorial capital. Monthly prices were collected from selected stores and then the geometric mean of each item was calculated in order to determine the annual price for Iqaluit. It should be noted, as with all the other components, that the MBM methodology does not prescribe individual food items that a person should consume, rather it is meant to estimate the typical cost of a nutritious diet for the reference family (see text box - Perceived subjectivity in the MBM).
The proposed methodology for estimating the food component costs outside of the capital would be to use an adjustment factor based on Statistic Canada’s Living Cost Differential (LCD) data and Nunavut Food Price Survey (NFPS) data. The spatial indexes would be derived by combining the LCD data and NFPS data, to create community level spatial indexes.Note These indexes would then be applied to the capital’s costs for the four main food categories that are found in the NNFB (i.e., vegetables and fruit, protein foods, whole grain foods, and unsaturated fats), which would be aggregated to calculate the food component cost for a specific community. Finally, the 2016 Census based population weights would be used to aggregate the community level food costs into the Nunavut MBM-N regions.
Start of text boxFood insecurity is a serious and long-standing issue in Nunavut. For example, based on the most recently available estimates from the 2021 Canadian Income Survey (CIS), 42.7% of people in Nunavut lived in moderately or severely food-insecure households. This is the highest rate of moderate or severe food insecurity among the provinces and territories.
There are also barriers to food access in the territory that go beyond the ability to buy store-bought food items. Due in large part to climate change and its effect on shortening hunting and harvesting seasons, as well as on reduced animal and crop yields, country food has become increasingly inaccessible, leading to adverse quality of life impacts among Nunavut residents.
While these are recognized and serious problems, the proposed MBM-N methodology for Nunavut is intended to measure monetary costs associated with a modest, basic standard of living. In this sense, the complex and interconnected factors that give rise to food insecurity and decreased access to food among Indigenous peoples cannot be fully reflected by this methodology.
Shelter component

It is proposed that the Nunavut MBM-N derives shelter costs for non-subsidized rental units using the 2016 Census, and that shelter costs include both rent and utilities (e.g., heat, water and electricity) as is being done with the other MBMs. The Census was chosen as the data source, because of its large sample size which allows for precise estimation of rental costs and covers all types of rental units, including those outside of the capital. The decision to cost non-subsidized rental units for the shelter component, even though the large majority of the population lives in subsidized rental units,Note was made because it better reflects the free rental market economy, without government interventionNote (i.e., which is available under no conditions).Note
As was done for the other MBMs, adjustments based on tenure type (subsidized rents and homeownership) would be used to ensure comparability between the basket costs and disposable income (see the Tenure Type AdjustmentSection in Appendix A for more information).
It is proposed that the Nunavut MBM-N adopts the National Occupancy Standard for the Nunavut reference family of one adult couple with three children (two girls aged 4 and 9 and a boy aged 13). Therefore, it would be based on the cost of a three-bedroom rental unit not in need of major repairs. Finally, collective dwellings and rent-free units are excluded (see text box - Housing in Nunavut).
To determine the cost for the shelter component it is proposed to use the average of the non-zero rental prices and utilities for non-subsidized renters of a three-bedroom rental unit with a household income in the first seven income deciles. The decision to use the first seven income deciles was made after careful analysis of the income distribution to ensure the quality of the estimates. In addition, an amount for tenant’s insurance is also proposed to be included. In consultation with representatives from the GN, it was determined that most of the rental units in the territory included appliances as part of the rent. Therefore, the Nunavut MBM-N shelter component would not include a separate category of expenses related to the purchase of appliances. Table A.4 shows the preliminary shelter component estimates for the Nunavut MBM-N regions.
Had subsidized rental units been represented on the basket side for the shelter component, the component costs would have been around 80% lower for Baffin, excluding Iqaluit, Kivalliq and Kitikmeot than those presented in Table A.4 and around 50% lower for Iqaluit. Note that in the MBM methodology, the estimated subsidy value is included in disposable income through the Tenure Type Adjustment (TTA).
| MBM-N Geography | 2018 | 2019 | 2020 | 2021 | 2022 |
|---|---|---|---|---|---|
| current dollars | |||||
| Region | |||||
| Baffin, excluding Iqaluit | 25,363 | 25,794 | 25,794 | 26,148 | 27,169 |
| Kivalliq | 25,363 | 25,794 | 25,794 | 26,148 | 27,169 |
| Kitikmeot | 25,363 | 25,794 | 25,794 | 26,148 | 27,169 |
| Iqaluit | 38,542 | 39,199 | 39,199 | 39,736 | 41,287 |
|
Note: MBM-N thresholds are preliminary. Source: Statistics Canada. Custom tabulation. |
|||||
The proposed methodology for estimating the shelter component costs inside and outside of the capital would be similar. Although, given the data limitations, it would only be possible to calculate one shelter cost for the three regions outside the capital, as opposed to separate shelter estimates for each region.
Start of text boxIt is widely recognized that there are a number of shelter challenges faced by people living in Nunavut (e.g., housing shortages, affordability, poor quality housing, high cost of home construction and repair and homelessness). And while there have been positive efforts in trying to mitigate these challenges (e.g., expanding federal and territorial funding for housing construction in Inuit communities and developing and implementing multi-year initiatives for expanding social housing), there is still a lot to be done.
The MBM-N shelter cost estimates are based on the National Occupancy Standard (NOS) standard set out by CMHC. They take into account the suitability of the dwelling when determining the number of bedrooms for the reference family. The MBM shelter’s estimates are based on dwellings that are habitable, by removing those that do not meet CMHC’s standard for the condition of the dwelling when calculating the shelter costs.
The shelter component’s estimates are based on the costs for observed dwelling units according to a standard, but it does not reflect the ongoing housing challenges in Nunavut. Although there are several indicators available to track the housing situation in Nunavut (e.g., according to the Census, the core housing need indicator for Nunavut was the highest in Canada but decreased from 36.5% in 2016 to 32.9% in 2021), the MBM shelter estimates are based on the observed rental costs on 2016 Census Day and assumes availability in the stock of dwellings.
Transportation component

The transportation component for the MBM-N Nunavut would follow a similar methodology to that of the fly-in communities in the Northwest Territories, while adjusting for conditions and costs unique to Nunavut. Specifically, the transportation component costs would be based on the costs associated with purchasing, operating and maintaining a new mid-quality range All-Terrain Vehicle (ATV) and a snowmobile. Due to a combination of limited road infrastructure, geographically isolated communities and weather conditions in Nunavut, residents tend to rely on a mixture of ATVs and snowmobiles. This represents a modest, basic standard of living among Nunavummiut.
The costs for the snowmobile and ATV were estimated using procurement costs from the GN’s 2017/2018 Procurement Activity Report and online contract reporting database for several communities throughout the territory. Population weights were then applied to each community’s reported ATV or snowmobile cost, to arrive at a weighted average cost of both a snowmobile and an ATV for each of the Nunavut MBM-N regions. Finally, these averages were then amortized to zero over an eight-year period, to provide annual cost estimates for the vehicle, for each region.
Operating costs for the vehicles would include one driver’s license for each of the adults based on data provided by Statistics Canada’s Consumer Prices Division (CPD). Through consultation with territorial partners, snowmobiles are typically not registered, so the transportation component for Nunavut would only include costs for the registration of the ATV using GN registration fee data. Insurance costs were estimated for ATVs by using an online insurance tool. While the quotes were collected in 2021, the “all-items” consumer price index for Iqaluit was used to adjust quotes to 2018 dollars. Finally, gasoline costs were estimated using the data from the GN Petroleum Products Division’s retail price list for 2018. The proposed methodology would cost 600 litres of gasoline, which assumes a fuel efficiency of the vehicles at about 17.5 L per 100 km and would allow for approximately 3,400 km of driving per annum.
Costs associated with maintaining the two vehicles would include the cost for one tune-up and one oil change for each vehicle type based on Iqaluit prices while the costs for the MBM-N Nunavut regions outside the capital would be adjusted in a similar fashion to what was done in the Northwest Territories. Specifically, the Iqaluit-based costs would be adjusted upward by 25%, to account for the higher maintenance costs found outside the capital. Finally, additional costs for tires, batteries, and parts for the two vehicle types were also collected in Iqaluit and were similarly adjusted upward by 25% for the three regions outside the capital. Table A.5 shows the preliminary transportation component estimates for the Nunavut MBM-N regions.
| MBM-N Geography | 2018 | 2019 | 2020 | 2021 | 2022 |
|---|---|---|---|---|---|
| current dollars | |||||
| Region | |||||
| Baffin, excluding Iqaluit | 10,497 | 10,676 | 10,676 | 10,822 | 11,245 |
| Kivalliq | 7,811 | 7,944 | 7,944 | 8,053 | 8,367 |
| Kitikmeot | 7,823 | 7,956 | 7,956 | 8,065 | 8,380 |
| Iqaluit | 7,332 | 7,457 | 7,457 | 7,559 | 7,855 |
|
Note: MBM-N thresholds are preliminary. Source: Statistics Canada. Custom tabulation. |
|||||
Other necessities component
The Nunavut MBM-N has a component that recognises the needs for other necessary goods and services that are not captured under the defined components. The methodology for pricing other goods and services does not utilize the pricing of items as other parts of the Nunavut MBM-N. Doing so would be difficult, as there is a large number of items that would potentially need to be priced, and many of the items would be considered necessities for some families but not for others. Accordingly, the other necessities component is meant to approximate average expenditures on a wide range of other goods and services, using a fixed ratio sourced from Statistics Canada’s Survey of Household Spending (SHS). Applying a fixed ratio has multiple advantages, such as: (1) It avoids undue focus on the usefulness of each individual expenditure item; (2) Reduces assumptions on how people spend their money, and (3) Offers more flexibility to meet the various needs of different family types.
In addition, it is proposed that an amount for cellular telephone services be priced separately and added to the other necessities component. The cellular telephone services amount would be based on the median territorial expenditure for the reference family with an income below the territorial median, based on SHS data.
The proposed methodology for the other necessities component in and outside of the capital would be the same. The 2018-base MBM multiplierNote would be applied to the food and clothing component thresholds for each of the MBM-N regions. Table A.6 shows the preliminary other necessities component estimates for the Nunavut MBM-N regions.
| MBM-N Geography | 2018 | 2019 | 2020 | 2021 | 2022 |
|---|---|---|---|---|---|
| current dollars | |||||
| Region | |||||
| Baffin, excluding Iqaluit | 28,061 | 28,539 | 28,539 | 28,930 | 30,059 |
| Kivalliq | 24,069 | 24,479 | 24,479 | 24,814 | 25,783 |
| Kitikmeot | 26,348 | 26,796 | 26,796 | 27,163 | 28,224 |
| Iqaluit | 26,091 | 26,535 | 26,535 | 26,899 | 27,949 |
|
Note: MBM-N thresholds are preliminary. Source: Statistics Canada. Custom tabulation. |
|||||
Inuusiqattiarniq component
During the engagement process to inform the Nunavut MBM-N methodology, feedback from stakeholders pointed to the importance of strengthening and maintaining local knowledge, culture, traditions and way of life as necessary conditions to living a life without poverty. As such, goods and services supporting these objectives are considered in a separate basket component alongside the other five components of the MBM.

The items in the inuusiqattiarniq component would be based on the Nunavut MBM-N reference family and only include costs incurred by residents of Nunavut. Based on the 2019 Nunavut Roundtable for Poverty Reduction, further outreach resulted in a suggestion that the following pillars should aim to inform the expenditures captured by the inuusiqattiarniq component: (1) Culture and language; (2) Healthy personal relationships; (3) Trauma services, and (4) Addiction treatment. The majority of costs associated with programs and activities that support these pillars are covered by different levels of government or community organizations (see text box - Program coverage). Programs and activities that are covered by public funding models (e.g., government grants) are not to be included in the Nunavut MBM-N basket, because they have no direct cost to the reference family.
Due to the nature of many of the pillars’ costs being covered through grants or other territorial or federal funding, the majority of the costs of this component are in relation to the culture and language pillar. Despite the grants, it was acknowledged that families in Nunavut still had out-of-pocket expenses which allowed them to engage in these activities. For example, not all cultural and language expenses are covered by a funding model, so an additional amount should be added.
Since enumerating and costing individual items deemed necessary to maintaining knowledge, language and cultural activities is highly impractical, general activities were identified instead. Through discussions with territorial representatives, out-of-pocket costs associated with the following activities are proposed to be included: (1) Equipment for the manufacturing of traditional clothing; (2) Equipment for hunting and preparing country food; (3) Children’s programming and programs promoting Inuit culture; and (4) Community support and engagement activities.Note
It is proposed that equipment costs associated with manufacturing traditional clothing (e.g., sewing machine, patterns, etc.) be included in the inuusiqattiarniq component. The costs associated with the pelts or the labour to produce the traditional clothing items are not included, since they are implicitly accounted for in the purchase price of the traditional clothing item (i.e., they are accounted for in the clothing component).
A similar proposal is planned for the costs associated with country food. The equipment costs related to hunting and harvesting for country food (e.g., hunting attire, rifles, ammunition, additional gasoline, etc.) will be included in the inuusiqattiarniq component. Labour costs associated with preparing the food or opportunity costs in going hunting would be implicitly included in the purchase price of the country food item (i.e., they are accounted for in the food component).
The inuusiqattiarniq component cost was only applied to Indigenous families when determining their poverty status.Note For the determination of poverty status among non-indigenous families, the inuusiqattiarniq component was removed.
Given the complexity of enumerating a list of items and the lack of sources for robust price or expenditure data for the territory, the inuusiqattiarniq component pricing methodology would be determined based on expert judgement. Informed by available data sourcesNote , a fixed multiplier, serving to approximate the overall cost for possible items that could potentially support the abovementioned activities, would be applied to the cost of the other necessities component to estimate thresholds for the inuusiqattiarniq component.Note Table A.7 shows the proposed inuusiqattiarniq component costs for the Nunavut MBM-N regions based on this approximation.
Start of text boxThe need to provide support for mental health, trauma and addiction services, and to maintain the Inuit way of life is a recognized necessity for all levels of government. The Government of Nunavut, National Indigenous Organizations and the Government of Canada all recognize the importance of providing support through a variety of methods (e.g., Income support programs, alcohol and drug counselling programs, mental health counselling, etc.) to assist in improving the lives of residents in the territory.
Maintaining the funding for the income support and quality of life programs is a key component in continuing to support poverty reduction efforts by all levels of governments. While there are substantial costs associated with these programs, any remaining direct costs incurred by the Nunavut MBM-N reference family will be accounted for by the inuusiqattiarniq component.
In addition to these government programs, there are numerous community level programs (e.g., “on the land” educational programs offered by schools, traditional clothing programs, hunting programs, etc.), but they are also mostly covered by different funding models. Any remaining costs for which the Nunavut MBM-N reference family is directly responsible would be accounted for by the inuusiqattiarniq component.
While there are no significant direct costs to the Nunavut MBM-N reference family, there are known problems with accessibility to services, both physically (i.e., specific health services not available within the region) and monetarily (i.e., services outside the region that may not be affordable, such as psychological/mental health services that are often not covered by insurance). The importance of these programs cannot be understated.
Also, if funding to these programs is cut or altered in the future, so that the reference family would now be responsible to pay all or a portion of the costs, the next rebasing for the Nunavut MBM-N would need to account for that change.
Finally, there could be a general lack of awareness of services and programming that meet all the needs of Inuit. There is some evidence that there are cultural norms that discourage direct verbal expression of complaint or even reduced expectations of what it means to be healthy, which is grounded in a variety of factors including longstanding barriers to adequate health care (Tungasuvvingat Inuit, 2017).
| MBM-N Geography | 2018 | 2019 | 2020 | 2021 | 2022 |
|---|---|---|---|---|---|
| Region | current dollars | ||||
| Baffin, excluding Iqaluit | 7,015 | 7,135 | 7,135 | 7,232 | 7,515 |
| Kivalliq | 6,017 | 6,120 | 6,120 | 6,204 | 6,446 |
| Kitikmeot | 6,587 | 6,699 | 6,699 | 6,791 | 7,056 |
| Iqaluit | 6,523 | 6,634 | 6,634 | 6,725 | 6,987 |
|
Note: MBM-N thresholds are preliminary. Source: Statistics Canada. Custom tabulation. |
|||||
Proposed methodology for the Nunavut MBM-N disposable income
For a family to be in poverty, their disposable income must be less than the basket threshold amount for their family size and region.
Disposable income is defined as total income (including government transfers) after deducting income tax, Canada Pension Plan and Quebec Pension Plan contributions, Employment Insurance and Registered Pension Plan contributions, union dues, childcare expenses, spousal support payments paid, etc.Note
It is proposed that the disposable income concept for Nunavut follows the 2018-base MBM methodology. Specifically, it will make adjustments, where possible, to account for other tenure types (i.e., owners with and without a mortgage and subsidized renters) and account for the implications associated with capital gains taxes.
Start of text boxAs stated in Opportunity for All, the Government of Canada recognizes that poverty is a multi-dimensional issue that cannot be fully captured by considering income and costs alone, as is done with the MBM. However, Statistics Canada and ESDC believe that the MBM is a key step towards capturing the link between low income and the other dimensions of poverty. For more information on the other dimensions of poverty being measured by the Government of Canada, please see Canada’s Official Poverty Dashboard which can be found on Dimensions of Poverty Hub.
Tenure Type Adjustment

As was done in the 2018-base MBM and for the MBM-N in Yukon and the Northwest Territories, it is proposed that the Nunavut MBM-N methodology would make an adjustment, where possible, for other housing tenure types other than rental dwellings, such as homeownership with or without mortgages and those residing in subsidized dwellings. This would serve to place families in all tenure types on a more equal footing to those families in non-subsidized rental units, when determining their poverty status. Although, given the limited amount of data needed to make estimates, the Tenure Type Adjustments (TTAs) would be defined only for the capital and the regions outside the capital altogether, as opposed to for each Nunavut MBM-N region like is done for the other MBMs.
Summary of the process
The tenure type adjustment would be obtained by subtracting the typical shelter costs of a specific tenure type from the shelter cost for non-subsidized renters derived during the construction of the basket. Using the 2016 Census, these TTA values are calculated for a three-bedroom unit for a five-person family with an income below the first seven income deciles for two Nunavut MBM-N regions, one for the capital and the three Nunavut MBM-N regions outside the capital grouped together.
TTAs are based on National Occupancy Standard set out by CMHC for a family of five, and then equivalent values for other family sizes are computed using the square root method. These TTAs are then added to disposable income when evaluating poverty status.
The shelter cost for each tenure type is estimated for the base year. Given the data limitations, the first seven income deciles were considered when calculating the shelter cost averages, which represents a change compared to the 2018-base MBM and the MBM-N for Yukon and the Northwest Territories, where a model to estimate shelter costs for families in the second income decile was used.
The Nunavut MBM-N does not directly consider the housing availability in the territory, but indirectly addresses it using the annual adjustors to estimate the increase in prices over time. Therefore, the tenure type costs reflect an estimation of their costs for a given reference year, but do not reflect the availability of each tenure type in a specific Nunavut MBM-N region.
| MBM-N Geography | Homeowners with a mortgage |
Homeowners without a mortgage |
Subsidized Renters |
|---|---|---|---|
| current dollars | |||
| Region | |||
| Baffin, excluding Iqaluit | 12,492 | 15,684 | 19,889 |
| Kivalliq | 12,492 | 15,684 | 19,889 |
| Kitikmeot | 12,492 | 15,684 | 19,889 |
| Iqaluit | 23,284 | 26,615 | 19,864 |
|
Note: Tenure Type Adjustments are preliminary. Negative Tenure Type Adjustments were set to zero. Source: Statistics Canada. Custom tabulation. |
|||
Homeowners without mortgages
For homeowners without a mortgage, the shelter costs considered for the MBM consist of property taxes, utility costs, condominium fees and basic home insurance costs. As noted above, these are estimated from 2016 Census data for a three-bedroom unit for the capital and outside the capital.
Homeowners with mortgages
For the Nunavut MBM-N, shelter costs for homeowners with a mortgage would consist of property taxes, utility costs, condominium fees, basic home insurance costs and mortgage interest payments. Only homeowners in the first seven income deciles were considered when estimating the shelter cost averages.
The key difference, relative to homeowners without a mortgage, is the interest cost component (which is zero for homeowners without a mortgage). Note Given the data limitations, a few changes compared to the 2018-base MBM were needed in the calculation of the tenure type costs for homeowners with a mortgage. First, the mortgage interest costs were estimated using data from the 2018 Canadian Housing Survey (CHS), not the Survey of Financial Security (SFS). Second, the calculation was done for mortgages on three-bedroom dwellings only and with no age group differences.
Subsidized renters
For tenants living in subsidized housing, TTAs are determined by estimating the average cost of a subsidized three-bedroom rental unit for a family in the first seven income deciles, and then measuring the difference between its cost and corresponding shelter cost in the basket component of the MBM. For subsidized renters, shelter costs consist of the rent paid plus utility costs and relevant insurance costs.
In Nunavut, most rental dwellings are subsidized to alleviate high housing costs, which would also help to attract and to retain employees. In addition, the source of the subsidy can vary (e.g., public, governmental or private). Due to the various sources for a subsidy, many people residing in Nunavut may not be aware that their rent is subsidized. After multiple consultations with our partners in the GN, CMHC and the Nunavut Housing Corporation, it was decided that a slight modification be made to the subsidy indicator found on the Census database. Specifically, every non-subsidized rental dwelling that had a monthly rent below $1,500 was deemed to be a subsidized rental dwelling.
Since there is no information on which rental units are subsidized on the CIS for the North, the information was imputed using 2016 Census data.
Capital gains taxes
A capital gain or capital loss occurs when an individual disposes of, or transfers, a capital property (e.g., land, buildings, stocks, bonds, mutual funds, etc.). Since the MBM and the MBM-N do not include the values for capital gains/losses in the definition of disposable income, yet deducts the income taxes, an adjustment to the disposable income is made to consider the tax implications of capital gains/losses.Note
Imputation amount for medical expenses
Medical expenses are one of the non-discretionary expenses that are deducted from after-tax income to derive disposable income for the Nunavut MBM-N. These medical expenses include out-of-pocket expenses for prescription medicines, eyewear, medical services and health care equipment, dental services, health care and dental plan insurance premiums.
When determining disposable income, medical expenses gathered from tax forms are used if the medical expense claimed on the tax form is greater than zero. If an adult respondent to the CISNote is not linked to tax data or if their medical claim for tax purposes is zero,Note it is proposed that a territorial-level imputation value be used.
Appendix B: Number of persons in poverty
| Persons in poverty | ||||||||||||
|---|---|---|---|---|---|---|---|---|---|---|---|---|
| 2018 | 2019 | 2020 | 2021 | |||||||||
| number | ||||||||||||
| Lower bound |
Estimate | Upper bound |
Lower bound |
Estimate | Upper bound |
Lower bound |
Estimate | Upper bound |
Lower bound |
Estimate | Upper bound |
|
| Geography | ||||||||||||
| Nunavut | 13,400 | 15,300 | 17,100 | 11,500 | 13,900 | 16,200 | 10,100 | 13,600 | 17,200 | 11,700 | 14,600 | 17,600 |
| Age group | ||||||||||||
| Persons under 18 years | 6,000 | 7,200 | 8,400 | 4,800 | 6,000 | 7,200 | 4,300 | 6,300 | 8,300 | 4,300 | 6,200 | 8,000 |
| Persons 18 to 64 years | 6,600 | 7,500 | 8,300 | 6,200 | 7,500 | 8,800 | 5,200 | 7,000 | 8,800 | 5,900 | 8,000 | 10,100 |
| Persons 65 years and over | Note F: too unreliable to be published | Note F: too unreliable to be published | Note F: too unreliable to be published | Note F: too unreliable to be published | Note F: too unreliable to be published | Note F: too unreliable to be published | Note F: too unreliable to be published | Note F: too unreliable to be published | Note F: too unreliable to be published | Note F: too unreliable to be published | Note F: too unreliable to be published | Note F: too unreliable to be published |
| Family Type | ||||||||||||
| Persons in economic families | 12,300 | 14,300 | 16,300 | 10,000 | 12,400 | 14,700 | 8,700 | 12,200 | 15,600 | 9,900 | 13,000 | 16,200 |
| Persons not in an economic family | Note F: too unreliable to be published | Note F: too unreliable to be published | Note F: too unreliable to be published | Note F: too unreliable to be published | Note F: too unreliable to be published | Note F: too unreliable to be published | Note F: too unreliable to be published | Note F: too unreliable to be published | Note F: too unreliable to be published | Note F: too unreliable to be published | Note F: too unreliable to be published | Note F: too unreliable to be published |
F too unreliable to be published
Source: Canadian Income Survey, Statistics Canada. Custom tabulation. |
||||||||||||
Appendix C: Nunavut MBM-N regions
Map C.1: Nunavut MBM-N regions
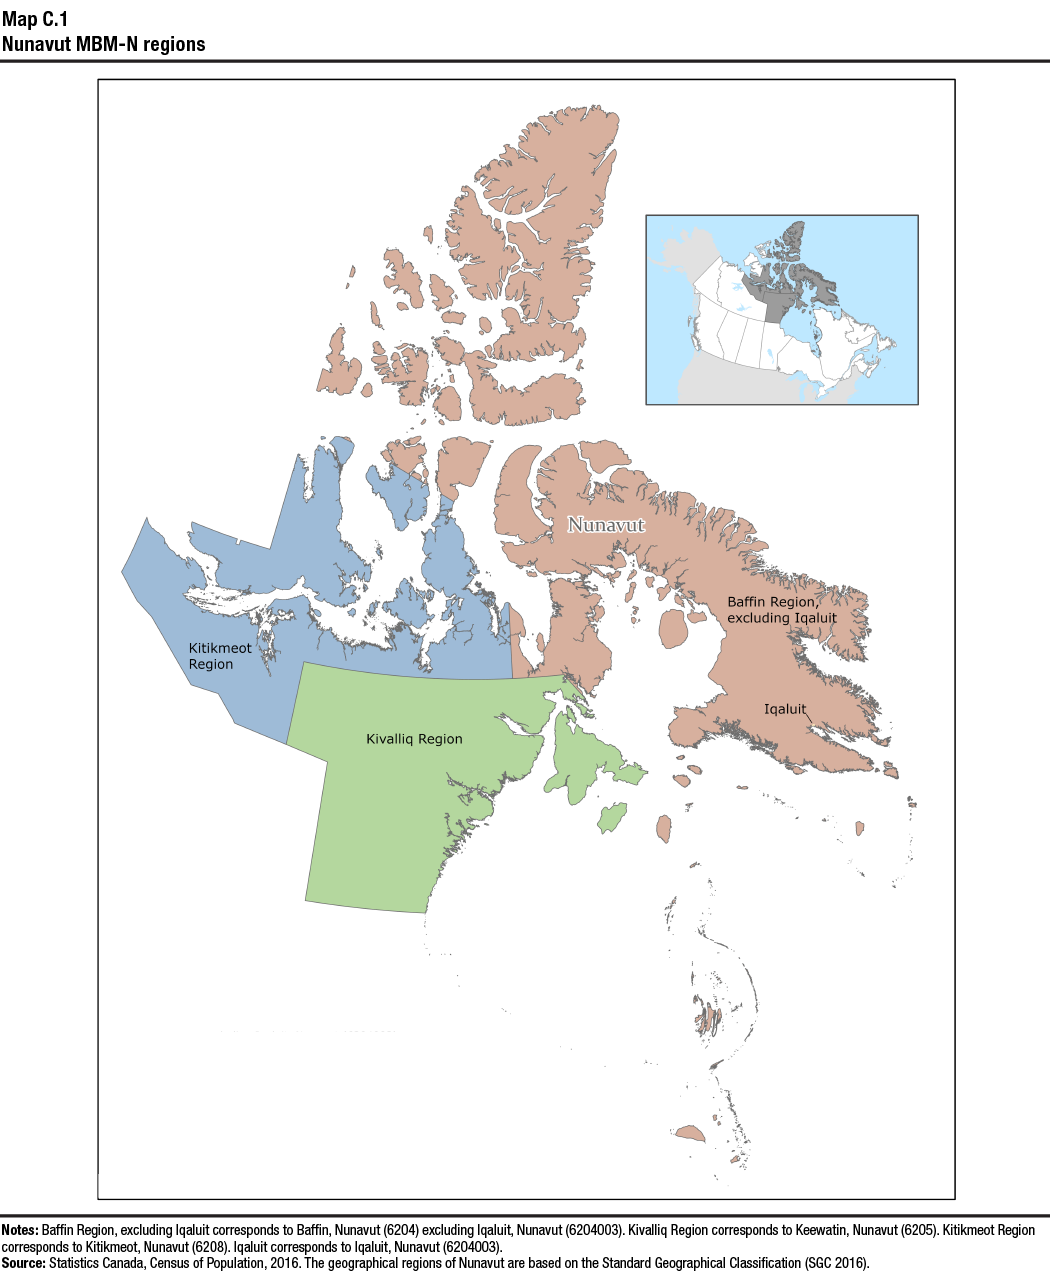
Description for Map C.1
There is an image of the Nunavut territory. The territory of Nunavut and each MBM-N region for Nunavut are labelled. Also, the MBM-N regions each have a unique colour.
The notes section on the image states:
- Baffin Region, excluding Iqaluit corresponds to Baffin, Nunavut (6204) excluding Iqaluit, Nunavut (6204003).
- Kivalliq Region corresponds to Keewatin, Nunavut (6205).
- Kitikmeot Region corresponds to Kitikmeot, Nunavut (6208).
- Iqaluit corresponds to Iqaluit, Nunavut (6204003).
The source section of the image states:
- Statistics Canada, Census of Population, 2016.
The geographical regions of Nunavut are based on the Standard Geographical Classification (SGC 2016).
Table C.2: Nunavut MBM-N regions, by Census subdivision, 2016 Census boundaries
| MBM-N Geography | Census subdivision |
|---|---|
| Region | |
| Baffin, excluding Iqaluit | Arctic Bay (6204018) |
| Baffin, Unorganized (6204030) | |
| Cape Dorset (6204007) | |
| Clyde River (6204015) | |
| Grise Fiord (6204025) | |
| Hall Beach (6204011) | |
| Igloolik (6204012) | |
| Kimmirut (6204005) | |
| Nanisivik (6204019) | |
| Pangnirtung (6204009) | |
| Pond Inlet (6204020) | |
| Qikiqtarjuaq (6204010) | |
| Resolute (6204022) | |
| Sanikiluaq (6204001) | |
| Kivalliq | Arviat (6205015) |
| Baker Lake (6205023) | |
| Chesterfield Inlet (6205019) | |
| Coral Harbour (6205014) | |
| Keewatin, Unorganized (6205033) | |
| Naujaat (6205027) | |
| Rankin Inlet (6205017) | |
| Whale Cove (6205016) | |
| Kitikmeot | Bathurst Inlet (6208065) |
| Cambridge Bay (6208073) | |
| Gjoa Haven (6208081) | |
| Kitikmeot, Unorganized (6208098) | |
| Kugaaruk (6208047) | |
| Kugluktuk (6208059) | |
| Taloyoak (6208087) | |
| Umingmaktok (6208068) | |
| Iqaluit (6204003) | |
| Source: Statistics Canada, Census of Population, 2016. Custom tabulation. | |
Appendix D: MBM-N spatial index adjustment factors
| MBM-N Geography | Fats and Oils | Fruits and Vegetables | Protein Foods | Whole Grain Foods |
|---|---|---|---|---|
| Region | ||||
| Baffin, excluding Iqaluit | 1.06 | 1.04 | 1.07 | 1.07 |
| Kivalliq | 0.90 | 0.87 | 0.92 | 0.97 |
| Kitikmeot | 0.92 | 1.02 | 1.00 | 1.03 |
| Iqaluit | 1.00 | 1.00 | 1.00 | 1.00 |
| Source: Statistics Canada. Custom tabulation. | ||||
Formula D.2: MBM-N food component formula for regions outside the capitals
The methodology for estimating the food costs outside of the capitals could be expressed in the following way.
First, indexes for each food group would be derived by averaging Living Cost Differential (LCD) data, , and data supplied by the territorial focal point, , to create community level spatial indexes. A weighted sum would then be applied to the community indexes to obtain Nunavut MBM-N region indexes, .
; i= 1, …,4 and n=Baffin excluding Iqaluit, Kivalliq and Kitikmeot
where:
= Living Cost Differential based spatial index for a given food grouping I for community c
= Territorial provided spatial index for a given food grouping I for community c
= 2016 Census based population weight for community c
Second, these indexes would then be applied to their respective capital’s costs for the four main food groups that are found in the NNFB (i.e., vegetables and fruit, protein foods, whole grain foods, and unsaturated fats).
Finally, the four main food group indexes are aggregated to calculate the food component cost for a specific Nunavut MBM-N region, .
; i= 1, …,4 and n=Baffin excluding Iqaluit, Kivalliq and Kitikmeot
where:
= the food group multiplier for the MBM-N region n
= the food costs for the capital for food group i
Appendix E: A non-prescriptive list of possible family expenditures in the Inuusiqattiarniq Component
| Activity | Possible Item | Priced Item | Cost and Unit |
|---|---|---|---|
| Equipment for the manufacturing of traditional clothing | Sewing Machine | Brother XM2701 Lightweight, Full-Featured Sewing Machine | $220 |
| Equipment for hunting and preparing country food | Rifle | Tikka T3x Lite Stainless Bolt-Action Rifle | $1,300 |
| Ammunition | Winchester Deer Season XP Rifle Ammunition Calibre: .243 Winchester, Bullet weight: 95 grain | $105 per 20 round box | |
| Licence for Hunting | Government of Nunavut | $16 | |
| Gasoline Costs for Hunting Trips Annual | Government of Nunavut | $330 - $347 estimated as 300L | |
| Tag Costs | Government of Nunavut | $15 - $35 per animal | |
| Children's programming and promoting Inuit culture | Inuktitut Children's Books | Prices from Indigo and Amazon | $10-$20 per book |
| Supportive physical and/or mental health services | Out of pocket counseling and therapy | Psychotherapy sessions | Varies by type and duration |
| Community engagement activities | Community engagement costs | Proxy - CRA Charitable Tax Credit Information for a family of 5 | $650 |
| Travel to attend key community events | Flights to funerals in remote communities using Canadian North | $2,000-$4,000 per person, not including compassionate care discount | |
| Mailing services for exchanging goods across different communities | Canada Post Canada Wide Delivery | $18-$30 per parcel | |
| Source: Statistics Canada. Custom tabulation. | |||
Appendix F: Methodological comparison between the MBM (2018-base), MBM-N for Yukon and Northwest Territories, and MBM-N for Nunavut
| Component | MBM | MBM-N for Yukon and Northwest Territories | MBM-N for Nunavut |
|---|---|---|---|
| Shelter | • Canadian Mortgage and Housing Corporation's National Occupancy Standards for reference family • Uses 2016 Census • Median rent for 3-bedroom rental unit • Non-subsidized rental units • Supplement for appliance costs • Amount for tenant’s insurance included • Annual adjustments use the provincial all-items indexes |
• Canadian Mortgage and Housing Corporation's National Occupancy Standards for reference family • Uses 2016 Census • Median rent for 3-bedroom rental unit • Non-subsidized rental units • No supplement for appliance costs • Amount for tenant’s insurance included • Annual adjustments use the territorial all-items indexes |
• Canadian Mortgage and Housing Corporation's National Occupancy Standards for reference family • Uses 2016 Census • Median rent for 3-bedroom rental unit • Non-subsidized rental units • Data limitations, only one shelter cost estimate for all the regions outside of the capital is possible • No supplement for appliance costs • Amount for tenant’s insurance included • Annual adjustments use the territorial all-items index |
| Transportation | • Uses a weighted average of the cost of public transit and private transportation (Population centres with fewer than 30,000 people only have private transportation costs) • Weighted basket of five used compact cars and associated costs • Eight-year-old vehicles, amortized over five years with a 36-month financing term • 1,200 litres of gas per year • Cost of monthly public transit passes for two adults and one child and an additional amount sufficient for 12 round trip taxi rides • Not applicable (no difference for fly-in communities) • Annual adjustments use the provincial private or private transportation indexes |
• Uses only private transportation costs • Weighted basket of one used compact car and one used sport utility vehicle • Eight-year-old vehicles, amortized over five years with a 36-month financing term • 1,200 litres of gas per year in the capitals, a little more outside the capitals • Not applicable (no public transportation costs) • For the fly-in communities of the NWT, costs are associated with purchase of a new mid-quality range all-terrain vehicle (ATV) and snowmobile, amortized over eight years with a 36-month financing term • Annual adjustments use the territorial private transportation indexes |
• Uses only private transportation costs • No compact car or sport utility vehicle • Not applicable (no public transportation costs) • For all communities, costs are associated with purchase of a new mid-quality range all-terrain vehicle (ATV) and snowmobile, amortized over eight years with a 36-month financing term • Annual adjustments use the territorial all-items index |
| Food | • Health Canada's 2019 National Nutritious Food Basket (NNFB) • 5% is added to the total cost of the 2019 basket for miscellaneous foods and beverages • Prices collected in 38 cities across the provinces • Annual adjustments use the provincial food purchased from stores indexes |
• Health Canada's 2019 National Nutritious Food Basket (NNFB) • 5% is added to the total cost of the 2019 basket for miscellaneous foods and beverages • Prices collected in the territorial capitals, adjusted using spatial indexes for outside the capitals • Annual adjustments use the territorial food purchased from stores indexes |
• An modified version of Health Canada's 2019 National Nutritious Food Basket (NNFB) to account for country food • Includes country food • 5% is added to the total cost of the 2019 basket for miscellaneous foods and beverages • Prices collected in the territorial capital, adjusted using spatial index for outside the capital • Annual adjustments use the territorial all-items index |
| Clothing and footwear | • 2012 Social Planning Council of Winnipeg and Winnipeg Harvest Acceptable Living Level (ALL) Basket • Prices collected in 11 cities across the provinces • Not applicable (no adjustments are made to the ALL basket) • Annual adjustments use the provincial clothing and footwear indexes |
• 2012 Social Planning Council of Winnipeg and Winnipeg Harvest Acceptable Living Level (ALL) Basket • Prices collected in the territorial capitals. For outside the capitals, a weighted average of the costs associated one trip to the closest territorial capital and the cost of ordering online. • Adjustments were made to the ALL replacement schedule and clothing list due to the colder climate. • Annual adjustments use the territorial clothing and footwear indexes |
• An modified version of 2012 Social Planning Council of Winnipeg and Winnipeg Harvest Acceptable Living Level (ALL) Basket to include traditional clothing • Incudes traditional clothing, plus 5% repair cost • Prices collected in the territorial capitals. For outside the capitals, a weighted average of the costs associated one trip to the closest community and the cost of ordering online. • Adjustments were made to the ALL replacement schedule and clothing list due to the colder climate and to make adjustment for the inclusion of traditional clothing items • Annual adjustments use the territorial all-items index |
| Other necessities | • Fixed multiplier (75.4%) using Survey of Household Spending (SHS) data of the total cost of the food and clothing components for each MBM region. • Additional provincial amount for cell phone services • Annual adjustments use the provincial all-items indexes |
• Fixed multiplier (75.4%) using Survey of Household Spending (SHS) data of the total cost of the food and clothing components for each MBM-N region. • Additional territorial amount for cell phone services • Annual adjustments use the territorial all-items indexes |
• Fixed multiplier (75.4%) using Survey of Household Spending (SHS) data of the total cost of the food and clothing components for each MBM-N region. • Additional territorial amount for cell phone services • Annual adjustments use the territorial all-items index |
| Inuusiqattiarniq | • Not applicable | • Not applicable | • Uses a fixed ratio based on expert judgement, multiplied against the other necessities component costs. |
| Disposable Income | • Total income (including government transfers), less income tax and several non-discretionary expenses • Three Tenure Type Adjustments • Medical expenses imputation uses provincial data |
• Total income (including government transfers), less income tax and several non-discretionary expenses • Three Tenure Type Adjustments • Medical expenses imputation uses territorial data |
• Total income (including government transfers), less income tax and several non-discretionary expenses • Three Tenure Type Adjustments • Data limitations, only one tenure type adjustment for all the regions outside of the capital is possible • Medical expenses imputation uses territorial data |
Appendix G: Impact on the poverty rates for Nunavut by excluding the inuusiqattiarniq component
Table G.1 would present the poverty rates without the inuusiqattiarniq component
| Persons in poverty | ||||||||||||
|---|---|---|---|---|---|---|---|---|---|---|---|---|
| 2018 | 2019 | 2020 | 2021 | |||||||||
| percent | ||||||||||||
| Lower bound |
Estimate | Upper bound |
Lower bound |
Estimate | Upper bound |
Lower bound |
Estimate | Upper bound |
Lower bound |
Estimate | Upper bound |
|
| Geography | ||||||||||||
| Nunavut | 34.2 | 39.7 | 45.3 | 28.5 | 34.3 | 40.0 | 22.9 | 31.6 | 40.3 | 26.3 | 33.3 | 40.3 |
| Age group | ||||||||||||
| Persons under 18 years | 42.0 | 51.9 | 61.7 | 30.6 | 38.1 | 45.7 | 27.0 | 41.0 | 55.1 | 25.4 | 39.0 | 52.6 |
| Persons 18 to 64 years | 28.8 | 32.6 | 36.4 | 26.9 | 32.5 | 38.2 | 19.7 | 27.1 | 34.6 | 23.9 | 31.4 | 38.9 |
| Persons 65 years and over | 15.5 | 29.5 | 43.4 | Note F: too unreliable to be published | Note F: too unreliable to be published | Note F: too unreliable to be published | Note F: too unreliable to be published | Note F: too unreliable to be published | Note F: too unreliable to be published | Note F: too unreliable to be published | Note F: too unreliable to be published | Note F: too unreliable to be published |
| Family Type | ||||||||||||
| Persons in economic families | 34.2 | 40.9 | 47.5 | 26.6 | 33.0 | 39.4 | 20.8 | 30.3 | 39.9 | 23.5 | 31.9 | 40.3 |
| Persons not in an economic family | 13.2 | 27.8 | 42.4 | 36.4 | 47.3 | 58.2 | 25.1 | 44.4 | 63.8 | 20.4 | 46.6 | 72.9 |
F too unreliable to be published
Source: Canadian Income Survey, Statistics Canada. Custom tabulation. |
||||||||||||
Table G.2 would present the number of persons in poverty without the inuusiqattiarniq component
| Persons in poverty | ||||||||||||
|---|---|---|---|---|---|---|---|---|---|---|---|---|
| 2018 | 2019 | 2020 | 2021 | |||||||||
| number | ||||||||||||
| Lower bound |
Estimate | Upper bound |
Lower bound |
Estimate | Upper bound |
Lower bound |
Estimate | Upper bound |
Lower bound |
Estimate | Upper bound |
|
| Geography | ||||||||||||
| Nunavut | 12,100 | 14,100 | 16,000 | 10,200 | 12,300 | 14,300 | 8,300 | 11,500 | 14,700 | 9,700 | 12,200 | 14,900 |
| Age group | ||||||||||||
| Persons under 18 years | 5,500 | 6,900 | 8,300 | 4,100 | 5,100 | 6,100 | 3,600 | 5,400 | 7,200 | 3,200 | 5,200 | 7,200 |
| Persons 18 to 64 years | 6,000 | 6,700 | 7,500 | 5,700 | 6,900 | 8,100 | 4,300 | 5,900 | 7,600 | 5,200 | 7,000 | 8,700 |
| Persons 65 years and over | Note F: too unreliable to be published | Note F: too unreliable to be published | Note F: too unreliable to be published | Note F: too unreliable to be published | Note F: too unreliable to be published | Note F: too unreliable to be published | Note F: too unreliable to be published | Note F: too unreliable to be published | Note F: too unreliable to be published | Note F: too unreliable to be published | Note F: too unreliable to be published | Note F: too unreliable to be published |
| Family Type | ||||||||||||
| Persons in economic families | 11,100 | 13,200 | 15,400 | 8,700 | 10,800 | 12,900 | 6,900 | 10,000 | 13,200 | 7,900 | 10,700 | 13,500 |
| Persons not in an economic family | Note F: too unreliable to be published | Note F: too unreliable to be published | Note F: too unreliable to be published | Note F: too unreliable to be published | Note F: too unreliable to be published | Note F: too unreliable to be published | Note F: too unreliable to be published | Note F: too unreliable to be published | Note F: too unreliable to be published | Note F: too unreliable to be published | Note F: too unreliable to be published | Note F: too unreliable to be published |
F too unreliable to be published
Source: Canadian Income Survey, Statistics Canada. Custom tabulation. |
||||||||||||
Appendix H: Comparison of the MBM-N Nunavut thresholds with selected other MBM thresholds
| MBM Geography | Region | Four-person family | ||||||
|---|---|---|---|---|---|---|---|---|
| Total threshold | Food component | Clothing and footwear component | Transportation component | Shelter component | Other necessities component | Inuusiqattiarniq component | ||
| Current dollars | ||||||||
| Province | ||||||||
| Ontario | Ottawa-Gatineau, Ontario part | 47,233 | 11,399 | 2,157 | 4,538 | 17,822 | 11,317 | Note ...: not applicable |
| Toronto | 48,142 | 10,803 | 1,846 | 5,602 | 19,259 | 10,633 | Note ...: not applicable | |
| Alberta | Calgary | 48,349 | 11,510 | 1,858 | 4,228 | 19,367 | 11,386 | Note ...: not applicable |
| Edmonton | 47,869 | 11,410 | 1,858 | 4,236 | 19,055 | 11,311 | Note ...: not applicable | |
| British Columbia | Vancouver | 48,677 | 11,586 | 2,074 | 4,476 | 19,125 | 11,416 | Note ...: not applicable |
| Territory | ||||||||
| Yukon | Rural North | 53,203 | 15,745 | 3,673 | 5,508 | 12,433 | 15,844 | Note ...: not applicable |
| Rural South | 50,895 | 15,144 | 3,492 | 5,239 | 11,765 | 15,255 | Note ...: not applicable | |
| Whitehorse | 52,215 | 12,416 | 3,246 | 4,884 | 18,657 | 13,012 | Note ...: not applicable | |
| Northwest Territories | Beaufort Delta | 71,611 | 20,220 | 4,227 | 5,859 | 21,214 | 20,090 | Note ...: not applicable |
| Sahtu | 72,526 | 22,146 | 3,985 | 6,176 | 18,859 | 21,360 | Note ...: not applicable | |
| Tłįchǫ | 58,962 | 16,321 | 3,592 | 5,313 | 17,065 | 16,671 | Note ...: not applicable | |
| Dehcho | 62,289 | 17,143 | 3,973 | 5,547 | 18,047 | 17,579 | Note ...: not applicable | |
| South Slave | 59,004 | 15,763 | 3,725 | 5,096 | 18,069 | 16,351 | Note ...: not applicable | |
| Yellowknife | 59,926 | 12,454 | 3,400 | 5,141 | 25,320 | 13,611 | Note ...: not applicable | |
| NunavutTable H Market Basket Measure (MBM) thresholds and components for selected MBM regions and reference family sizes, 2018 Note 1 Table H Market Basket Measure (MBM) thresholds and components for selected MBM regions and reference family sizes, 2018 Note 2 |
Baffin, excluding Iqaluit | 94,767 | Note ...: not applicable | Note ...: not applicable | Note ...: not applicable | Note ...: not applicable | Note ...: not applicable | Note ...: not applicable |
| Kivalliq | 83,165 | Note ...: not applicable | Note ...: not applicable | Note ...: not applicable | Note ...: not applicable | Note ...: not applicable | Note ...: not applicable | |
| Kitikmeot | 88,427 | Note ...: not applicable | Note ...: not applicable | Note ...: not applicable | Note ...: not applicable | Note ...: not applicable | Note ...: not applicable | |
| Iqaluit | 99,183 | Note ...: not applicable | Note ...: not applicable | Note ...: not applicable | Note ...: not applicable | Note ...: not applicable | Note ...: not applicable | |
... not applicable
|
||||||||
| MBM Geography | Region | Five-person family | ||||||
|---|---|---|---|---|---|---|---|---|
| Total threshold | Food component | Clothing and footwear component | Transportation component | Shelter component | Other necessities component | Inuusiqattiarniq component | ||
| Current dollars | ||||||||
| Province | ||||||||
| Nunavut | Baffin, excluding Iqaluit | 105,953 | 27,717 | 7,300 | 10,497 | 25,363 | 28,061 | 7,015 |
| Kivalliq | 92,981 | 23,704 | 6,017 | 7,811 | 25,363 | 24,069 | 6,017 | |
| Kitikmeot | 98,864 | 26,717 | 6,027 | 7,823 | 25,363 | 26,348 | 6,587 | |
| Iqaluit | 110,890 | 26,367 | 6,034 | 7,332 | 38,542 | 26,091 | 6,523 | |
| Source: Provincial thresholds - Statistics Canada. Table 11-10-0066-01 Market Basket Measure (MBM) thresholds for the reference family by Market Basket Measure region, component and base year. Yukon and Northwest Territory thresholds - Market Basket Measure (MBM) thresholds for the reference family by Market Basket Measure region, component and base year, Construction of a Northern Market Basket Measure of poverty for Yukon and the Northwest Territories, and custom tabulations | ||||||||
References
Bowman, S., Martin, C., Carlson, J., Clemens, J., Lin, B., Moshfegh, A. (2013). Food Intakes Converted to Retail Commodities Databases 2003-2008: Methodology and User Guide. U.S. Department of Agriculture, Agricultural Research Services, Beltsville, MD, and U.S. Department of Agriculture, Economic Research Service, Washington, D.C.
Canada Mortgage and Housing Corporation (2020). Northern Housing Report. Catalogue no. NH12-321E-PDF
Devin, Nancy, Eric Dugas, Burton Gustajtis, Sarah McDermott and José Mendoza Rodríguez (2023), "Launch of the Third Comprehensive Review of the Market Basket Measure". Catalogue no. 75F0002M2023007
Devin, Nancy, Burton Gustajtis, Keith Lam and Sarah McDermott (2021), “Construction of a Northern Market Basket Measure of poverty for Yukon and the Northwest Territories”. Catalogue no. 75F0002M2021007.
Devin, Nancy, Burton Gustajtis and Sarah McDermott (2022), “Technical paper for the Northern Market Basket Measure of poverty for Yukon and the Northwest Territories”. Catalogue no. 75F0002M2022004.
Djidel, Samir, Burton Gustajtis, Andrew Heisz, Keith Lam, Isabelle Marchand and Sarah McDermott (2020), “Report on the second comprehensive review of the Market Basket Measure”. Catalogue no. 75F0002M2020002.
Djidel, Samir, Burton Gustajtis, Andrew Heisz, Keith Lam and Sarah McDermott (2019a), “Towards an update of the Market Basket”. Catalogue no. 75F0002M2019013.
Djidel, Samir, Burton Gustajtis, Andrew Heisz, Keith Lam and Sarah McDermott (2019b), “Defining disposable income in the Market Basket Measure”. Catalogue no. 75F0002M2019014.
Employment and Social Development Canada, 2018. “Opportunity for All – Canada’s First Poverty Reduction Strategy”, Cat. no.: SSD-212-08-18E.
Fréchet, Guy, Pierre Lanctôt, Alexandre Morin and Frédéric Savard (2010), “EQUIVALENCE SCALES: AN EMPIRICAL VALIDATION”. Comité de direction du Centre d’étude sur la pauvreté et l’exclusion (CEPE). Catalogue no. 978-2-550-59521-2
Government of Nunavut (2017). “The Makimaniq Plan 2 A Shared Approach To Poverty Reduction 2017-2022”. Nunavut Roundtable for Poverty Reduction.
Government of Nunavut (2019). Nunavut Roundtable for Poverty Reduction - Notes. Inuit Customary laws and Community Decision Making Processes. Cambridge Bay Community Hall. November 19 to 21, 2019. Unpublished document.
Gustajtis, Burton, Keith Lam and Sarah McDermott (2021), “Proposals for a Northern Market Basket Measure and its disposable income”. Catalogue no. 75F0002M2021001.
Hatfield, Michael, Wendy Pyper and Burton Gustajtis. (2010), “First Comprehensive Review of the Market Basket Measure of Low Income”, Applied Research Branch paper, Human Resources and Skills Development Canada.
Heisz, Andrew (2019), “An update on the Market Basket Measure comprehensive review”. Catalogue no.75F0002M2019009.
Impact Economics (2012). “Understanding Poverty in Nunavut”. Report prepared for the Nunavut Roundtable for Poverty Reduction.
Impact Economics (2022). Cost of Living Index Development and Economic Analysis for Poverty Reduction in Inuit Nunangat. Unpublished document (available by emailing impacteconomics@gmail.com).
Inuit Tapiriit Kanatami (2014). “Social Determinants of Inuit Health in Canada”.
Statistics Canada (2019). “Methodological changes to the Market Basket Measure in 2019”. Catalogue no.75F0002M2019005
Statistics Canada (2016). “Low Income Lines: What they are and how they are created”. Catalogue no.75F0002M2016002
Statistics Canada (2012). Northern Market Basket Measure Feasibility Study. Unpublished document.
Tungasuvvingat Inuit and Well Living House Action Research Centre for Indigenous Infant, Child and Family Health and Well being at the Centre for Urban Health Solutions, St. Michael’s Hospital (2017). “Our Health counts, Urban Indigenous Health Database project”.
UNECE (2011), “Canberra Group Handbook on Household Income Statistics”, Second Edition.
Warltier, Duncan W., Manuelle Landry-Cuerrier, Murray M. Humphries (2021). “Valuation of Country Food in Nunavut Based on Energy and Protein Replacement”. Arctic. Vol. 74, no. 3 (September 2021) p. 355–371.
- Date modified: