
Insights on Canadian Society
Self-employment among women in Canada

Text begins
Acknowledgement
This study was funded by Women and Gender Equality Canada.
Overview of the study
This study uses historical data from the Labour Force Survey, from 1976 to 2022, to provide a profile of self-employment among women in Canada, looking at changes in the self-employment rate, type of self-employment and the top occupations among the self-employed. It also uses data from the 2001 and 2021 Censuses of Population to profile self-employment among various population groups.
- Based on data from the Labour Force Survey, in 2022, nearly one million women in Canada were self-employed accounting for 37% of the total self-employed population. This proportion was up from 26% in 1976.
- The self-employment rate among women increased from 9% in 1976 to a high of 13% in the late 1990s before declining to 11% by 2022. Among men the rate increased from 14% to 20% before declining to 16% over the same time period.
- In 1976, 34% of self-employed women were unpaid family workers, working mostly in agriculture. This proportion declined to 1% by 2022.
- In 2022, the five occupations with the greatest number of self-employed women were retail and wholesale trade managers, early childhood educators and assistants, real estate agents and salespersons, light duty cleaners, and hairstylists and barbers.
- According to the 2021 Census of Population, Korean Canadian women had the highest self-employment rate among women, with one in five being self-employed. Filipino and Black Canadian women had the lowest rates, at 5% and 6%, respectively.
- The occupational group with the greatest number of self-employed racialized women included real estate agents and salespersons. However, the top occupation varied across racialized groups.
- The self-employment rate among the Indigenous population living off reserve was lower than the non-Indigenous population. In 2021, among women, 10% of Métis, 7% of First Nations people living off reserve and 4% of Inuit were self-employed. The rate was 12% for non-Indigenous women. The occupational group with the greatest number of self-employed First Nations women and Métis women was light duty cleaners, followed by hairstylists and barbers.
Introduction
Whether as the main source of employment income or as supplemental income, self-employment has historically been an important labour market activity in Canada. This workforce is diverse, with a growing representation of women among the ranks of the self-employed, from 26% of all self-employed Canadians in 1976 to 37% in 2022. That said, women remain less likely than men to be their ‘own boss’ - working independently to operate a business or professional activities, with or without employees. In 2022, 11% of working women and 16% of working men were self-employed.
While many studies have examined women’s increased participation in the labour force, far fewer studies have focused on trends and patterns in women’s self-employment.Note Well-understood is the finding that women’s motivations for entry into self-employment often differ from those of men, with women being much more likely to cite flexible hours and the need for work-life balance.Note This likely reflects the gender imbalance in unpaid work, as 60% of total hours of unpaid housework continue to be performed by women.Note What is less understood are the changes in the nature of self-employment among women, as well as the diversity within the population of self-employed women and the populations of women who are less likely to be self-employed.
Using census data and data from the Labour Force Survey (see Data sources and definitions), the goal of this article is to examine how self-employment (rate, type and occupation) among women changed over time and how self-employment differs among women with different characteristics. While the primary focus is on women, it is important to contextualize these experiences against those of men. The article starts with an examination of results from the Labour Force Survey (LFS), followed by a look into the results from census data. Labour Force Survey data are useful to study trends over time, whereas census data allow for a detailed analysis of various population groups.
Women account for more than one-third of self-employed Canadians
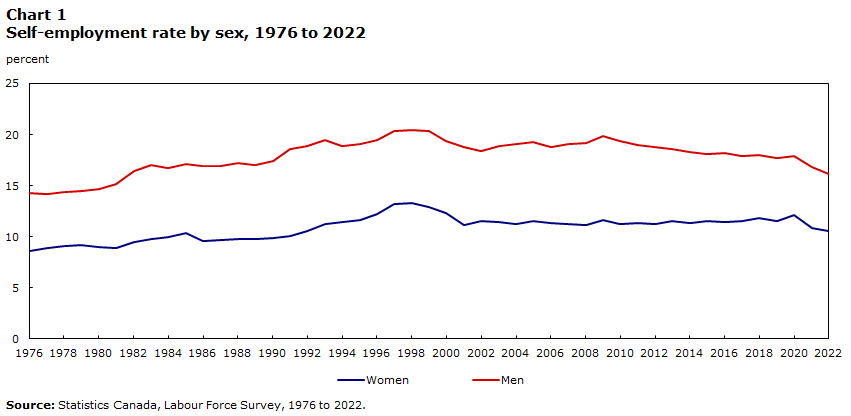
Overall, between 1976 and the late 1990s, self-employment witnessed a slow but steady increase from 12% in 1976 to 17% by 1998 (Chart 1). Non-cyclical factors such as demographic, structural, technological, and government policy changes have been cited as reasons behind this increase.Note However, after this steady increase self-employment declined in the subsequent years, dropping to 15% in 2001. Most of this decline has been attributed to agriculture, retail trade and manufacturing industries and was more pronounced among younger workers and older females.Note The rate remained relatively stable over the next two decades, decreasing slightly during the COVID-19 pandemic and not recovering since.
This overall trend was similar for men and women, with rates being consistently lower among women.Note The self-employment rate for women stood at 9% in 1976, increasing to 13% in the late 1990s. During the same period, the rate for men increased from 14% to 20%. By 2022, the proportion of self-employed dropped to 11% for women and 16% for men, remaining higher than the rates in the 1970s.
Though the increase in the proportion of self-employed between 1976 and 2022 was similar for men and women, the actual number of self-employed grew faster among women compared to men. Against the backdrop of the larger societal changes, including women entering and staying in the paid workforceNote , the share of self-employed women among the total self-employed increased from 26% in 1976 to 37% in 2022. Most of the increase (9 percentage points) in the share of self-employed women was realized by the late 1990s. Since then, the share has only increased slightly (2 percentage points).
Data table for Chart 1
| Reference year | Women | Men |
|---|---|---|
| percent | ||
| 1976 | 8.6 | 14.2 |
| 1977 | 8.8 | 14.2 |
| 1978 | 9.0 | 14.4 |
| 1979 | 9.2 | 14.5 |
| 1980 | 9.0 | 14.6 |
| 1981 | 8.9 | 15.1 |
| 1982 | 9.5 | 16.4 |
| 1983 | 9.7 | 17.1 |
| 1984 | 10.0 | 16.7 |
| 1985 | 10.4 | 17.1 |
| 1986 | 9.6 | 16.9 |
| 1987 | 9.7 | 16.9 |
| 1988 | 9.8 | 17.2 |
| 1989 | 9.8 | 17.0 |
| 1990 | 9.9 | 17.4 |
| 1991 | 10.1 | 18.6 |
| 1992 | 10.6 | 18.9 |
| 1993 | 11.2 | 19.5 |
| 1994 | 11.4 | 18.9 |
| 1995 | 11.6 | 19.0 |
| 1996 | 12.2 | 19.5 |
| 1997 | 13.2 | 20.3 |
| 1998 | 13.3 | 20.4 |
| 1999 | 12.9 | 20.4 |
| 2000 | 12.3 | 19.4 |
| 2001 | 11.2 | 18.8 |
| 2002 | 11.5 | 18.4 |
| 2003 | 11.4 | 18.9 |
| 2004 | 11.3 | 19.1 |
| 2005 | 11.5 | 19.2 |
| 2006 | 11.4 | 18.8 |
| 2007 | 11.2 | 19.1 |
| 2008 | 11.2 | 19.2 |
| 2009 | 11.6 | 19.8 |
| 2010 | 11.3 | 19.4 |
| 2011 | 11.3 | 19.0 |
| 2012 | 11.3 | 18.8 |
| 2013 | 11.5 | 18.5 |
| 2014 | 11.4 | 18.3 |
| 2015 | 11.6 | 18.1 |
| 2016 | 11.4 | 18.2 |
| 2017 | 11.5 | 17.9 |
| 2018 | 11.8 | 18.0 |
| 2019 | 11.6 | 17.7 |
| 2020 | 12.1 | 17.9 |
| 2021 | 10.9 | 16.8 |
| 2022 | 10.5 | 16.1 |
| Source: Statistics Canada, Labour Force Survey, 1976 to 2022. | ||
Self-employment increases with age
The association between age and self-employment is well-known.Note Generally speaking, the self-employment rate increases with age. In 2022, 2% of working women aged 15 to 24 were self-employed, increasing to 10% among 25- to 54-year-old women and 18% for women aged 55 years or older.
A similar age pattern is seen for men, though notably, there is very little gender gap under the age of 25. In 2022, 3% of working men aged 15 to 24 were self-employed, mirroring the rate for women (2%). The differences become more pronounced with age, with a greater proportion of working men than working women being self-employed at ages 25 to 54 (15% versus 10%) and 55 and older (27% versus 18%).
Self-employment is trending older for both women and men. Between 1976 and 2022, the rate of self-employment dropped among young workers, from 5% to 2% for women and 6% to 3% for men, while the rate for those aged 55 and older increased. In particular, self-employment increased from 14% to 18% among older working women, and 23% to 27% for older working men. The rate for those aged 25 to 54 remained constant. This suggests that the overall gain of about two percentage points between 1976 and 2022 among both men and women was largely driven by the older adult population.
Self-employed women more likely than men to be unincorporated without paid help
The umbrella category of self-employment can mask important differences in the types of self-employment. Broadly speaking, self-employed can be classified into two categories: the “incorporated”, who are generally seen as people who work for themselves in corporate entities; and the “unincorporated”, those who work for themselves in other legal entities.Note These two categories can be further subdivided depending on whether they have paid employees.
An additional category of self-employed is “unpaid family worker”. This consists of individuals who work without pay on a farm or in a business or professional practice owned and operated by another family member living in the same dwelling.
Whether the self-employed are incorporated or unincorporated does not necessarily depend on the type of work they do. For example, retail and wholesale trade managers, such as store owners, and restaurant and food service managers, such as restaurant owners, are among the top occupations among both - incorporated with employees and unincorporated with employees - even though they are more likely to be incorporated.Note
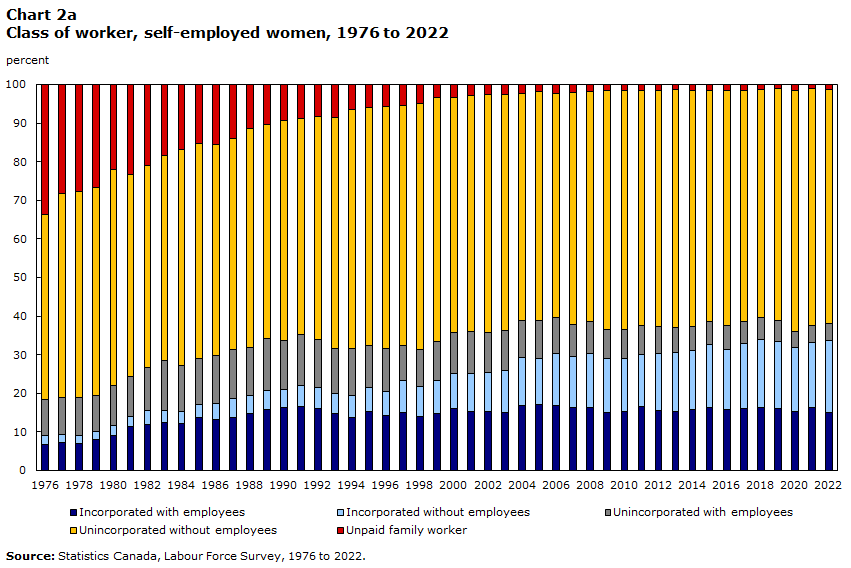
In the late 1970s, a notable proportion (34%) of self-employed women were unpaid family workers (Chart 2a). The majority (61%) of these workers were employed in agriculture, with 21% in cattle ranching. In the decades that followed, employment in agriculture started to decline.Note Also, among those who remained self-employed in agriculture, they were more likely to be incorporated or unincorporated.Note Moreover, there was also a shift away from unpaid work among self-employed women in industries other than agriculture.Note Reflecting this new reality, the proportion of women who were unpaid family workers started to drop. By the late 1980s, around 1 in 10 were in this category and in 2022, this proportion reached a low of 1%. Among self-employed men, the proportion of unpaid family workers has always been low – 3% in 1976 and less than 1% in 2022 (Chart 2b).
Data table for Chart 2a
| Reference year | Women | ||||
|---|---|---|---|---|---|
| Incorporated with employees | Incorporated without employees | Unincorporated with employees | Unincorporated without employees | Unpaid family worker | |
| percent | |||||
| 1976 | 6.6 | 2.5 | 9.2 | 48.2 | 33.6 |
| 1977 | 7.1 | 2.1 | 9.6 | 52.9 | 28.3 |
| 1978 | 7.0 | 2.2 | 9.7 | 53.5 | 27.7 |
| 1979 | 8.0 | 2.0 | 9.5 | 53.9 | 26.6 |
| 1980 | 9.1 | 2.7 | 10.2 | 56.0 | 22.0 |
| 1981 | 11.2 | 2.7 | 10.3 | 52.4 | 23.3 |
| 1982 | 11.8 | 3.6 | 11.2 | 52.5 | 20.9 |
| 1983 | 12.3 | 3.3 | 12.9 | 53.1 | 18.5 |
| 1984 | 12.2 | 3.2 | 11.8 | 55.9 | 17.0 |
| 1985 | 13.7 | 3.2 | 11.9 | 55.7 | 15.4 |
| 1986 | 13.1 | 4.2 | 12.5 | 54.7 | 15.5 |
| 1987 | 13.8 | 4.8 | 12.9 | 54.4 | 14.1 |
| 1988 | 14.8 | 4.6 | 12.5 | 56.7 | 11.4 |
| 1989 | 15.7 | 4.9 | 13.6 | 55.6 | 10.2 |
| 1990 | 16.4 | 4.6 | 12.7 | 56.9 | 9.4 |
| 1991 | 16.5 | 5.5 | 13.2 | 56.0 | 8.8 |
| 1992 | 16.1 | 5.3 | 12.5 | 57.8 | 8.4 |
| 1993 | 14.8 | 5.0 | 11.8 | 59.9 | 8.5 |
| 1994 | 13.7 | 5.7 | 12.1 | 61.9 | 6.6 |
| 1995 | 15.3 | 6.3 | 10.9 | 61.5 | 6.0 |
| 1996 | 14.2 | 6.3 | 11.1 | 62.8 | 5.7 |
| 1997 | 15.0 | 8.3 | 9.1 | 62.1 | 5.5 |
| 1998 | 14.0 | 7.8 | 9.6 | 63.7 | 5.0 |
| 1999 | 14.7 | 8.7 | 9.9 | 63.2 | 3.5 |
| 2000 | 15.9 | 9.1 | 10.6 | 61.0 | 3.4 |
| 2001 | 15.2 | 9.9 | 11.0 | 61.1 | 2.9 |
| 2002 | 15.3 | 10.1 | 10.3 | 61.6 | 2.7 |
| 2003 | 14.9 | 11.1 | 10.2 | 61.2 | 2.6 |
| 2004 | 16.7 | 12.5 | 9.5 | 59.0 | 2.3 |
| 2005 | 16.9 | 12.2 | 9.6 | 59.5 | 1.8 |
| 2006 | 16.8 | 13.4 | 9.5 | 57.9 | 2.4 |
| 2007 | 16.3 | 13.1 | 8.3 | 60.1 | 2.2 |
| 2008 | 16.4 | 13.8 | 8.2 | 59.6 | 1.9 |
| 2009 | 15.0 | 13.9 | 7.6 | 61.8 | 1.6 |
| 2010 | 15.1 | 13.8 | 7.5 | 62.1 | 1.5 |
| 2011 | 16.4 | 13.7 | 7.4 | 61.0 | 1.5 |
| 2012 | 15.6 | 14.7 | 6.8 | 61.4 | 1.4 |
| 2013 | 15.3 | 15.2 | 6.6 | 61.5 | 1.4 |
| 2014 | 15.6 | 15.3 | 6.2 | 61.3 | 1.5 |
| 2015 | 16.3 | 16.3 | 5.9 | 60.0 | 1.5 |
| 2016 | 15.9 | 15.6 | 6.1 | 61.0 | 1.5 |
| 2017 | 15.9 | 16.9 | 5.7 | 59.9 | 1.6 |
| 2018 | 16.3 | 17.6 | 5.7 | 58.9 | 1.4 |
| 2019 | 16.0 | 17.3 | 5.5 | 60.0 | 1.2 |
| 2020 | 15.3 | 16.5 | 4.3 | 62.4 | 1.5 |
| 2021 | 16.2 | 16.9 | 4.4 | 61.4 | 1.1 |
| 2022 | 14.9 | 18.7 | 4.4 | 60.8 | 1.2 |
| Source: Statistics Canada, Labour Force Survey, 1976 to 2022. | |||||
Data table for Chart 2b
| Reference year | Men | ||||
|---|---|---|---|---|---|
| Incorporated with employees | Incorporated without employees | Unincorporated with employees | Unincorporated without employees | Unpaid family worker | |
| percent | |||||
| 1976 | 20.8 | 4.3 | 24.0 | 47.6 | 3.2 |
| 1977 | 22.8 | 4.4 | 24.4 | 45.1 | 3.3 |
| 1978 | 23.1 | 4.6 | 23.5 | 45.7 | 3.1 |
| 1979 | 24.1 | 4.4 | 22.8 | 45.6 | 3.0 |
| 1980 | 27.4 | 4.9 | 20.6 | 44.8 | 2.4 |
| 1981 | 28.6 | 5.3 | 20.5 | 43.0 | 2.5 |
| 1982 | 28.8 | 5.7 | 21.6 | 41.5 | 2.4 |
| 1983 | 28.7 | 5.9 | 21.8 | 41.0 | 2.7 |
| 1984 | 27.6 | 5.9 | 21.1 | 43.3 | 2.2 |
| 1985 | 28.5 | 5.7 | 22.5 | 41.5 | 1.8 |
| 1986 | 29.1 | 6.0 | 22.1 | 41.1 | 1.8 |
| 1987 | 29.4 | 6.3 | 21.0 | 41.5 | 1.7 |
| 1988 | 31.4 | 6.2 | 20.1 | 41.0 | 1.4 |
| 1989 | 30.7 | 6.8 | 20.2 | 41.2 | 1.1 |
| 1990 | 30.3 | 7.5 | 19.6 | 41.6 | 1.1 |
| 1991 | 30.8 | 7.7 | 19.5 | 41.0 | 1.0 |
| 1992 | 30.2 | 8.4 | 18.6 | 41.7 | 1.1 |
| 1993 | 29.9 | 8.2 | 18.0 | 42.5 | 1.3 |
| 1994 | 27.7 | 8.8 | 18.6 | 43.9 | 0.9 |
| 1995 | 28.9 | 9.1 | 17.4 | 43.5 | 1.0 |
| 1996 | 27.1 | 10.1 | 16.7 | 45.2 | 0.9 |
| 1997 | 26.7 | 12.1 | 13.9 | 46.1 | 1.2 |
| 1998 | 25.2 | 11.7 | 13.8 | 48.2 | 1.1 |
| 1999 | 25.8 | 12.9 | 13.1 | 47.3 | 1.0 |
| 2000 | 25.2 | 14.0 | 13.5 | 46.4 | 0.8 |
| 2001 | 25.1 | 15.2 | 13.8 | 45.2 | 0.7 |
| 2002 | 24.9 | 16.0 | 13.3 | 45.1 | 0.7 |
| 2003 | 24.8 | 16.8 | 12.6 | 45.0 | 0.8 |
| 2004 | 26.0 | 17.4 | 12.2 | 43.8 | 0.6 |
| 2005 | 27.1 | 18.0 | 11.5 | 42.8 | 0.6 |
| 2006 | 26.8 | 18.1 | 10.9 | 43.6 | 0.6 |
| 2007 | 26.1 | 19.4 | 10.6 | 43.3 | 0.6 |
| 2008 | 26.5 | 19.8 | 10.4 | 42.7 | 0.6 |
| 2009 | 26.7 | 19.9 | 9.3 | 43.5 | 0.5 |
| 2010 | 26.5 | 20.7 | 9.3 | 43.1 | 0.4 |
| 2011 | 26.4 | 21.1 | 8.8 | 43.3 | 0.5 |
| 2012 | 26.4 | 21.7 | 8.3 | 43.2 | 0.4 |
| 2013 | 26.9 | 22.4 | 8.2 | 41.9 | 0.6 |
| 2014 | 26.4 | 22.7 | 7.8 | 42.6 | 0.6 |
| 2015 | 27.1 | 22.9 | 7.7 | 41.9 | 0.5 |
| 2016 | 26.7 | 24.7 | 7.4 | 40.7 | 0.6 |
| 2017 | 26.8 | 25.3 | 6.8 | 40.5 | 0.6 |
| 2018 | 27.8 | 25.5 | 6.3 | 39.8 | 0.6 |
| 2019 | 26.4 | 26.9 | 6.3 | 39.7 | 0.6 |
| 2020 | 26.0 | 25.7 | 5.9 | 41.9 | 0.4 |
| 2021 | 26.2 | 26.4 | 5.8 | 41.2 | 0.4 |
| 2022 | 26.4 | 27.3 | 5.8 | 40.2 | 0.3 |
| Source: Statistics Canada, Labour Force Survey, 1976 to 2022. | |||||
Looking at incorporated and unincorporated together, the self-employed were more likely to be operating without employees. This was especially true for women (80% in 2022) compared to men (68%). Self-employed men were more likely than women to have employees (32% versus 19% in 2022). However, this gap was lower in 2022 (13 percentage points) compared to 1976 (29 percentage points).
Among both women and men, the self-employed were most likely to be unincorporated without paid help. This was more likely to be the case among women (61% in 2022) compared to men (40%).
The proportion of incorporated self-employed increased over time. This was especially true for those without paid help. In 1976, a very small proportion of self-employed men (4%) and women (2%) were incorporated without paid help. This category saw the largest increase between 1976 and 2022, with a jump of 23 percentage point for men and 16 percentage points for women.
One reason for the growth in incorporated self-employed is a change in the industry mix. For example, self-employment in agriculture has declined while it has increased in the professional, scientific and technical sector.Note Self-employed in the latter are more likely to be incorporated compared to those in the former.Note Also, there are advantages that come along with incorporation, namely limited personal liability and tax advantages.
The results related to the type of self-employment were similar for the age groups 25 to 54 and 55 and older, regardless of sex. The sample size was not large enough to examine trends for the youngest self-employed.
In 2022, one in five self-employed women were working in the health care and social assistance industry
In 2022, one half of self-employed women were working in three industries: health care and social assistance (20%); professional, scientific and technical (19%); and services other than public administration (11%).Note The industry mix was somewhat different in 1987, when 20% were in services other than public administration, 16% in agriculture, 16% in retail trade, and 15% in health care and social assistance.Note
Between 1987 and 2022, the largest declines were seen in agriculture (13 percentage points), retail trade (9 percentage points) and services other than public administration (8 percentage points). The largest gains were recorded in professional, scientific and technical (13 percentage points) and health care and social assistance (6 percentage points).
Looking at decade over decade changes, a notable decline in self-employment in agriculture and services other than public administration occurred between 1987 and 1997. This decade was also characterized by a notable increase among self-employed in the professional, scientific and technical sector.
In 2022, retail and wholesale trade managers was the most common occupation among self-employed women
In 2022, retail and wholesale trade managers represented the occupation with the greatest number of self-employed women, with 7% working in this occupation (Table 1). Self-employed retail and wholesale trade managers own and operate their own stores. This occupation was followed by early childhood educators and assistants (5%), real estate agents and salespersons (5%), light duty cleaners (4%) and hairstylists and barbers (4%).
Of the five most common occupations among self-employed women, three were the same in 1987 and 2022.Note These were early childhood educators and assistants and retail and wholesale trade managers (11% each in 1987); and hairstylists and barbers (5%). Two of the top five common occupations that were different in 1987 included home childcare providers (9%)Note and managers in agriculture (8%).
When looking at gender differences in the top occupations, two of the five most common self-employed occupations were the same – 1) retail and wholesale trade managers and 2) real estate agents and salespersons. Some occupations were much more common among men. In 2022, the occupation with the highest proportion of self-employed men was home building and renovation managers (8%). This was followed by retail and wholesale trade managers (6%), managers in agriculture (5%), transport truck drivers (4%), and real estate agents and salespersons (3%).
| Gender and occupation | 1987 | 2022 |
|---|---|---|
| percentage | ||
| Women | ||
| Retail and wholesale trade managers | 10.9 | 6.5 |
| Early childhood educators and assistants | 11.0 | 4.6 |
| Real estate agents and salespersons | Note ...: not applicable | 4.5 |
| Light duty cleaners | Note ...: not applicable | 4.4 |
| Hairstylists and barbers | 4.6 | 4.3 |
| Home child care providers | 8.5 | Note ...: not applicable |
| Managers in agriculture | 7.7 | Note ...: not applicable |
| Men | ||
| Home building and renovation managers | 2.6 | 8.3 |
| Retail and wholesale trade managers | 9.4 | 6.0 |
| Managers in agriculture | 18.1 | 5.2 |
| Transport truck drivers | Note ...: not applicable | 4.0 |
| Real estate agents and salespersons | Note ...: not applicable | 3.3 |
| Restaurant and food service managers | 3.2 | Note ...: not applicable |
| Sales and account representatives - wholesale trade (non-technical) | 2.6 | Note ...: not applicable |
|
... not applicable Source: Statistics Canada, Labour Force Survey, 1987 and 2022. |
||
Greater diversity in occupations among self-employed women in 2022 than in 1987
Occupational concentration, defined in this article as the proportion employed in the five most common occupations, changed over time. In 1987, 43% of self-employed women were concentrated in the top five occupations. This proportion dropped to 24% in 2022. Occupational concentration also decreased among self-employed men but not by as much (36% in 1987 to 27% in 2022). As a result, whereas self-employed women were more likely to be concentrated in a few occupations compared to their male counterparts in 1987, they were slightly less likely in 2022.Note
One in five of working Korean Canadian women were self-employed in 2021
Based on census data, in 2021, 14% of racialized Canadians were self-employed, accounting for 25% of the total self-employed population in Canada.Note Overall, there was little difference in the self-employment rate between the racialized population (14%) and the non-racialized, non-Indigenous population (15%).
This small difference was due to the difference in the rate among racialized and non-racialized women (10% versus 12%). The rates for men were similar (around 18%). Racialized men accounted for 27% of the male self-employed population, and racialized women for 23% of the female self-employed population.
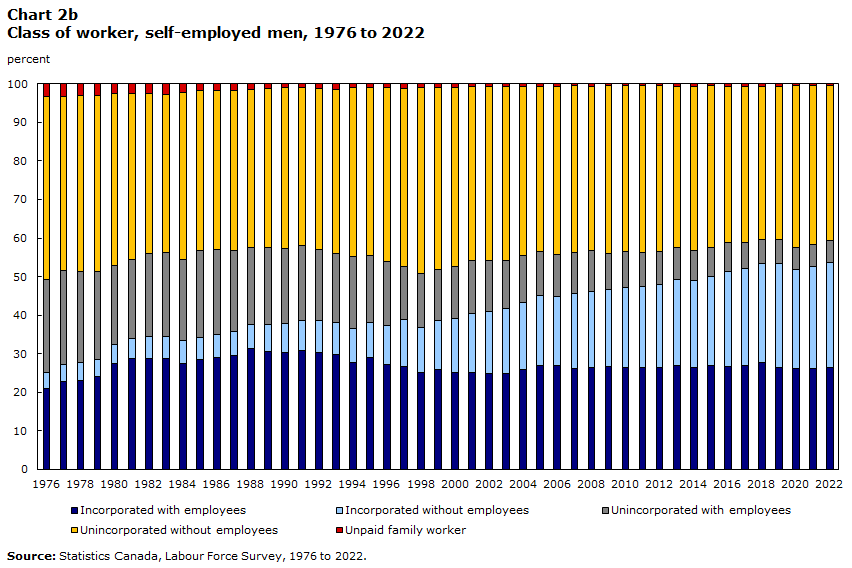
The overall self-employment rate for the racialized population hides important differences among different racialized groups. Among women, Korean Canadians had the highest self-employment rate, with one in five (20%) being self-employed (Chart 3a). This rate was even higher two decades earlier when, in 2001, more than one in three (34%) of Korean Canadian women were self-employed. High self-employment rates among the Korean population in CanadaNote and U.S.Note have been noted in earlier studies.
Among women, other racialized groups with higher rates of self-employment in 2021 included Chinese Canadians (16%), West-Asian Canadians (15%), Japanese Canadians (14%) and South-East Asian Canadians (13%).Note At the other end of the spectrum, Filipino Canadians (5%) and Black Canadians (6%) had notably lower self-employment rates. These two groups also had the lowest rates in 2001.
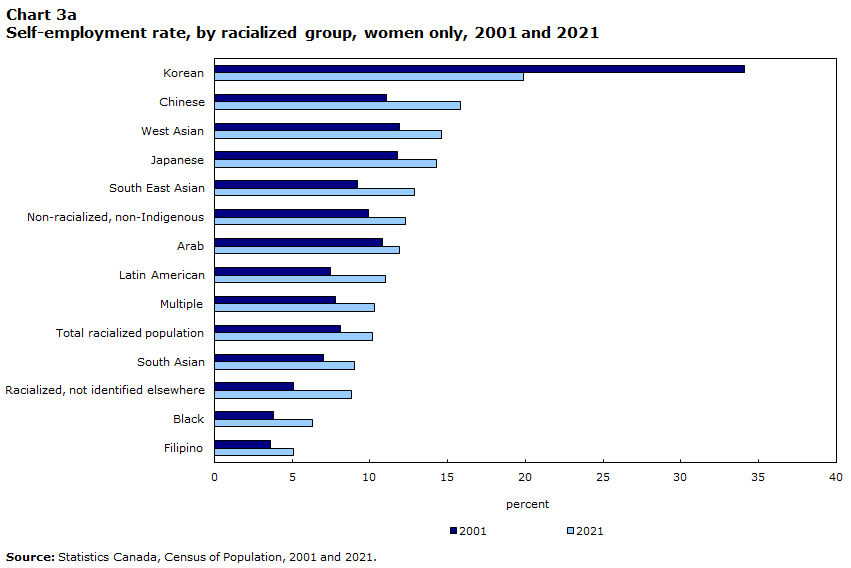
Similar to their women counterparts, Korean Canadian men had the highest self-employment rate of all racialized groups in 2001 at 37% (Chart 3b). However, unlike for women, their rate was not the highest in 2021. Self-employment among men was the highest for West-Asian Canadians (29%), followed by Korean (23%) and Arab Canadians (23%). Chinese (21%) and South Asian Canadians (20%) also had rates that were higher than non-racialized, non-Indigenous men (18%). As was the case with women, Filipino Canadian men (5%) had a lower self-employment rate.
Though Korean Canadian women had the highest self-employment rates, given their relatively small population size, they accounted for only 5% of the total self-employed racialized Canadian women. The groups that accounted for the most were Chinese Canadians (27%) and South Asian Canadians (22%). Similarly, among racialized Canadian men, South Asians (36%) and Chinese (19%) accounted for most of the self-employed. West-Asian and Korean Canadian men, despite having high self-employment rates, were a relatively smaller proportion of the self-employed – 6% and 3%, respectively.
Racialized men were more likely to be self-employed compared to their female counterparts, with the largest gender difference in the self-employment rate in 2021 being among West-Asian Canadians (14 percentage points) followed by South Asian Canadians (11 percentage points) and Arab Canadians (11 percentage points). There was no gender difference among Filipino Canadians and a small difference among South-East Asian Canadians (1 percentage point). The ranking was mostly similar in 2001: West-Asian Canadians (11 percentage points); Arab Canadians (9 percentage points); South Asian Canadians (6 percentage points) with the largest differences and Filipino Canadians and South-East Asian Canadians with no difference.
Data table for Chart 3a
| Racialized group | Women | |
|---|---|---|
| 2001 | 2021 | |
| percent | ||
| Korean | 34.1 | 19.9 |
| Chinese | 11.1 | 15.8 |
| West Asian | 11.9 | 14.6 |
| Japanese | 11.8 | 14.3 |
| South East Asian | 9.2 | 12.9 |
| Non-racialized, non-Indigenous | 9.9 | 12.3 |
| Arab | 10.8 | 11.9 |
| Latin American | 7.5 | 11.0 |
| Multiple | 7.8 | 10.3 |
| Total racialized population | 8.1 | 10.2 |
| South Asian | 7.0 | 9.0 |
| Racialized, not identified elsewhere | 5.1 | 8.8 |
| Black | 3.8 | 6.3 |
| Filipino | 3.6 | 5.1 |
| Source: Statistics Canada, Census of Population, 2001 and 2021. | ||

Data table for Chart 3b
| Racialized group | Men | |
|---|---|---|
| 2001 | 2021 | |
| percent | ||
| West Asian | 22.4 | 28.8 |
| Korean | 36.6 | 23.3 |
| Arab | 19.8 | 22.6 |
| Chinese | 16.9 | 21.1 |
| South Asian | 13.0 | 20.4 |
| Non-racialized, non-Indigenous | 16.1 | 17.6 |
| Total racialized population | 13.5 | 17.5 |
| Japanese | 16.8 | 17.1 |
| Racialized, not identified elsewhere | 10.5 | 16.7 |
| Multiple | 11.7 | 14.5 |
| Latin American | 9.2 | 14.1 |
| South East Asian | 9.4 | 13.8 |
| Black | 9.2 | 13.0 |
| Filipino | 4.0 | 5.1 |
| Source: Statistics Canada, Census of Population, 2001 and 2021. | ||
The association between age and self-employment - older individuals being more likely to be self-employed - holds across all racialized groups. However, the difference was more pronounced among Korean and West Asian Canadians. For example, in 2021, 43% of female Korean Canadians 55 years of age and older were self-employed, compared to 17% of their younger counterparts aged 25 to 54. Among Korean men, the self-employment rates were 52% and 18% for the two respective age groups.
Self-employed South-Asian Canadian women more likely to be incorporated
In 2021, the most common type of self-employment was unincorporated without paid help. This was true for both the racialized population (44%) and non-racialized, non-Indigenous population (50%). Both groups were equally as likely to be incorporated with paid help (21% each) and unpaid family workers (2% each). Racialized Canadians were somewhat more likely than non-racialized, non-Indigenous to be incorporated without paid help (21% versus 17%) and unincorporated with paid help (12% versus 10%).
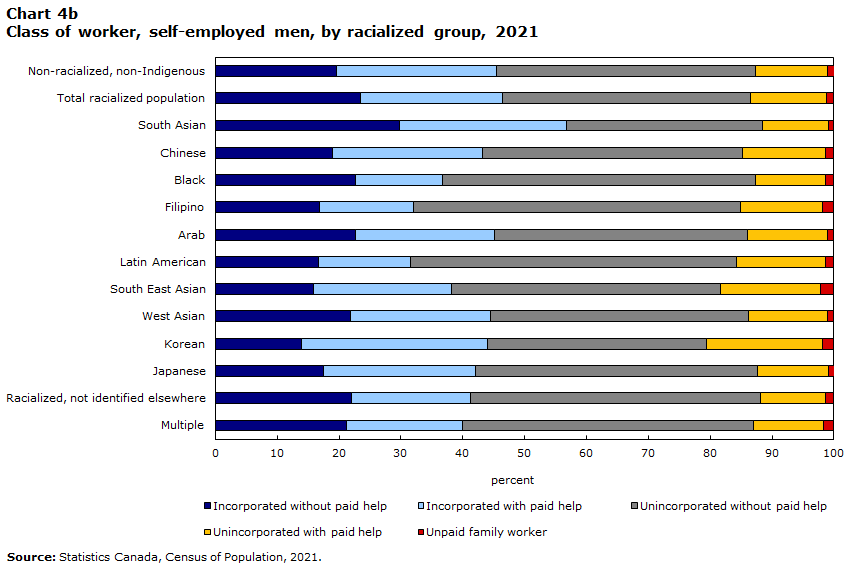
Among self-employed racialized Canadian women, Koreans (23%) were the most likely to be incorporated with paid help (Chart 4a). They were also the most likely to be unincorporated with paid help (18%). Self-employment without paid help was most common among South Asian and Japanese women. Specifically, South Asian Canadian women (23%) had the highest proportion of those who were incorporated without paid help, and Japanese women (66%) had the highest proportion of self-employed unincorporated without paid help. Lastly, South Asian self-employed women (4%) were more likely than other groups to be unpaid family workers.
There were similarities in the type of self-employment among various racialized groups of men and women. For example, as was the case with their female counterparts, South Asian men (30%) were the most likely to be incorporated without paid help; and Korean men the most likely to be incorporated with paid help (30%) and unincorporated with paid help (19%) (Chart 4b). However, unlike women, Latin American and Filipino men (53%, each), rather than Japanese men had the highest proportion of unincorporated self-employed without paid help.

Data table for Chart 4a
| Racialized group | Women | ||||
|---|---|---|---|---|---|
| Incorporated without paid help | Incorporated with paid help | Unincorporated without paid help | Unincorporated with paid help | Unpaid family worker | |
| percent | |||||
| Non-racialized, non-Indigenous | 13.5 | 13.7 | 61.8 | 7.8 | 3.1 |
| Total racialized population | 17.1 | 16.4 | 52.0 | 11.5 | 3.0 |
| South Asian | 23.1 | 21.9 | 41.3 | 9.7 | 4.2 |
| Chinese | 17.5 | 17.0 | 52.1 | 11.1 | 2.4 |
| Black | 16.4 | 11.2 | 59.4 | 9.9 | 3.2 |
| Filipino | 10.0 | 8.9 | 65.2 | 13.5 | 2.4 |
| Arab | 16.6 | 16.4 | 50.3 | 13.4 | 3.3 |
| Latin American | 12.0 | 9.1 | 64.4 | 12.0 | 2.5 |
| South East Asian | 13.0 | 19.0 | 46.9 | 17.9 | 3.2 |
| West Asian | 18.7 | 15.7 | 52.8 | 9.9 | 3.0 |
| Korean | 12.1 | 23.4 | 42.9 | 18.2 | 3.5 |
| Japanese | 12.6 | 11.2 | 66.2 | 8.2 | 1.8 |
| Racialized, not identified elsewhere | 16.3 | 12.8 | 59.5 | 8.6 | 2.7 |
| Multiple | 15.5 | 13.8 | 58.8 | 9.0 | 2.9 |
| Source: Statistics Canada, Census of Population, 2021. | |||||
Data table for Chart 4b
| Racialized group | Men | ||||
|---|---|---|---|---|---|
| Incorporated without paid help | Incorporated with paid help | Unincorporated without paid help | Unincorporated with paid help | Unpaid family worker | |
| percent | |||||
| Non-racialized, non-Indigenous | 19.6 | 25.8 | 41.9 | 11.7 | 1.1 |
| Total racialized population | 23.4 | 23.0 | 40.1 | 12.3 | 1.2 |
| South Asian | 29.7 | 27.0 | 31.7 | 10.7 | 0.9 |
| Chinese | 19.0 | 24.2 | 42.1 | 13.3 | 1.4 |
| Black | 22.6 | 14.1 | 50.7 | 11.3 | 1.3 |
| Filipino | 16.9 | 15.2 | 52.8 | 13.2 | 1.9 |
| Arab | 22.6 | 22.5 | 41.0 | 12.9 | 1.0 |
| Latin American | 16.6 | 15.0 | 52.7 | 14.3 | 1.4 |
| South East Asian | 15.9 | 22.3 | 43.4 | 16.2 | 2.2 |
| West Asian | 21.9 | 22.5 | 41.8 | 12.7 | 1.0 |
| Korean | 13.9 | 30.1 | 35.4 | 18.7 | 1.9 |
| Japanese | 17.4 | 24.6 | 45.7 | 11.5 | 0.9 |
| Racialized, not identified elsewhere | 22.0 | 19.2 | 46.9 | 10.5 | 1.4 |
| Multiple | 21.2 | 18.8 | 47.0 | 11.4 | 1.6 |
| Source: Statistics Canada, Census of Population, 2021. | |||||
In 2021, one in ten self-employed racialized women worked as real estate agents and salespersons, as well as retail and wholesale trade managers
Among racialized self-employed women, the top occupations were real estate agents and salespersons (5%), retail and wholesale trade managers (5%), light duty cleaners (4%), restaurant and food service managers (3%), estheticians, electrologists and related occupations (3%), and home childcare providers (3%) (Table 2). Their non-racialized, non-Indigenous counterparts were more likely to be working as managers in agriculture (5%), light duty cleaners (5%), accounting technicians and bookkeepers (4%), hairstylists and barbers (4%) and real estate agents and salespersons (4%).
Among racialized self-employed men, more than one in ten (11%) worked as transport truck drivers. Another 6% were taxi and limousine drivers and chauffeurs. The occupation employing the most self-employed non-racialized, non-Indigenous men was mangers in agriculture (8%) followed by retail and wholesale trade managers (4%).
Combined, the five most common occupations accounted for 24% of all self-employed racialized Canadians. This proportion was lower among the non-racialized, non-Indigenous population, at 18%. This difference is entirely explained by differences in occupational concentration among men (30% for racialized versus 22% for non-racialized, non-Indigenous). For women, the concentration was the same for both the racialized and non-racialized self-employed populations, at 21%.
As noted earlier, Korean Canadian women had the highest self-employment rate among self-employed women. More than one in five (23%) worked as retail and wholesale trade managers (14%) and restaurant and food service managers (9%). For the two racialized groups that accounted for the most self-employed women, the two most common occupations were real estate agents and salespersons (9% for Chinese and 5% for South Asians) and retail and wholesale trade managers (6% and 5% for the two respective groups).
For the most part, there was an overlap in the top five occupations across racialized groups among women. Some top five occupations that were unique to certain self-employed racialized groups, included insurance agents and brokers among Filipino women; pharmacists among Arab women; dentists among West Asian women; and translators and electrologists, musicians and singers, and graphic designers and illustrators among Japanese women.
As was the case with their self-employed women counterparts, a notable proportion of Korean Canadian men worked as retail and wholesale trade managers (16%) and restaurant and food service managers (8%). The most common occupations among West-Asian men, another group with a relatively high self-employment rate, were taxi and limousine drivers and chauffeurs (9%) and real estate agents and salespersons (5%).
| Racialized group | Women+ | Men+ | ||
|---|---|---|---|---|
| Top five occupations | percentage | Top five occupations | percentage | |
| Non-racialized, non-Indigenous | Managers in agriculture | 4.6 | Managers in agriculture | 8.2 |
| Light duty cleaners | 4.5 | Retail and wholesale trade managers | 4.2 | |
| Accounting technicians and bookkeepers | 4.2 | Transport truck drivers | 3.4 | |
| Hairstylists and barbers | 4.0 | Carpenters | 3.3 | |
| Real estate agents and salespersons | 3.9 | Senior managers - financial, communications and other business services | 2.9 | |
| Total racialized population | Real estate agents and salespersons | 5.3 | Transport truck drivers | 10.6 |
| Retail and wholesale trade managers | 4.9 | Taxi and limousine drivers and chauffeurs | 6.4 | |
| Light duty cleaners | 4.4 | Retail and wholesale trade managers | 5.0 | |
| Restaurant and food service managers | 3.3 | Real estate agents and salespersons | 4.6 | |
| Estheticians, electrologists and related occupations | 3.0 | Delivery service drivers and door-to-door distributors | 3.7 | |
| South Asian | Real estate agents and salespersons | 4.7 | Transport truck drivers | 20.5 |
| Retail and wholesale trade managers | 4.5 | Taxi and limousine drivers and chauffeurs | 8.1 | |
| General practitioners and family physicians | 4.1 | Real estate agents and salespersons | 4.9 | |
| Home child care providers | 3.7 | Retail and wholesale trade managers | 4.6 | |
| Restaurant and food service managers | 2.9 | Delivery service drivers and door-to-door distributors | 3.9 | |
| Chinese | Real estate agents and salespersons | 8.9 | Real estate agents and salespersons | 7.8 |
| Retail and wholesale trade managers | 6.2 | Retail and wholesale trade managers | 6.9 | |
| Restaurant and food service managers | 3.7 | Restaurant and food service managers | 3.8 | |
| Retail salespersons and visual merchandisers | 3.7 | Home building and renovation managers | 2.9 | |
| General practitioners and family physicians | 2.3 | Delivery service drivers and door-to-door distributors | 2.6 | |
| Black | Light duty cleaners | 5.6 | Taxi and limousine drivers and chauffeurs | 12.3 |
| Early childhood educators and assistants | 4.1 | Transport truck drivers | 9.9 | |
| Hairstylists and barbers | 3.9 | Delivery service drivers and door-to-door distributors | 5.1 | |
| Nurse aides, orderlies and patient service associates | 3.7 | Retail and wholesale trade managers | 2.9 | |
| Retail and wholesale trade managers | 3.7 | Real estate agents and salespersons | 2.1 | |
| Filipino | Light duty cleaners | 13.8 | Delivery service drivers and door-to-door distributors | 4.9 |
| Nurse aides, orderlies and patient service associates | 7.5 | Transport truck drivers | 4.2 | |
| Home child care providers | 7.1 | Light duty cleaners | 3.9 | |
| Insurance agents and brokers | 4.0 | Real estate agents and salespersons | 2.9 | |
| Massage therapists | 3.7 | Retail and wholesale trade managers | 2.8 | |
| Arab | Early childhood educators and assistants | 13.1 | Taxi and limousine drivers and chauffeurs | 11.4 |
| Light duty cleaners | 5.1 | Transport truck drivers | 8.1 | |
| Pharmacists | 4.0 | Retail and wholesale trade managers | 5.5 | |
| General practitioners and family physicians | 3.9 | Delivery service drivers and door-to-door distributors | 4.6 | |
| Retail and wholesale trade managers | 3.4 | Restaurant and food service managers | 4.3 | |
| Latin American | Light duty cleaners | 15.6 | Transport truck drivers | 5.1 |
| Early childhood educators and assistants | 5.4 | Contractors and supervisors, other construction trades, installers, repairers and servicers | 4.9 | |
| Home child care providers | 3.9 | Carpenters | 4.9 | |
| Real estate agents and salespersons | 3.0 | Construction trades helpers and labourers | 4.5 | |
| Estheticians, electrologists and related occupations | 2.8 | Light duty cleaners | 4.4 | |
| Southeast Asian | Estheticians, electrologists and related occupations | 15.0 | Restaurant and food service managers | 5.8 |
| Restaurant and food service managers | 6.3 | Retail and wholesale trade managers | 3.5 | |
| Hairstylists and barbers | 4.8 | Estheticians, electrologists and related occupations | 3.3 | |
| Retail and wholesale trade managers | 3.4 | Real estate agents and salespersons | 2.8 | |
| Light duty cleaners | 3.4 | Home building and renovation managers | 2.6 | |
| West Asian | Real estate agents and salespersons | 9.1 | Taxi and limousine drivers and chauffeurs | 8.8 |
| Hairstylists and barbers | 4.6 | Real estate agents and salespersons | 5.4 | |
| Dentists | 4.1 | Transport truck drivers | 5.1 | |
| Estheticians, electrologists and related occupations | 3.9 | Delivery service drivers and door-to-door distributors | 5.0 | |
| Retail and wholesale trade managers | 3.1 | Retail and wholesale trade managers | 4.5 | |
| Korean | Retail and wholesale trade managers | 14.3 | Retail and wholesale trade managers | 15.9 |
| Restaurant and food service managers | 8.8 | Restaurant and food service managers | 7.8 | |
| Retail salespersons and visual merchandisers | 3.7 | Real estate agents and salespersons | 4.3 | |
| Real estate agents and salespersons | 3.6 | Chefs | 3.9 | |
| Estheticians, electrologists and related occupations | 2.7 | Retail salespersons and visual merchandisers | 2.5 | |
| Japanese | Massage therapists | 4.2 | Retail and wholesale trade managers | 4.7 |
| Translators, terminologists and interpreters | 4.0 | Restaurant and food service managers | 3.1 | |
| Musicians and singers | 3.8 | Chefs | 2.5 | |
| Hairstylists and barbers | 3.8 | Professional occupations in business management consulting | 2.2 | |
| Graphic designers and illustrators | 3.3 | General practitioners and family physicians | 2.2 | |
|
Note: Given that the non-binary population is small, data aggregation to a two-category gender variable is sometimes necessary to protect the confidentiality of responses provided. In these cases, individuals in the category "non-binary persons" are distributed into the other two gender categories and are denoted by the "+" symbol. The category "Men+" includes men, as well as some non-binary persons. The category "Women+" includes women, as well as some non-binary persons. Source: Statistics Canada, Census of Population, 2021. |
||||
Immigrant men and women more likely to be self-employed compared to their non-immigrant counterparts
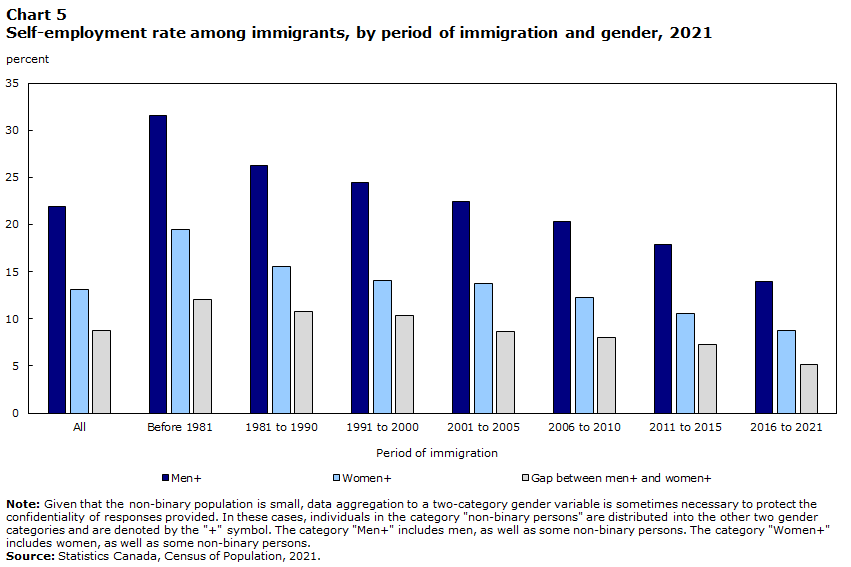
Immigrants are more likely to be self-employed compared to non-immigrants. For example, in 2021, the self-employment rate among immigrants was 18% compared to 14% among non-immigrants. This gap was more evident among men (22% versus 16%) than women (13% versus 11%).
While immigrant men are more likely than immigrant women to be self-employed, the difference was lower among recent immigrants. Among those who immigrated before 1991, 29% of men and 18% of women were self-employed, a difference of 11 percentage points (Chart 5). This difference was lower among those who immigrated between 2011 and 2021 (16% versus 10%: 6 percentage points).
Similar to their self-employed non-immigrant counterparts, immigrant women were more likely than immigrant men to be unincorporated without paid help (54% versus 40%) and less likely to be incorporated (with or without paid help) or unincorporated with paid help.
There were occupational differences between self-employed immigrant and non-immigrant women. In 2021, the former were more likely to be working as real estate agents and salespersons, light duty cleaners and retail and wholesale trade managers (5% each). In comparison, the top occupations for self-employed non-immigrant women were managers in agriculture, hairstylists and barbers, light duty cleaners, and accounting technicians and bookkeepers (4% each). Lastly, the occupational profile of self-employed immigrant women differed from their male counterparts. Immigrant men were more likely to be working as transport truck drivers (10%) and taxi and limousine drivers and chauffeurs (5%).
Data table for Chart 5
| Period of immigration | Men+ | Women+ | Gap between men+ and women+ |
|---|---|---|---|
| percent | |||
| All | 21.9 | 13.1 | 8.8 |
| Before 1981 | 31.6 | 19.5 | 12.1 |
| 1981 to 1990 | 26.3 | 15.5 | 10.8 |
| 1991 to 2000 | 24.5 | 14.1 | 10.4 |
| 2001 to 2005 | 22.4 | 13.7 | 8.7 |
| 2006 to 2010 | 20.3 | 12.3 | 8.0 |
| 2011 to 2015 | 17.9 | 10.6 | 7.3 |
| 2016 to 2021 | 14.0 | 8.8 | 5.2 |
|
Note: Given that the non-binary population is small, data aggregation to a two-category gender variable is sometimes necessary to protect the confidentiality of responses provided. In these cases, individuals in the category "non-binary persons" are distributed into the other two gender categories and are denoted by the "+" symbol. The category "Men+" includes men, as well as some non-binary persons. The category "Women+" includes women, as well as some non-binary persons. Source: Statistics Canada, Census of Population, 2021. |
|||
Indigenous people less likely to be self-employed compared to the non-Indigenous population
In 2021, the self-employment rate among the Indigenous population (10%) was lower than the non-Indigenous population (15%).Note This was true for both men (11% versus 18%) and women (9% versus 12%). The self-employment rate for First Nations people living off reserve was 10% for men and 7% for women. For Métis men and women, the proportions were 14% and 10%, respectively. Among Inuit, the self-employment rate was 5% for men and 4% for women.Note
Light duty cleaners was the most common occupation among self-employed First Nations women living off reserve and Métis women
Self-employed Indigenous people are less likely to be incorporated compared to the non-Indigenous population (29% versus 39%). This was true for First Nations people living off reserve (25%), Métis (33%) and Inuit (22%). Almost one in five (19%) of self-employed First Nations women living off reserve were incorporated, a rate lower than their male counterparts (30%).
The occupation employing the greatest number of self-employed First Nations women living off reserve was light duty cleaners (6%) (Table 3). This was followed by hairstylists and barbers (5%), retail and wholesale trade managers (4%), massage therapists (3%) and estheticians, electrologists and related occupations (3%). The most common occupations among self-employed First Nations men living off reserve was carpenters (6%) followed by transport truck drivers (4%).
Around 7% of self-employed Métis women worked as light duty cleaners. Another 5% were employed as hairstylists and barbers followed by massage therapists (5%), accounting technicians and bookkeepers (5%) and home childcare providers (4%). Self-employed Métis men were more likely to work as managers in agriculture (6%) and transport truck drivers (5%). Self-employed Métis women were less likely than their male counterparts to be incorporated (23% versus 41%).
| Indigenous group | Women+ | Men+ | ||
|---|---|---|---|---|
| Top five occupations | percentage | Top five occupations | percentage | |
| First Nations people living off reserve | Light duty cleaners | 6.2 | Carpenters | 6.0 |
| Hairstylists and barbers | 5.3 | Transport truck drivers | 4.3 | |
| Retail and wholesale trade managers | 4.0 | Retail and wholesale trade managers | 3.6 | |
| Massage therapists | 3.4 | Home building and renovation managers | 3.3 | |
| Estheticians, electrologists and related occupations | 3.2 | Construction trades helpers and labourers | 3.1 | |
| Métis | Light duty cleaners | 6.8 | Managers in agriculture | 5.9 |
| Hairstylists and barbers | 5.5 | Transport truck drivers | 4.8 | |
| Massage therapists | 4.6 | Carpenters | 4.3 | |
| Accounting technicians and bookkeepers | 4.5 | Retail and wholesale trade managers | 3.9 | |
| Home child care providers | 4.4 | Contractors and supervisors, other construction trades, installers, repairers and servicers | 2.5 | |
|
Notes: Given that the non-binary population is small, data aggregation to a two-category gender variable is sometimes necessary to protect the confidentiality of responses provided. In these cases, individuals in the category "non-binary persons" are distributed into the other two gender categories and are denoted by the "+" symbol. The category "Men+" includes men, as well as some non-binary persons. The category "Women+" includes women, as well as some non-binary persons. The sample size for the Inuit population was not large enough to obtain reliable estimates. Source: Statistics Canada, Census of Population, 2021. |
||||
Conclusion
Self-employment is fundamentally different from 40 years ago, reflecting shifts to a knowledge-based economy, the rise in the gig economy, and the growth in women’s participation in the labour force. Notably, women make up a growing share of the total self-employed workforce (37%), though still not on par with men. In 2022, 11% of working women were self-employed, lower than the rate for men at 16%.
As the type of industries are vast and the characteristics of self-employment are diverse (incorporated/unincorporated, with/without employees), women’s increasing representation in the self-employed workforce is critically important to understand.
In 2022, self-employed women were concentrated in health care, social assistance and professional, scientific and technical industries, shifting away from the previous concentration as unpaid family workers (mainly in agriculture) decades earlier. Still, in 2022, self-employed women were less likely than men to have employees (19% versus 32%). They were also less likely than men to be incorporated (34% versus 54%). “Incorporated” are generally seen as entrepreneurs who own a separate entity, while the “unincorporated” are often described as own account self-employed individuals.
Future research should examine these gaps in self-employment, with the goal of understanding reasons for the gender differences. Additionally, in light of the changing nature of work, future work should look towards understanding the impact of the gig economy, attributable in part to the increasing popularity of online platforms over the last decade, on women’s employment. For instance, are women turning to gig work as a main source of income or to supplement their income? How does this differ from men’s experiences?
It would also be important to better understand reasons for differences in women’s self-employment across population groups. The current study found that the self-employment rate for racialized women was somewhat similar to that of non-racialized, non-Indigenous women. However, there were notable differences among racialized groups. Korean Canadian women had the highest rate and Filipino and Black Canadian women had the lowest.
In addition, the self-employment rate was slightly lower among Indigenous women living off reserve (9%) compared to non-Indigenous women (12%). In this case, lower rates of self-employment among the Indigenous population can be a result of complex factors including systemic barriers, as well the intergenerational effects of colonization and residential school experiences.
Sharanjit Uppal is a senior researcher at the Centre for Social Data Insights and Innovation at Statistics Canada.
Data sources and definitions
Data sources
This study used data from the Labour Force Survey (LFS) and the Census of Population. Annual LFS data from 1976 to 2022 were used to look at historical trends. Census of Population data from 2001 and 2021 were used to profile various population groups.
LFS is a monthly household survey of approximately 56,000 households resulting in the collection of labour market information for approximately 100,000 individuals. It is conducted nationwide, in both the provinces and the territories. Excluded from the survey's coverage are: persons living on reserves and other Indigenous settlements in the provinces, full-time members of the Canadian Armed Forces, the institutionalized population, and households in extremely remote areas with very low population density. These groups together represent an exclusion of approximately 2% of the population aged 15 and over.
The Census of Population is conducted every five years and gathers demographic, social, economic and cultural information on the Canadian population.
Definitions
Self-employed: Working owners of an incorporated business, farm or professional practice, or working owners of an unincorporated business, farm or professional practice. The latter group also includes self-employed workers who do not own a business (such as babysitters and newspaper carriers). Self-employed workers are further subdivided by those with or without paid help. Also included among the self-employed are unpaid family workers. They are persons who work without pay on a farm or in a business or professional practice owned and operated by another family member living in the same dwelling.
The self-employed are classified based on the job in the reference week. In case, an individual worked at more than one job, it is based on the job at which they worked the most hours.
Industry: Industrial classification is based on the 2017 North American Industry Classification System (NAICS2017).Note LFS data based on NAICS2017 are available from 1987 to 2022.
Occupation: Occupational classification is based on the 2021 National Occupational Classification code (NOC2021).Note LFS data based on NOC2021 are available from 1987 to 2022.
- Date modified: