
Labour Statistics at a Glance
Self-employed Canadians: Who and Why?

Archived Content
Information identified as archived is provided for reference, research or recordkeeping purposes. It is not subject to the Government of Canada Web Standards and has not been altered or updated since it was archived. Please "contact us" to request a format other than those available.
by Lahouaria Yssaad and Vincent Ferrao
Highlights
- In 2018, 2.9 million Canadians were self-employed, up from 1.2 million in 1976. Self-employed workers accounted for 15% of total employment, up from 12% four decades earlier. The highest self-employment rate was in British Columbia.
- Self-employment rose in professional, scientific and technical services, while it fell in agriculture, reflecting changes over time in the industry composition of employment.
- One-third of self-employed workers cited independence, freedom, being one’s own boss as the main reason they were in self-employment. Nature of the job was the second most common reason for being in self-employment.
- For self-employed workers of all age groups, independence and freedom was paramount—particularly for those aged 55 or older.
- More women than men indicated that work-family balance and flexible hours were top reasons motivating their self-employment.
Introduction
Self-employment is a major aspect of labour-market activity and can be an important source of employment growth. While increases in self-employment have sometimes been linked to economic downturns, there appears to be no evidence that economic neccessity is a significant factor in “choosing” this type of work arrangement.Note In fact, “changes in the self-employment rate are more likely driven by structural factors in the economy, such as changes in the age [structure] of the population and increasing importance of certain industrial sectors [which are more amenable to self-employment than] others, rather than business cycle variation.”Note
Data from the Labour Force Survey (LFS) show increases in self-employment during 2007 and 2008—peak years of the most recent pre-recession labour market—that exceeded growth in the number of employees. Yet, the number of self-employed workers also rose in 2009—a recession year—as the number of employees fell. During the last decade, the rate of self-employment—that is the number of self-employed workers as a share of total employment—has been stable, hovering around 15%.Note
Circumstances and motivations of being one’s own boss differ, mirroring the complex dynamic of the labour market. Indeed, one may be “pushed” into self-employment when the labour market deteriorates and the number of employees declines. However, when the number of employees grows, but self-employment also grows and does so even faster, this might suggest that individuals are being “pulled” into self-employment.Note
This study presents a historical profile of self-employed workers over a four-decade-period, from 1976 to 2018. It also describes results from a recent supplement to the September 2018 LFS which probed on the reasons motivating workers to be self-employed in their main job. This was the first time that the LFS collected data on the reasons for self-employment. (See Data source and definitions.)
Self-employment in Canada: Historical summary
In 2018, 2.9 million Canadians were self-employed, up from 1.2 million in 1976. Their proportion of total employment rose from 12% to 15% over the four-decade period (Chart 1). Among all self-employed workers, those who were incorporated (with or without paid help) made up 46% in 2018, up from 21% in 1976. At the same time, the share of those who were unincorporated (with or without paid help) fell from 68% to 53%, while the share of unpaid family workers dropped from 11% to 1%.Note

Data table for Chart 1
| Self-employed as a proportion of total employment (percent) |
|
|---|---|
| 1976 | 12.2 |
| 1977 | 12.2 |
| 1978 | 12.4 |
| 1979 | 12.4 |
| 1980 | 12.4 |
| 1981 | 12.6 |
| 1982 | 13.6 |
| 1983 | 14.0 |
| 1984 | 13.9 |
| 1985 | 14.3 |
| 1986 | 13.8 |
| 1987 | 13.8 |
| 1988 | 14.0 |
| 1989 | 13.9 |
| 1990 | 14.0 |
| 1991 | 14.7 |
| 1992 | 15.1 |
| 1993 | 15.7 |
| 1994 | 15.5 |
| 1995 | 15.7 |
| 1996 | 16.2 |
| 1997 | 17.1 |
| 1998 | 17.2 |
| 1999 | 17.0 |
| 2000 | 16.1 |
| 2001 | 15.3 |
| 2002 | 15.2 |
| 2003 | 15.4 |
| 2004 | 15.4 |
| 2005 | 15.6 |
| 2006 | 15.3 |
| 2007 | 15.5 |
| 2008 | 15.6 |
| 2009 | 16.1 |
| 2010 | 15.8 |
| 2011 | 15.5 |
| 2012 | 15.4 |
| 2013 | 15.4 |
| 2014 | 15.3 |
| 2015 | 15.4 |
| 2016 | 15.3 |
| 2017 | 15.2 |
| 2018 | 15.3 |
| Source: Statistics Canada, Labour Force Survey. | |
British Columbia was the province with the largest prevalence of self-employment in 2018, with 18% of its employed population working as self-employed in their main job; this was up from 12% in 1976 (Table 1). In Saskatchewan, too, the proportion of self-employed workers (17% in 2018) was higher than the national average. However, this was 12 percentage points lower than in 1976, reflecting changes in the industry composition in the province. Indeed, the share of agriculture (an industry characterized by a high prevalence of self-employment) in Saskatchewan’s total employment fell from 25% in 1976 to 7% in 2018.
| 2018 | 1976 | |
|---|---|---|
| percent | ||
| British Columbia | 17.9 | 12.0 |
| Saskatchewan | 17.4 | 29.2 |
| Alberta | 17.2 | 18.1 |
| Ontario | 15.5 | 10.5 |
| Canada | 15.3 | 12.2 |
| Prince Edward Island | 15.3 | 20.0 |
| Manitoba | 14.2 | 13.9 |
| Nova Scotia | 13.3 | 10.6 |
| Quebec | 13.3 | 10.0 |
| New Brunswick | 11.2 | 10.6 |
| Newfoundland and Labrador | 8.6 | 12.0 |
| Source: Statistics Canada, Labour Force Survey. | ||
While men make up the majority of self-employed (62%) in 2018, women’s share increased from 26% to 38% over the last four decades. This increase mirrors women’s growing participation in the labour market over this time period.
Self-employment down in agriculture, up in professional, scientific and technical services
Agriculture remains the industry with the highest prevalence of self-employment, although the proportion fell from 68% in 1987 (when such data first became available) to 57% in 2018 (Chart 2). This likely reflects the rising trend in farm concentration and industrialisation of agriculture.
Professional, scientific and technical services have emerged as the industry with the second highest rate of self-employment among all industries (32% in 2018, up from nearly 27% in 1987). Professional, scientific and technical services include occupations in legal services, accounting, architectural, engineering and related services, computer systems designs, management, scientific and technical consulting, as well as scientific research and development. This is one of the higher paid industries, and much of the expertise in it requires university or college education.

Data table for Chart 2
| 1987 | 2018 | |
|---|---|---|
| Proportion of self-employed workers (percent) | ||
| Agriculture | 68 | 57 |
| Professional, scientific and technical services | 27 | 32 |
| Other services | 29 | 29 |
| Construction | 27 | 27 |
| Business, building and other support services | 19 | 26 |
| Finance, insurance, real estate, rental and leasing | 9 | 19 |
|
Note: The ‘other services’ industry includes repair and maintenance services, services related to civic and professional organizations, as well as personal and laundry services. Source: Statistics Canada, Labour Force Survey. |
||
As women made inroads in the labour market, their share of self-employment increased in a number of industries such as professional, scientific and technical services, where their proportion rose from 23% to 38% between 1987 and 2018. Self-employed women’s proportion also grew in the finance, insurance, real estate, rental and leasing services industry, increasing from 21% to 39% over the same period (Table 2).
| Women's share of total self-employed workers | Number of self-employed women | ||||
|---|---|---|---|---|---|
| percent | thousands | percent change | |||
| 2018 | 1987 | 2018 | 1987 | 1987 to 2018 | |
| All industries | 37.7 | 30.2 | 1079.0 | 513.2 | 110.2 |
| Health care and social assistance | 69.7 | 63.1 | 219.7 | 75.1 | 192.5 |
| Educational services | 66.0 | 68.4 | 54.7 | 11.9 | 359.7 |
| Other services | 55.2 | 54.7 | 129.8 | 101.2 | 28.3 |
| Business, building and other support services | 49.2 | 39.3 | 97.9 | 20.6 | 375.2 |
| Information, culture and recreation | 44.4 | 35.2 | 60.0 | 22.2 | 170.3 |
| Accommodation and food services | 42.7 | 34.1 | 44.4 | 25.0 | 77.6 |
| Finance, insurance, real estate, rental and leasing | 38.6 | 21.1 | 84.2 | 13.9 | 505.8 |
| Professional, scientific and technical services | 37.6 | 23.0 | 174.7 | 30.9 | 465.4 |
| Agriculture | 26.7 | 26.0 | 42.6 | 82.5 | -48.4 |
| Construction | 9.0 | 6.1 | 35.1 | 11.7 | 200.0 |
|
Note: The ‘other services’ industry includes repair and maintenance services, services related to civic and professional organizations, as well as personal and laundry services. Source: Statistics Canada, Labour Force Survey. |
|||||
Reasons for being self-employed
In 2018, the Labour Force Survey collected data on the reasons for self-employment. According to these data, about one third (33.5%) of self-employed workers reported having this type of work arrangement for the independence and freedom it affords (Table 3). Nature of the job, that is, ‘had to be self-employed’ because of the type of employment, was the second top reason at 15%. Fewer than 1 in 10 reported work-family balance as a reason for their choice of self-employment.
| percent | |
|---|---|
| Independence, freedom, being one's own boss | 33.5 |
| Nature of job - had to be self-employed | 15.2 |
| Work-family balance | 8.6 |
| Flexible hours | 8.4 |
| Challenge, creativity, success, satisfaction | 6.6 |
| Could not find suitable paid employment | 5.0 |
| Joined or took over family business | 4.8 |
| Control, responsibility, decision making | 3.4 |
| More money and unlimited income | 3.2 |
|
Note: See complete list of reasons in Data source and definitions. Source: Statistics Canada, Labour Force Survey. |
|
The proportion of self-employed who reported independence, freedom or being their own boss varied provincially: from a low of 29% in Newfoundland and Labrador to a high of 38% in New Brunswick. This proportion was 36% in Quebec and 34% in Ontario, compared to a national average of about 33% (Table 4).
| percent | |
|---|---|
| New Brunswick | 37.5 |
| Quebec | 36.3 |
| Ontario | 34.1 |
| Canada | 33.5 |
| British Columbia | 32.7 |
| Nova Scotia | 32.4 |
| Prince Edward Island | 32.2 |
| Saskatchewan | 31.9 |
| Manitoba | 30.0 |
| Alberta | 29.7 |
| Newfoundland and Labrador | 29.3 |
| Source: Statistics Canada, Labour Force Survey. | |
In contrast, self-employed workers in Newfoundland and Labrador were more likely to cite “nature of job - had to be self-employed” as the main reason motivating their self-employment (23%, compared to a national average of 15%). Self-employed workers in Quebec (12%) and New Brunswick (12%) were the least likely to be self-employed because of the nature of the job.
Physicians, dentists and veterinarians were by far more likely to be self-employed due to the nature of their job, accounting for about 14% of self-employed workers who stated that they had to be their own boss. Nature of job was also cited by self-employed workers in occupations as diverse as managers in agriculture and performing artists. This illustrates aspects of certain occupations that do not lend themselves to employer-employee relationship.
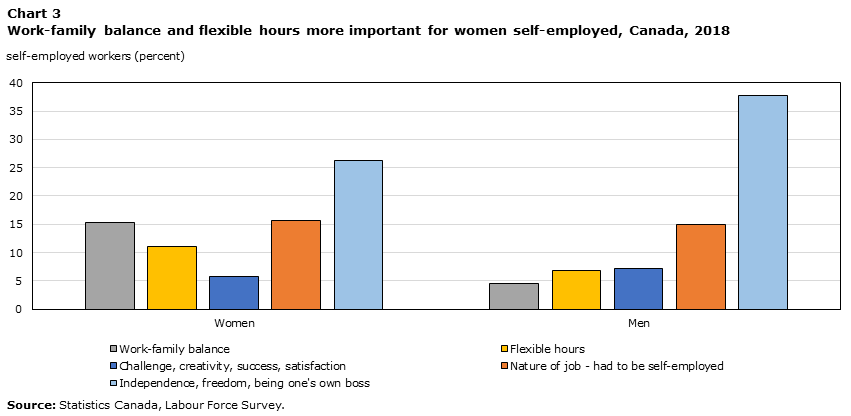
While independence, freedom or being one's own boss were the top reason for both men and women in self-employment, a number of differences were evident (Chart 3). Flexible hours and work-family balance were more common reasons among women. This likely reflects the role of family responsibilities and child-care obligations in women’s preference for a work arrangement that affords more flexibility overall.
Data table for Chart 3
| Women | Men | |
|---|---|---|
| self-employed workers (percent) | ||
| Work-family balance | 15.4 | 4.6 |
| Flexible hours | 11.0 | 6.8 |
| Challenge, creativity, success, satisfaction | 5.7 | 7.2 |
| Nature of job - had to be self-employed | 15.7 | 14.9 |
| Independence, freedom, being one's own boss | 26.3 | 37.8 |
| Source: Statistics Canada, Labour Force Survey. | ||
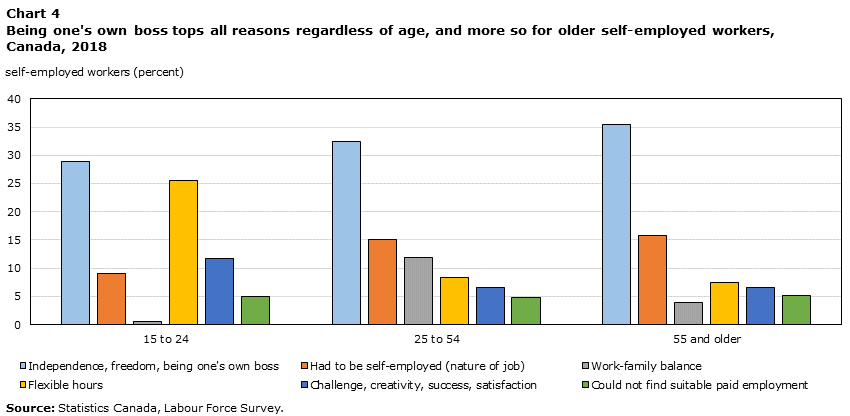
For self-employed workers of all age groups, independence, freedom and the desire to be one’s own boss was paramount—particularly for those aged 55 or older (Chart 4). However, other reasons that motivated self-employment varied from one age group to another. For example, flexible hours and the pursuit of challenge, creativity, success and satisfaction ranked higher for younger self-employed workers than for their older counterparts.
Similarly, work-family balance was a more important reason for core-age self-employed workers (nearly 12%) compared to their younger counterparts aged 15 to 24 (0.6%) or older ones aged 55 and over (almost 4%).
Data table for Chart 4
| 15 to 24 | 25 to 54 | 55 and older | |
|---|---|---|---|
| self-employed workers (percent) | |||
| Independence, freedom, being one's own boss | 28.9 | 32.4 | 35.4 |
| Had to be self-employed (nature of job) | 9.0 | 15.0 | 15.8 |
| Work-family balance | 0.6 | 11.8 | 3.9 |
| Flexible hours | 25.5 | 8.4 | 7.4 |
| Challenge, creativity, success, satisfaction | 11.7 | 6.5 | 6.6 |
| Could not find suitable paid employment | 5.0 | 4.8 | 5.2 |
| Source: Statistics Canada, Labour Force Survey. | |||
Conclusion
A brief look at general trends in self-employment shows some of the changing facets of Canada’s labour market such as the industry composition and the rising labour-force participation of women. In addition, this report examines the reasons motivating some workers to be self-employed in their main job.
The most common reasons cited by self-employed workers were the independence and freedom afforded by this type of work arrangement. The nature of the job was the second most cited reason.
The main reasons for choosing self-employment varied by sex and age, with about 15% of women citing work-family balance, triple the proportion for men (close to 5%). On the other hand, self-employed older workers were more likely to state that their motivation was the independence and freedom afforded by self-employment.
Data source and definitions
Data on the reasons that motivate some workers to be self-employed were collected as part of an ad hoc supplement to the LFS of September 2018. This study uses data from respondents aged 15 and older who reported being self-employed in their main job during the 12 months prior to September 2018. These respondents were asked to indicate the main reason motivating their self-employment.
Main reason for self-employment:
- Could not find suitable paid employment
- Flexible hours
- Balance of work and family
- Possibility to work from home
- Independence / Freedom / Own boss
- Control / Responsibility / Decision making
- Challenge / Creativity / Success / Satisfaction
- More money / Unlimited income
- Lower taxes / Deductions
- Less stress
- Had to be self-employed (nature of job)
- Joined or took over family business
- Other reason- Specify
For more information on self-employment concepts and definitions, see the Guide to the Labour Force Survey (71-543-G).
- Date modified: