
Insights on Canadian Society
Unmasking differences in women’s full-time employment
by Marie Drolet

Text begins
Start of text box
Full-time employment is an integral part of financial well-being and can be linked to several other positive outcomes for workers. Using data from the Labour Force Survey, this article analyses how women’s full-time employment rates evolved from 2007 to 2021. It examines the extent to which aggregate statistics on full-time employment mask the distinct experiences of diverse groups of women, namely Indigenous women, immigrant women and non-Indigenous women born in Canada.
- In 2021, 68% of women aged 20 to 54 were employed full time, up from 65% in 2007. Non-Indigenous women born in Canada (i.e., Canadian-born) (70%) and long-term immigrant (65%) women had the highest rate in 2021, followed by Indigenous women (59%) and recent immigrants (59%).
- The gap in full-time employment rates between Canadian-born and long-term immigrant women widened from less than one percentage point in 2007 to 5 percentage points in 2021, in favour of Canadian-born women.
- The gap in full-time employment rates between Canadian-born and Indigenous women remained unchanged between 2007 and 2021 at 12 percentage points. A similar gap was noted between Canadian-born and recent immigrants.
- Immigrants with a bachelor's degree or higher were significantly less likely to be employed full time than Canadian-born women and this gap did not narrow over time. In 2021, about 80% of Canadian-born women with a bachelor's degree or higher were employed full time compared to 73% of long term immigrants and 62% of recent immigrants.
- Indigenous women with a university degree were just as likely to hold a full-time job (79%) as their Canadian-born counterparts in 2021.
- Marriage and motherhood lower full-time employment for immigrant women, not so for Canadian-born and Indigenous women. In 2021, nearly 72% of recent immigrant women worked full time when they were not part of a couple and did not have children. The percentage of immigrant women employed full time was 64% when they were part of a couple without children and 45% when they were part of a couple where the youngest child were aged 1 to 5. In comparison, 64% of Canadian-born women part of a couple where the youngest child were aged 1 to 5 were employed full time.
End of text box
Introduction
The proportion of women working full time - defined as usually working 30 hours or more per week – continues to increase, albeit at a slower pace than in previous decades. Of all women aged 20 to 54 who were not attending school full time, 68% were employed full time in 2021, up from 65% in 2007 and 55% in 1997. Over the same period, the rate for men hovered around 81%.Note The rising full- time employment rate for women, coupled with a stagnation in men’s rate, caused the gender gap in full-time employment to narrow from 25 percentage points in 1997 and to 13 percentage points by 2022.
Work time influences income and is thus an integral part of current financial well-being. Working full time also shapes future financial well-being by influencing the ability to save, to accumulate financial assets and to prepare for retirement. Working full time may be linked to other positive outcomes such as better access to fringe benefits, greater job stability, improved opportunities for employer sponsored training and better prospects for career advancement.Note Nevertheless, for many women, part-time work offers a way to balance work and the demands of their family. Yet, recent studies continue to show that employers perceive part-time employees as less committed to their organization and give them lower performance evaluations and bonuses.Note
Despite the increase in the proportion of women working in Canada, disparities between population groups of women persist. Research has repeatedly shown that Indigenous and immigrant women have worse labour market outcomes (including employment and earnings) than their non-IndigenousNote and non-immigrantNote counterparts.Note
These differences are often complex and intertwined with pre-existing vulnerabilities and continuing disparities in economic conditions. Indigenous women face pervasive barriers to employment which involve the manifestations of colonization (such as racism, discrimination and negative stereotypes), poverty, lower levels of education and literacy, as well as the impact of intergenerational trauma.Note Identifying the factors that influence the full economic participation of Indigenous women is relevant in the context of the Truth and Reconciliation Commission Calls to Action which emphasize ‘equality of opportunity’ in the Reconciliation process.Note
Immigrant women are more likely to be admitted as a dependent spouse under the economic category of admission and have more difficulty in finding employment as a result of weak language skills, cultural gender roles, and difficulty in having their skills, education or experience recognized.Note
This paper attempts to fill an important gap in our understanding of women in the Canadian labour market. Using data from the Labour Force Survey, this article analyzes how aggregate statistics of women’s full-time employment from 2007 to 2021 mask the distinct experiences of diverse population groups–namely Indigenous women (those self-identifying as First Nations, Métis and/or Inuk (Inuit)), recent immigrant women (those arriving in Canada within the past ten years), long-term immigrant women (those arriving in Canada over 10 years ago) - compared to Canadian-born women (see “Data sources, methods and definitions” text box). This allows for a better understanding of how the dynamics in full-time employment by population group either mirror or deviate from broad patterns by age, education and marriage and motherhood status.Note Policymakers can use this information to inform programs and initiatives that promote selection into and persistence in full-time employment and that better meet the needs of diverse populations of women.
The results are presented for women aged 20 to 54. To highlight the differing experiences of Indigenous women, non-Indigenous women born in Canada, and immigrant women, these groups are treated separately in the analysis. It is important to note this paper focuses on full-time employment rates, that is the proportion of the population employed at least 30 hours per week in their main job, and not on the job characteristics of full-time workers.
Full-time employment increased for women, but the gap between Canadian-born women and long-term immigrants widened
At the same time that women represent a larger portion of the full-time work force in 2021, their population has become more diverse. According to the LFS, immigrant women made up 18% of the female population aged 20 to 54 in 2021 up from 14% in 2007. Indigenous women made up about 3% of the population in 2021 while Canadian-born women made up 67% of the population in 2021 down from 76% in 2007.Note
In 2007, Canadian-born (66%) and long-term immigrant (66%) women had the highest full-time employment rates (FTER), followed by Indigenous (54%) and recent immigrants (54%) (Chart 1). By 2021, the full-time employment rate of Canadian-born women had climbed to 70% compared to little change in that of long-term immigrant (65%) resulting in a gap of 5 percentage points in favour of Canadian-born women. Meanwhile, the rates for Indigenous and recent immigrants increased by about 5 percentage points each, leading to little meaningful decrease in their gap with Canadian-born women by 2021.

Data table for Chart 1
| Reference year | Canadian-born | Indigenous | Recent immigrants | Long-term immigrants |
|---|---|---|---|---|
| percentage | ||||
| 2007 | 66.0 | 54.2 | 53.6 | 66.4 |
| 2008 | 66.7 | 52.6 | 51.8 | 65.0 |
| 2009 | 65.2 | 54.1 | 51.0 | 63.1 |
| 2010 | 65.0 | 51.0 | 49.3 | 62.0 |
| 2011 | 65.7 | 53.3 | 50.4 | 63.6 |
| 2012 | 65.9 | 52.8 | 52.8 | 62.6 |
| 2013 | 66.6 | 55.0 | 51.6 | 63.2 |
| 2014 | 66.3 | 52.7 | 50.7 | 62.9 |
| 2015 | 67.4 | 51.6 | 48.9 | 62.2 |
| 2016 | 67.0 | 51.1 | 53.3 | 62.3 |
| 2017 | 68.1 | 54.8 | 52.0 | 66.3 |
| 2018 | 68.6 | 56.0 | 55.3 | 65.9 |
| 2019 | 69.9 | 58.4 | 56.8 | 66.4 |
| 2020 | 67.8 | 56.5 | 55.4 | 60.9 |
| 2021 | 70.4 | 58.9 | 58.5 | 64.9 |
| Source: Statistics Canada, Labour Force Survey, March and September monthly files, 2007 to 2021. | ||||
In terms of trend, the 2008 financial crisis generated a pervasive reduction in full-time employment that was not felt equally among women. Between 2007 and 2010, recent and long-term immigrants were the hardest hit, experiencing a decline of about 4 percentage points each, followed by Indigenous women at -3 percentage points likely due to their overrepresentation in goods-producing industries that were hardest hit by the downturn. These declines outweighed the drop among Canadian-born women (-1 percentage points) leading to a widening gap between these groups of women by 2010.
The recovery from the financial crisis was also unequal. Canadian-born women reported gains in full-time employment of 2 percentage points by 2015 while other groups reported no tangible difference leading to a widening gap for Indigenous and recent immigrant women relative to Canadian-born women between 2010 and 2015.Note
Stronger labour market conditions in the latter 2010s boosted full-time employment for all groups. Between 2015 and 2019, the gains were greater for Indigenous (7 percentage points), recent immigrant (8 percentage points), and long-term immigrant women (4 percentage points) compared to Canadian-born women (2 percentage points). This narrowed the gap with Canadian-born women.
Employment losses during the COVID-19 pandemic were rapid, substantial but relatively short-lived and had a bigger impact on those who worked part-time and in specific sectors like retail, food and accommodation, personal services.Note While the pandemic caused a ubiquitous drop in full-time employment in 2020, the trends noted pre-pandemic continued in 2021.
Rising labour force participation rates and declining part-time employment are driving the increase in full-time employment among women
Rising labour force participation, falling unemployment and movements away from part-time may have contributed to how full-time employment rates evolved differently for each population group of women.Note More women in Canada participated in the labour force in 2021 than they did in 2007, with Indigenous and recent immigrants making the most notable gains (+6 percentage points each) followed by Canadian-born and long-term immigrant women (+2 percentage points each). Unemployment is traditionally higher among immigrants and Indigenous women than Canadian-born women. However, for recent immigrants, more of those participating in the labour force were employed in 2021 than in 2007. Finally, more employed Canadian-born women are working full time in 2021 than in 2007 while the opposite is true for immigrants.
Between 2007 and 2021, both rising labour force participation rates and falling part-time employment drove the increase in the FTER of Canadian-born women (Table 1). That is, 47% of the change in FTER was due to rising labour force participation rates while 53% was due to a decrease in the incidence of part-time work. In contrast, rising labour force participation rates was the sole factor behind the rise in FTER of Indigenous (87%) and recent immigrant (99%) women. Rising part-time employment (29%) dampened the impact of the rise in labour force participation rates on the FTER of recent immigrants.
| All women | Canadian-born | Indigenous | Recent immigrants | Long-term immigrants | |
|---|---|---|---|---|---|
| percentage | |||||
| Change in FTER | |||||
| 2007-2008 (ref.) | 64.8 | 66.3 | 53.4 | 52.7 | 65.7 |
| 2019-2021 | 67.4Note ** | 70.1Note ** | 58.7Note * | 57.6Note ** | 65.6 |
| Change in FTER due to each of the main labour market indicators | |||||
| Labour force participation | 58.9 | 47.0 | 87.0 | 99.5 | Note ...: not applicable |
| Unemployment | -5.9 | -0.3 | 1.4 | 29.0 | Note ...: not applicable |
| Part-time employment | 47.0 | 53.3 | 11.5 | -28.5 | Note ...: not applicable |
| Total | 100.0 | 100.0 | 100.0 | 100.0 | Note ...: not applicable |
... not applicable
|
|||||
The next sections investigate patterns in FTER between population groups using data from 2007 and 2008 as a starting point and data from 2019 and 2021 as an end point. The year 2020 is not included in the comparison because 2020 is not representative of a typical year and thus its inclusion would produce misleading results. (see “Data sources, methods and definitions” text box for more details).The age groups that contributed the most to the difference in FTER is examined first followed by the potential role played by rising levels of women’s educational attainment and lastly by differences in marriage and motherhood status.
Older Indigenous women contribute to the rise in full-time employment
To gain a better understanding of the source of difference in FTER between population groups, it is important to examine how the age-specific patterns in full-time employment rates differ between the population groups and how they have changed over time.
Taking Canadian-born women as an example, their age-specific rates were higher in 2021 than in 2007 with the exception for women in their 20s. Their rate in 2021 follows an inverted U-shape pattern: with lower rates for those in their 20s (69%) and early 50s (67%) and higher rates for those in their 30s and 40s (71%) (Charts 2a and 2b). In contrast, in 2007, their rates were highest for those in their 20s and dropped for each successive age group.
The FTER for Indigenous women did not significantly vary by age in 2007 but tended to increase with the age in 2021, with the lowest rate for Indigenous women in their 20s (53%) and the highest among those in their early 50s (63%). For the most part, the rates of immigrant women varied little by age and between 2007 and 2021. The only exception is among immigrants in their 20s whose rate was 63% in 2021, up from 57% in 2007.

Data table for Chart 2a
| Population group and age group | Full-time employment rate | Standard error | |
|---|---|---|---|
| Upper bound | Lower bound | ||
| percentage | |||
| Canadian-born | |||
| 20-29 | 69.1 | 0.8 | 0.8 |
| 30-39 | 67.5 | 0.7 | 0.7 |
| 40-49 | 65.7 | 0.7 | 0.7 |
| 50-54 | 61.9 | 1.0 | 1.0 |
| Indigenous | |||
| 20-29 | 52.6 | 3.0 | 3.0 |
| 30-39 | 54.6 | 3.1 | 3.1 |
| 40-49 | 53.9 | 2.7 | 2.7 |
| 50-54 | 50.4 | 4.9 | 4.9 |
| Immigrants | |||
| 20-29 | 57.3 | 2.4 | 2.4 |
| 30-39 | 59.7 | 1.8 | 1.8 |
| 40-49 | 63.6 | 1.5 | 1.5 |
| 50-54 | 60.4 | 2.0 | 2.0 |
|
Note: 95% confidence intervals are included for Canadian-born and immigrant women; 90% confidence intervals are included for Indigenous women. Source: Statistics Canada, Labour Force Survey, March and September monthly files, 2007 and 2008. |
|||

Data table for Chart 2b
| Population group and age group | Full-time employment rate | Standard error | |
|---|---|---|---|
| Upper bound | Lower bound | ||
| percentage | |||
| Canadian-born | |||
| 20-29 | 68.7 | 1.1 | 1.1 |
| 30-39 | 71.2 | 0.8 | 0.8 |
| 40-49 | 71.9 | 0.8 | 0.8 |
| 50-54 | 67.1 | 1.2 | 1.2 |
| Indigenous | |||
| 20-29 | 53.2 | 3.8 | 3.8 |
| 30-39 | 60.1 | 3.2 | 3.2 |
| 40-49 | 60.2 | 3.4 | 3.4 |
| 50-54 | 62.6 | 4.7 | 4.7 |
| Immigrants | |||
| 20-29 | 63.1 | 2.8 | 2.8 |
| 30-39 | 60.9 | 1.7 | 1.7 |
| 40-49 | 63.8 | 1.6 | 1.6 |
| 50-54 | 62.9 | 2.2 | 2.2 |
|
Note: 95% confidence intervals are included for Canadian-born and immigrant women; 90% confidence intervals are included for Indigenous women. Source: Statistics Canada, Labour Force Survey, March and September monthly files, 2019 and 2021. |
|||
Overall, Canadian-born women had higher FTER in each age group and in each year than their immigrant and Indigenous counterparts. In 2021, the gap with Canadian-born women was largest for younger women, ranging from 10 percentage points with immigrant women in their 30s to 16 percentage points with Indigenous women in their 20s, and was smallest among women aged 50 to 54 years (from 4 to 5 percentage points).
The comparison of age-specific FTERs made above is between women from different birth periods. Since women’s characteristics have changed since earlier cohorts entered the workforce, at any point in time older women’s characteristics will be different from those of younger women. That is, they reflect individuals from different birth periods (cohort effects) who potentially faced different market labour conditions (period effects) at specific ages (lifecycle effects). As such, cohort differences may explain part of the differences observed by age group.
The change in the FTER for a given cohort is addressed by constructing repeated cross-sectional estimates that tracks the outcome of individuals in the same birth period over time. Since data by immigrant status and Indigenous identity is available starting in 2006, only the cohort of individuals aged 25 to 29 in 2007 to those aged 40 to 44 in 2021 is examined.
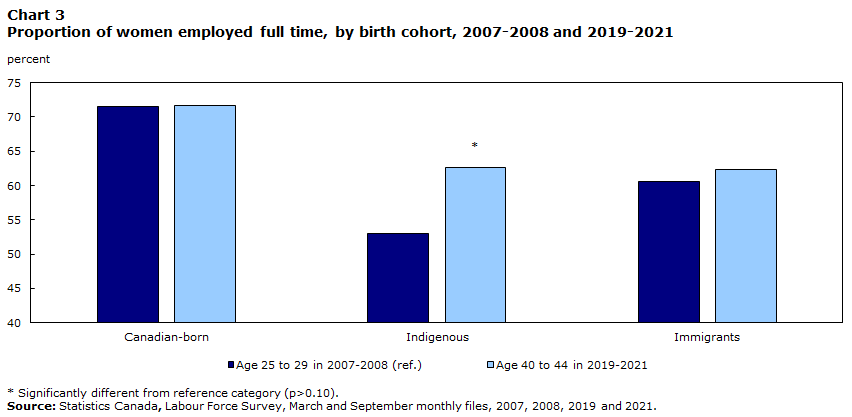
Examining the data in this way, yields a slightly different story. The rates for Canadian-born is similar as they age. That is, 72% of Canadian-born women aged 25 to 29 were working full time in 2007 and 14 years later, 72% (now aged 40 to 44 in 2021) worked full time (Chart 3). The same trend is found for immigrant women (61% in 2007; 62% in 2021). However, the rates of Indigenous women increased as they aged from 53% in 2007 to 63% in 2021–narrowing the gap with the cohort of Canadian-born women from 20 percentage points to 9 percentage points. Family structure including early parenthood or single parenthood may partly explain why the rates for a given cohort of Indigenous women increased as they aged.Note
Data table for Chart 3
| Birth cohort | Canadian-born | Indigenous | Immigrants |
|---|---|---|---|
| percentage | |||
| Age 25 to 29 in 2007-2008 (ref.) | 71.5 | 53.0 | 60.6 |
| Age 40 to 44 in 2019-2021 | 71.6 | 62.7Note * | 62.4 |
|
|||
The analysis is not straightforward for immigrant women as they enter Canada at different ages, in different years and from different source countries.
When immigrant women arrive in Canada at age 18 or younger, their FTER is similar as they age and similar to the rate for Canadian-born women. That is, 69% of immigrant women aged 25 to 29 were working full time in 2007 and 14 years later, 69% worked full time. However, using year of arrival in Canada to define a cohort, the FTER of immigrant women arriving in Canada in 2003-2004 was 48% in 2007 and 14 years later, 64% worked full time. This suggests that as age and the number of years of residency increase, so too does the FTER of immigrant women.
Immigrant women with university education were significantly less likely to be employed full time than their Canadian-born counterparts when they obtained their credentials outside Canada
Women – from all groups - have become more educated over time. Indigenous women made significant gains almost doubling their proportion with a bachelor's degree or higher from 10% in 2007 to 18% in 2021 (Table 2).Note By 2021, the proportion of Canadian-born (36%) and long-term immigrant (38%) women with a bachelor's degree or higher continued to fall short of that of recent immigrants (50%).
| Population group | High School graduate or less | College, trade school, university diploma below bachelors | University degree or above | Total |
|---|---|---|---|---|
| percentage | ||||
| 2007-2008 | ||||
| All women | 30.6 | 44.1 | 25.3 | 100 |
| Born in Canada | 30.0 | 46.7 | 23.3 | 100 |
| Indigenous | 45.0 | 45.2 | 9.8 | 100 |
| Recent immigrants | 26.1 | 29.1 | 44.8 | 100 |
| Long-term immigrants | 33.9 | 38.5 | 27.6 | 100 |
| 2019-2021 | ||||
| All women | 20.0 | 40.6 | 39.4 | 100 |
| Born in Canada | 20.1 | 44.4 | 35.6 | 100 |
| Indigenous | 34.1 | 47.6 | 18.3 | 100 |
| Recent immigrants | 20.2 | 29.4 | 50.3 | 100 |
| Long-term immigrants | 26.7 | 35.6 | 37.7 | 100 |
Higher education was associated with higher rates of full-time employment for all groups of women and in each period considered (Charts 4a and 4b). For example, in 2021, 80% of Canadian-born women with a bachelor's degree or higher worked full time compared to 53% of their counterparts with a high school diploma or less.
For the Canadian-born, the gap in full-time employment rates between those with a high school diploma or less and those with a bachelor's degree or higher widened due to a decrease in full-time work for those with a high school diploma or less and an increase in those with university qualifications. For long-term immigrants, the gap widened solely as a result of a drop in full-time work of those with lower education.
Higher levels of education may be considered an equalizer for Indigenous women since they were just as likely to hold a full-time job as their Canadian-born counterparts in 2021. The proportion of Indigenous women with a bachelor's degree or higher working full time was 79% in 2021 compared to 80% of similarly educated Canadian-born women. However, Indigenous women were less likely to secure full-time employment than their Canadian-born counterparts at the lowest levels of education: in 2021, 40% of Indigenous women with high school as their highest credential worked full time compared to 53% of Canadian-born women. This may be the result of several factors including proximity to work, limited access to job opportunities, or systemic barriers.
The fact that immigrant women are more likely to be university-educated is not new and partially reflects the shift in immigration policies with preference given to highly skilled newcomers.Note However, immigrants with a bachelor's degree or higher were significantly less likely to work full time than Canadian-born women and this gap did not narrow over the time period considered. About 80% of Canadian-born women with a bachelor's degree or higher were employed full time compared to 62% of recent immigrants and 73% of long term immigrants in 2021. Since 2007, there is no change in the gap between recent immigrants and Canadian-born women while the gap widened by 5 percentages between long-term immigrants and Canadian-born women.
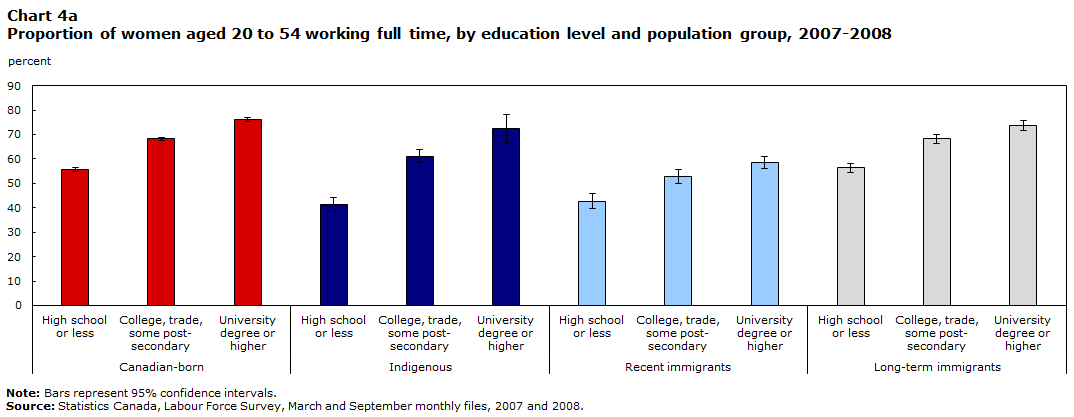
Data table for Chart 4a
| Population group and education | Full-time rate | Standard Error | |
|---|---|---|---|
| Lower bound | Upper bound | ||
| percentage | |||
| Canadian-born | |||
| High school or less | 55.8 | 0.8 | 0.8 |
| College, trade, some post-secondary | 68.2 | 0.6 | 0.6 |
| University degree or higher | 76.2 | 0.8 | 0.8 |
| Indigenous | |||
| High school or less | 41.3 | 2.9 | 2.9 |
| College, trade, some post-secondary | 61.2 | 2.6 | 2.6 |
| University degree or higher | 72.4 | 5.6 | 5.6 |
| Recent immigrants | |||
| High school or less | 42.8 | 3.1 | 3.1 |
| College, trade, some post-secondary | 52.8 | 2.7 | 2.7 |
| University degree or higher | 58.4 | 2.4 | 2.4 |
| Long-term immigrants | |||
| High school or less | 56.3 | 1.9 | 1.9 |
| College, trade, some post-secondary | 68.2 | 1.8 | 1.8 |
| University degree or higher | 73.7 | 2.0 | 2.0 |
|
Note: Bars represent 95% confidence intervals. Source: Statistics Canada, Labour Force Survey, March and September monthly files, 2007 and 2008. |
|||
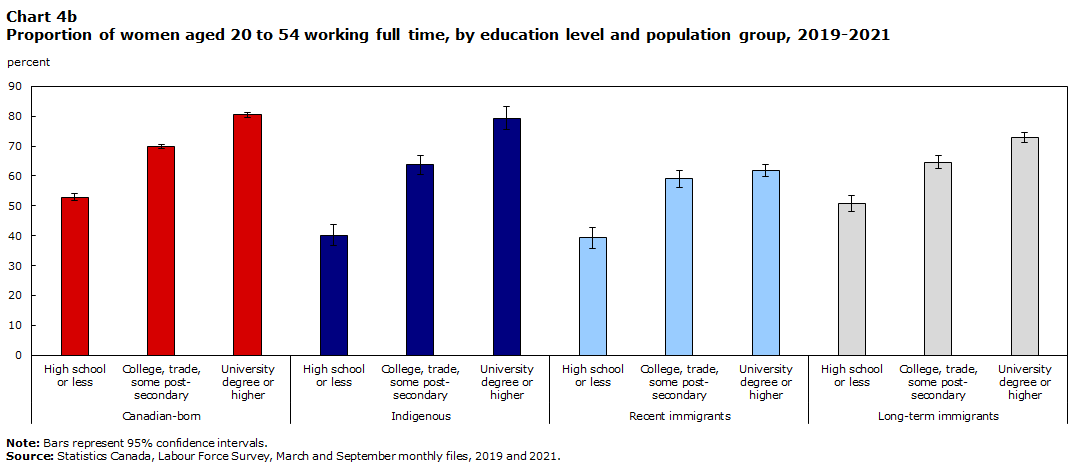
Data table for Chart 4b
| Population group and education | Full-time rate | Standard Error | |
|---|---|---|---|
| Lower bound | Upper bound | ||
| percentage | |||
| Canadian-born | |||
| High school or less | 52.8 | 1.2 | 1.2 |
| College, trade, some post-secondary | 69.8 | 0.7 | 0.7 |
| University degree or higher | 80.4 | 0.7 | 0.7 |
| Indigenous | |||
| High school or less | 40.2 | 3.5 | 3.5 |
| College, trade, some post-secondary | 63.7 | 3.2 | 3.2 |
| University degree or higher | 79.3 | 4.0 | 4.0 |
| Recent immigrants | |||
| High school or less | 39.2 | 3.6 | 3.6 |
| College, trade, some post-secondary | 59.1 | 2.9 | 2.9 |
| University degree or higher | 61.9 | 2.0 | 2.0 |
| Long-term immigrants | |||
| High school or less | 50.8 | 2.6 | 2.6 |
| College, trade, some post-secondary | 64.6 | 2.1 | 2.1 |
| University degree or higher | 72.8 | 1.6 | 1.6 |
|
Note: Bars represent 95% confidence intervals. Source: Statistics Canada, Labour Force Survey, March and September monthly files, 2019 and 2021. |
|||
A commonly cited explanation for this gap is that highly educated immigrant women may experience difficulty in having their credentials recognized, especially if these have not been acquired in Canada. Grouping the data by where immigrants obtained their degree confirms this assumption. Immigrant women educated in Canada fare better than those educated outside of Canada. In 2021, 66% of long term immigrants educated outside of Canada worked full time compared to 79% of those educated in Canada (Chart 5). The difference for recent immigrants was 16 percentage points. Also, there was no difference in FTER between long-term immigrants educated in Canada (79%) and their Canadian-born counterparts (80%). The difference between recent immigrant women educated in Canada (75%) and Canadian–born women was also considerably smaller at 5 percentage points. This suggests that credential recognition is an important explanation for lower FTER among immigrants with a bachelor's degree or higher. Other factors such as differing roles within the home and poorer quality job matches reducing the incentives to find full-time work may also be at play.Note

Data table for Chart 5
| Reference year | Educated in Canada | Educated outside Canada | ||
|---|---|---|---|---|
| Recent immigrants | Long-term immigrants | Recent immigrants | Long-term immigrants | |
| percentage | ||||
| 2007-2008 | 69.0 | 78.4 | 56.9 | 67.1 |
| 2019-2021 | 74.9 | 78.9 | 58.8 | 66.2 |
| standard error | ||||
| 2007-2008 | 6.1 | 2.4 | 2.6 | 3.3 |
| 2019-2021 | 4.2 | 2.0 | 2.3 | 2.5 |
|
Note: Bars represent the 95% confidence intervals. Source: Statistics Canada, LFS monthly files, March and September, 2007, 2008, 2019, 2021. |
||||
Being part of a couple impacts differently full-time employment of immigrants, Indigenous and Canadian-born women
Here, the extent to which FTER are influenced by marital status, age of the youngest child, population group and their intersections are examined.Note
A common finding in the literature suggests that the association of marriage or common-law with reduced employment has weakened over time and that by 2014, there was little empirical difference.Note The data shows that for Canadian-born and Indigenous women the association between being married or living in a common law relationship and full-time employment has reversed over time. In 2007, 65% of Canadian-born women in a couple worked full time compared to 69% of their counterparts not in couple – a gap of 4 percentage points in favour of those not in a couple (Charts 6a and 6b). By 2021, the results were reversed with rates of women in a couple (71%) now surpassing those of women not in a couple (68%) – a gap of 3 percentage points in favour of women in a couple relationship. For Indigenous women, there was no difference in rates by marital status in 2007. By 2021, Indigenous women who are part of couple (64%), like their Canadian born counterparts, were more likely to be employed full time than those not part of a couple (52%). Changing societal norms facing married women in the workplace, declining fertility rates and men’s increasing involvement in family responsibilities are just some of the factors that may explain the reversal in trends.
However, the opposite is found for immigrant women. Regardless of arrival date and year considered, being in a couple is associated with lower FTER. About 64% of long-term immigrants in a couple worked full time in 2021 compared to 70% of those not in a couple. The gap has little changed since 2007. Source-country gender roles and educational profiles of both immigrant women in couples and not in couples may play a role in explaining this gap.Note

Data table for Chart 6a
| Population group and marital status | Full-time rate | Standard Error | |
|---|---|---|---|
| Lower bound | Upper bound | ||
| percentage | |||
| Canadian-born | |||
| Not married or common-law | 69.1 | 0.8 | 0.8 |
| Married or common-law | 65.0 | 0.5 | 0.5 |
| Indigenous | |||
| Not married or common-law | 53.5 | 2.9 | 2.9 |
| Married or common-law | 53.2 | 2.5 | 2.5 |
| Recent immigrants | |||
| Not married or common-law | 63.7 | 3.4 | 3.4 |
| Married or common-law | 49.9 | 1.8 | 1.8 |
| Long-term immigrants | |||
| Not married or common-law | 69.8 | 2.1 | 2.1 |
| Married or common-law | 64.1 | 1.4 | 1.4 |
|
Note: Bars indicate 95% confidence intervals. Source: Statistics Canada, Labour Force Survey, March and September monthly files, 2007 and 2008. |
|||

Data table for Chart 6b
| Population group and marital status | Full-time rate | Standard Error | |
|---|---|---|---|
| Lower bound | Upper bound | ||
| percentage | |||
| Canadian-born | |||
| Not married or common-law | 68.1 | 0.9 | 0.9 |
| Married or common-law | 71.3 | 0.6 | 0.6 |
| Indigenous | |||
| Not married or common-law | 52.4 | 3.2 | 3.2 |
| Married or common-law | 63.9 | 2.8 | 2.8 |
| Recent immigrants | |||
| Not married or common-law | 69.9 | 3.2 | 3.2 |
| Married or common-law | 54.2 | 1.8 | 1.8 |
| Long-term immigrants | |||
| Not married or common-law | 70.3 | 2.4 | 2.4 |
| Married or common-law | 63.8 | 1.4 | 1.4 |
|
Note: Bars indicate 95% confidence intervals. Source: Statistics Canada, Labour Force Survey, March and September monthly files, 2019 and 2021. |
|||
Full-time employment of Canadian-born mothers with young children increased but not so for immigrants, and Indigenous women
The presence of children in the household is associated with lower FTER for women – in each population group in each year considered.Note Among mothers of children aged 1 to 5, in 2021, Indigenous mothers had the lowest FTER (43%) followed by recent immigrants (46%) (Charts 7a and 7b).
Overall, the presence of children had a stronger impact on full-time employment when the youngest child was aged 1 to 5Note compared to when the youngest child was aged 6-12. However, there are marked differences between population groups.

Data table for Chart 7a
| Age of youngest child and population group | Full-time employment rate | Standard error | |
|---|---|---|---|
| Upper bound | Lower bound | ||
| percentage | |||
| Canadian-born | |||
| Aged 1-5 | 55.5 | 1.1 | 1.1 |
| Aged 6-12 | 62.6 | 1.0 | 1.0 |
| No children under 18 | 70.5 | 0.5 | 0.5 |
| Indigenous | |||
| Aged 1-5 | 38.0 | 4.4 | 4.4 |
| Aged 6-12 | 54.3 | 4.5 | 4.5 |
| No children under 18 | 58.3 | 2.6 | 2.6 |
| Recent immigrants | |||
| Aged 1-5 | 41.4 | 3.1 | 3.1 |
| Aged 6-12 | 51.6 | 3.9 | 3.9 |
| No children under 18 | 60.8 | 2.2 | 2.2 |
| Long-term immigrants | |||
| Aged 1-5 | 58.0 | 3.4 | 3.4 |
| Aged 6-12 | 63.4 | 2.5 | 2.5 |
| No children under 18 | 68.5 | 1.5 | 1.5 |
|
Note: Bars indicate 95% confidence intervals. Source: Statistics Canada, Labour Force Survey, March and September monthly files, 2007 and 2008. |
|||
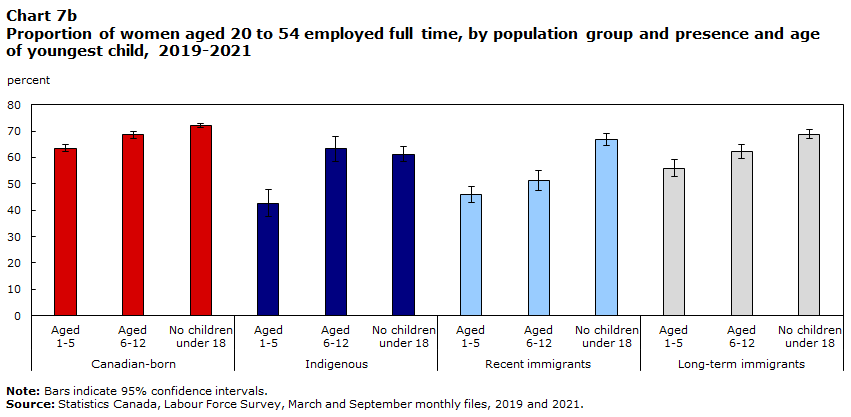
Data table for Chart 7b
| Age of youngest child and population group | Full-time employment rate | Standard error | |
|---|---|---|---|
| Upper bound | Lower bound | ||
| percentage | |||
| Canadian-born | |||
| Aged 1-5 | 63.5 | 1.3 | 1.3 |
| Aged 6-12 | 68.6 | 1.2 | 1.2 |
| No children under 18 | 72.0 | 0.7 | 0.7 |
| Indigenous | |||
| Aged 1-5 | 42.6 | 5.2 | 5.2 |
| Aged 6-12 | 63.3 | 4.8 | 4.8 |
| No children under 18 | 61.3 | 3.0 | 3.0 |
| Recent immigrants | |||
| Aged 1-5 | 45.9 | 3.0 | 3.0 |
| Aged 6-12 | 51.3 | 3.7 | 3.7 |
| No children under 18 | 66.8 | 2.3 | 2.3 |
| Long-term immigrants | |||
| Aged 1-5 | 55.9 | 3.2 | 3.2 |
| Aged 6-12 | 62.3 | 2.6 | 2.6 |
| No children under 18 | 68.9 | 1.6 | 1.6 |
|
Note: Bars indicate 95% confidence intervals. Source: Statistics Canada, Labour Force Survey, March and September monthly files, 2007 and 2008. |
|||
Starting with Canadian-born, the gap between mothers whose youngest child was aged 1 to 5 compared to women without children narrowed from 15 percentage points in 2007 to 9 percentage points in 2021. This change is mainly due to the change in the rate of mothers with young children (from 56% in 2007 to 64% in 2021) as the rate of women with no children or older children has remained fairly stable (from 71% in 2007 to 72% in 2021). In contrast, the employment rates of Indigenous and immigrant mothers with young children did not change over the time period under study.
Most striking here is the gap among mothers of children aged 1 to 5. The gap widened between long-term immigrants and Canadian-born mothers from 3 percentage points in favour of long term immigrants in 2007 to 8 percentage points in favour of Canadian-born women in 2021. For the other population groups, there was no change in the gap over time.
Marriage and motherhood associated with lower full-time employment for immigrant women, not for Canadian-born and Indigenous women
Looking at marriage and motherhood independently may masks the interplay between the two conditions. For instance, the impact of motherhood on full-time employment may be more related to being in a couple and vice versa. Combining marriage and motherhood produce a more nuanced result.
Jointly both marriage and motherhood are associated with lower full-time employment for immigrant women. In 2021, nearly 72% of recent immigrant women worked full time when they were not part of a couple and did not have children (Chart 8). This drops to 64% when they were part of a couple without children and even further to 45% when they were part of a couple youngest child aged 1 to 5. A similar observation is made for long-term immigrant women.
A number of factors that cannot be explored with the LFS data may contribute to the lower FTER among immigrant mothers. These factors include, among others, a greater preference for staying home with children, lower use of childcare services due to their high cost, and immigrant women’s lower opportunity costs of not working as a result of their relatively lower pay and over-qualifications for a given job.Note

Data table for Chart 8
| Population group and marital status | Full-time employment rate | Standard Error | |
|---|---|---|---|
| Upper bound | Lower bound | ||
| percentage | |||
| Canadian born | |||
| Not in a couple / no children | 68.3 | 1.1 | 1.1 |
| Couple with no children | 76.9 | 1.0 | 1.0 |
| Couple with children aged 1-5 | 64.2 | 1.3 | 1.3 |
| Lone mother with children under 12 | 64.0 | 1.2 | 1.2 |
| Indigenous | |||
| Not in a couple / no children | 54.1 | 4.0 | 4.0 |
| Couple with no children | 69.8 | 4.7 | 4.7 |
| Couple with children aged 1-5 | 46.4 | 6.2 | 6.2 |
| Lone mother with children under 12 | 49.1 | 3.7 | 3.7 |
| Recent immigrants | |||
| Not in a couple / no children | 71.5 | 3.7 | 3.7 |
| Couple with no children | 63.6 | 3.1 | 3.1 |
| Couple with children aged 1-5 | 45.3 | 3.1 | 3.1 |
| Lone mother with children under 12 | 57.7 | 4.4 | 4.4 |
| Long-term immigrants | |||
| Not in a couple / no children | 72.5 | 2.8 | 2.8 |
| Couple with no children | 64.8 | 2.6 | 2.6 |
| Couple with children aged 1-5 | 56.2 | 3.3 | 3.3 |
| Lone mother with children under 12 | 60.2 | 3.3 | 3.3 |
|
Note: Error bars represent the 95% confidence interval. Source: Statistics Canada, Labour Force survey, March and September, 2019 and 2021. |
|||
A different story is told for Canadian-born women and Indigenous women. Comparing women without children, being part of a couple is associated with higher full-time rates than those not in a couple. In 2021, about 77% of Canadian-born women in a couple and without children worked full time compared to 68% of their counterparts not in a couple. In contrast, those in a couple with children aged 1 to 5 had the lowest full-time employment rate (64%), indicating that the presence of children is a determinant factor for full-time employment. Similar results were found for Indigenous women.
Balancing the demands of work and family is especially difficult for mothers without a partner. With the exception of recent immigrants, there is little difference in the FTER of lone mothers with children under the age of 12 and all mothers with young children. Between population groups, Indigenous lone mothers have the lowest FTER (49%) compared to Canadian-born lone mothers (64%) who have the highest.
These last results question traditional estimates of the ‘motherhood employment penalty’ since motherhood alone cannot explain differences in full-time employment among women. Rather, different stages of a women’s life, such as marriage, can signify shifts in full-time employment status, though the direction of these shifts differ by socio-demographic characteristics. Further exploration into this topic using longitudinal data would be interesting.
Gender gap in full-time employment continued to narrow
A comparison with the relative status of men provides additional insight on trends in full-time employment.
Overall, rising FTER for women and declining rates for men caused the gender gap to narrow. This is certainly the case for the Canadian-born. The rate for women increased (+4 percentage points) while the rate for men declined (-2 percentage points) causing the gender gap to narrow by 6 percentage points between 2007 and 2021. The narrowing of the gender gap for Indigenous people (9 percentage points) was due to a rising FTER for women (+5 percentage points) and a declining rate for men (-4 percentage points).
However, different trends are observed for immigrant women. The gap narrowed slightly for recent immigrants (2 percentage points) because the rising FTER for women (+ 5 percentage points) was partially offset by the rising rate of men (+3 percentage points). For long-term immigrants, the narrowing of their gender gap (1 percentage point) resulted from a decline in the FTER of men (-1 percentage points).
Conclusion
Given wider issues of inequality, it is necessary to examine whether employment outcomes vary for groups of women with different population characteristics as well as the extent to which they re-affirm or diverge from general patterns. This paper asks the question: Has the profile of women’s full-time employment in Canada changed? The simple answer is no. The data presented here does not support the idea that the overall gap in rates between Canadian-born women and immigrant and Indigenous women has narrowed since 2007.
This article demonstrates how the full-time employment rates of immigrant and Indigenous women differ from their Canadian-born counterparts. The main take-away message is that along many dimensions, aggregate measures do not offer a complete picture. The gap with Canadian-born women remained largest for younger women and smallest among older women in any given survey year. Examining the change in full-time employment rates for a given cohort, recent cohorts of Indigenous women narrowed the gap in full-time employment with Canadian-born women. When immigrant women arrive in Canada at age 18 or younger, their full-time employment rate is similar as they age and similar to the rate for Canadian-born women.
Full-time employment rates are higher for women with higher levels of education. Indigenous women with a bachelor's degree or higher and immigrant women educated in Canada were just as likely to hold a full-time job as their Canadian-born counterparts in 2021. When immigrant women obtain their credentials outside Canada, they were significantly less likely to be employed full time than their Canadian-born counterparts and this gap did not narrow over time.
Marriage and motherhood lowered full-time employment for immigrant women, not so for Canadian-born and Indigenous women. More immigrant women worked full time when they were not part of a couple and did not have children than when they were part of a couple without children and even fewer worked full time when they were part of a couple where the youngest child were aged 1 to 5. For mothers without a partner, balancing the demands of work and family is especially difficult. Between population groups, Indigenous lone mothers have the lowest full-time employment rates (49%) compared to Canadian born lone mothers (64%) who have the highest.
The results presented here focus on the supply side of the labour market. As such, they should be interpreted carefully since access to employment may be influenced by differential treatment in the labour market.Note Labour market conditions may also have played a role since much of the increase in the rate for Indigenous and recent immigrants took place during a period of sustained economic growth prior to the downturn associated with the COVID-19 pandemic. Understanding how and why there are differences in the selection into and persistence in full-time employment between women from different population groups remains an important area for continued research and is useful for policy makers seeking to address differences in the labour market.
Marie Drolet is a senior researcher at the Diversity and Sociocultural Statistics Division at Statistics Canada.
Start of text box
Data sources, methods and definitions
Data Sources
This article uses March and September data from Labour Force Survey (LFS) from 2007 to 2021. The LFS is a monthly household survey collecting information about the labour market activities of the population aged 15 years excluding residents of collective dwellings, persons living on reserves and other settlements in the province, and full-time members of the Canadian forces.
The analytical sample includes women aged 20 to 54 living in the ten provinces excluding full-time students and unpaid family members. Full-time students are excluded since their main activity is going to school. Unpaid family members are excluded since some survey questions are asked differently or not at all comparable to those asked to paid workers.Methods
To ensure sufficient sample sizes for the disaggregated populations of interest, March and September monthly files are pooled for each reference year. These months are independent of one another since the LFS follows a rotating panel sample design in which households remain in sample for six consecutive months. For analysis of changes over time, combined March and September data from survey year 2007 and 2008 are compared to combined data from survey year 2019 and 2021. The survey year 2020 is not included in the comparison since 2020 is not representative of a typical year and including it would produce spurious results. Sample weights are adjusted accordingly. Bootstrap methods were used for variance estimation.
Definitions
Full-time (FT) refers to the population employed at least 30 hours per week in their main job including both paid workers and self-employed workers. The full-time employment rate (FTER) is the percent of individuals employed FT among the total population.
The article focuses on the following population groups:
Data for the Indigenous population have been available in the LFS since 2007. Respondents are asked to self-identify as being an Indigenous person, that is, First Nations (North American Indian), Métis, or Inuk (Inuit). A person may also identify with more than one group. Separate analyses are not possible due to small sample sizes.
The LFS target population excludes persons living on reserves and other settlements in the province. All information in this article reflects the situation of people living off-reserve in Canada’s ten provinces. According to the 2016 Census, about 80% of the Indigenous population lived off-reserve in the provinces in 2016.
Although the LFS produces data on the territories, a different methodology is used than in the provinces. As a result, estimates for the territories are not included this analysis. According to the 2016 Census, the Inuit population is relatively small (about 65,000) and mostly reside in Nunavut and the Northwest Territories. As such, a large portion of them are not covered in this analysis.
- The Canadian-born population refers to non-Indigenous persons born in Canada.
- In January 2006, questions were added to the LFS to identify Canada’s immigrant population. Canada’s immigrant population comprises those individuals not born in Canada and who are granted the right to live in Canada permanently. Persons not born in Canada and that do not reside permanently in Canada are excluded from the analysis.
End of text box
Start of text boxTable 3
Selected socio-economic charactersitics of women, by population group, 2007-2008 and 2019-2021
| Canadian-born | Indigenous | Recent immigrants | Long-term immigrants | |||||
|---|---|---|---|---|---|---|---|---|
| 2007 | 2021 | 2007 | 2021 | 2007 | 2021 | 2007 | 2021 | |
| percentage | ||||||||
| Total population | 75.5 | 67.4 | 2.6 | 3.1 | 8.2 | 11.3 | 13.7 | 18.3 |
| Age group | ||||||||
| 20 to 24 | 9.8 | 9.5 | 13.6 | 12.4 | 7.5 | 6.3 | 3.9 | 3.4 |
| 25 to 34 | 26.9 | 31.0 | 28.5 | 31.5 | 37.3 | 38.1 | 17.0 | 18,1 |
| 35 to 44 | 29.4 | 30.1 | 30.9 | 27.4 | 36.5 | 37.5 | 34.6 | 32.2 |
| 45 to 54 | 33.9 | 29.4 | 27.0 | 28.7 | 18.7 | 18.0 | 44.5 | 46.3 |
| Level of education | ||||||||
| High school or less | 30.0 | 20.1 | 45.0 | 34.1 | 26.1 | 20.2 | 33.9 | 26.7 |
| Post secondary: college, trade, apprenticeship | 46.7 | 44.4 | 45.2 | 47.6 | 29.1 | 29.4 | 38.5 | 35.6 |
| University degree or higher | 23.3 | 35.6 | 9.8 | 18.3 | 44.8 | 50.3 | 27.6 | 37.7 |
| Province and city size | ||||||||
| Atlantic region | 8.9 | 8.2 | 6.9 | 8.4 | 0.9 | 1.5 | 1.1 | 0.9 |
| Quebec (excl. Montreal) | 14.5 | 13.5 | 4.4 | 3.4 | 2.2 | 2.8 | 1.4 | 1.5 |
| Ontario (excl. Toronto, Ottawa, Hamilton) | 19.4 | 19.1 | 19.0 | 17.2 | 6.8 | 5.7 | 10.3 | 9.0 |
| Manitoba (excl. Winnipeg) | 1.2 | 1.1 | 5.3 | 5.9 | 0.5 | 0.9 | 0.3 | 0.4 |
| Saskatchewan | 3.2 | 3.0 | 9.7 | 11.1 | 0.9 | 2.7 | 0.6 | 0.7 |
| Alberta (excl. Calgary, Edmonton) | 4.3 | 4.1 | 8.0 | 7.5 | 1.3 | 2.4 | 1.5 | 1.4 |
| British Columbia (excl. Vancouver) | 6.5 | 6.8 | 13.1 | 14.4 | 2.7 | 2.7 | 3.8 | 3.0 |
| Toronto | 10.6 | 11.8 | Note ...: not applicable | Note ...: not applicable | 13.1 | 15.0 | 11.3 | 11.1 |
| Montreal | 12.0 | 11.2 | Note ...: not applicable | Note ...: not applicable | 42.6 | 32.5 | 41.3 | 41.6 |
| Vancouver | 5.2 | 5.5 | 5.7 | Note ...: not applicable | 13.4 | 13.7 | 13.4 | 14.7 |
| Mid-sized CMA (Ottawa, Hamilton, Winnipeg, Calgary, Edmonton) | 14.2 | 15.7 | 23.3 | 21.1 | 15.7 | 20.1 | 15.1 | 15.7 |
| Couple- children status | ||||||||
| Not in a couple, no children | 23.2 | 27.1 | 25.3 | 28.4 | 15.0 | 16.8 | 18.9 | 20.4 |
| In a couple, no children | 24.1 | 22.5 | 21.7 | 19.9 | 23.3 | 23.9 | 18.3 | 17.2 |
| Couple, children aged 1 to 5 | 11.6 | 12.6 | 10.4 | 11.1 | 22.9 | 23.5 | 10.6 | 11.0 |
| Couple, children aged 6 to 12 | 11.7 | 12.2 | 9.0 | 9.6 | 13.3 | 13.2 | 16.1 | 16.0 |
| Lone mother, youngest child less than 13 | 4.5 | 4.4 | 11.4 | 9.8 | 3.0 | 2.7 | 4.8 | 4.6 |
| Couple, youngest child 13 years or over | 24.9 | 21.2 | 22.1 | 21.3 | 22.5 | 19.9 | 31.3 | 30.7 |
| Economic Family Size | ||||||||
| 1 person | 13.7 | 13.3 | 15.9 | 14.0 | 7.1 | 9.3 | 7.7 | 8.5 |
| 2 persons | 28.5 | 26.2 | 28.1 | 26.4 | 19.2 | 19.0 | 18.0 | 16.6 |
| 3-4 persons | 46.2 | 47.4 | 41.8 | 43.9 | 52.8 | 49.5 | 50.4 | 51.5 |
| 5 or more persons | 11.5 | 13.1 | 14.2 | 15.8 | 20.9 | 22.2 | 24.0 | 23.5 |
|
... not applicable Source: Statistics Canada, Labour Force Survey, monthly files, 2007, 2008, 2019 and 2021. |
||||||||
- Date modified: