
Insights on Canadian Society
Results from the 2016 Census: Education and labour market successes and challenges for children of immigrant parents

Archived Content
Information identified as archived is provided for reference, research or recordkeeping purposes. It is not subject to the Government of Canada Web Standards and has not been altered or updated since it was archived. Please "contact us" to request a format other than those available.
by Martin Turcotte

Skip to text
Start of text box

This issue of Insights on Canadian Society presents a study based on integrated data from the 2006 and 2016 censuses. This article provides a summary of a comprehensive report on the outcomes of children of immigrant parents entitled “Educational and labour market outcomes of children with an immigrant background by region of origin,” published as part of the Ethnicity, Language and Immigration Thematic Series.
End of text box
Start of text box
Overview
Based on integrated data from the 2006 and 2016 censuses, this study examines the educational outcomes of a cohort of children with an immigrant background who were aged 13 to 17 in 2006, and the employment earnings of young adults who had immigrant parents. In this study, the outcomes of children of immigrant parents from different regions are compared with those of children of Canadian-born parents.
- Children of immigrant parents were more likely to complete postsecondary studies than their counterparts from the third generation or more. For example, 43% of children of immigrant parents aged 13 to 17 in 2006 had a university degree in 2016, compared with 29% of their counterparts from the third generation or more.
- Children of immigrant parents from Asia were particularly likely to have a high level of education. For example, in 2016, children of immigrant parents from East Asia were two-and-a-half times more likely to have a university degree than their counterparts from the third generation or more.
- Children whose parents have a lower level of education also tend to have a lower level of education. In the case of children with immigrant parents, however, parents’ level of education had less of an impact on the education level of children than in the case of children with Canadian-born parents.
- Among university graduates aged 30 to 34 in 2016 who worked full year and full time, men with immigrant parents generally earned less than their counterparts from the third generation or more, after accounting for other factors.
- Among female university graduates aged 30 to 34 in 2016 who worked full year and full time, the gaps in employment earnings between children with an immigrant background and their counterparts from the third generation or more were mostly non-significant, once other factors were taken into account.
End of text box
Introduction
In Canada, one of the objectives of immigration policies is to promote Canada’s economic growth and prosperity. In light of this objective, education plays an important role in the selection process for prospective immigrants, meaning that many immigrants have postsecondary qualifications. For example, among immigrants aged 25 to 34 who landed between 2011 and 2016, 57% had a university certificate, diploma or degree at the bachelor’s level or higher. In comparison, 30% of non-immigrants from the same age group had a university degree.Note
The impact of immigration on Canada’s social and economic development can also be felt in the longer term, particularly because the majority immigrants will have Canadian-born children. These children are called “children of immigrant parents” or children “with an immigrant background.” Because of their family history, children of immigrant parents differ from other children in various ways.Note More specifically, they contribute to the increase in the overall level of education in Canada since they are generally more likely than their non-immigrant counterparts to undertake and complete postsecondary studies.Note
This study explores the education and labour market outcomes of children with an immigrant background, based on their region of origin (i.e., based on the place of birth of their immigrant parents) (see Data sources, methods and definitions). Gathering more information on the regions of origin of children with an immigrant background who are at a higher risk of having academic difficulties allows for targeted support programs to be designed to help guide these children throughout their education. It is also important to identify regions of origin associated with less favourable labour market outcomes when developing policies and programs to support employability and fight employment discrimination.
More specifically, this study seeks to answer the following two questions: (1) How do the education outcomes of children of immigrant parents differ from those of children of Canadian-born parents? (2) Do children with an immigrant background with different regions of origin have labour market outcomes comparable to those of children with Canadian-born parents?
To answer the first question, integrated data from the 2006 and 2016 censuses were used to examine the 2016 education outcomes for a cohort of youth aged 13 to 17 in 2006 (aged 23 to 27 in 2016). To answer the second question, the earnings of young adults with an immigrant background aged 30 to 34 who worked full year and full time were examined using data from the 2016 Census.Note
Children of immigrant parents are more likely to complete postsecondary studies than children of Canadian-born parents
Obtaining a postsecondary certificate, diploma or degree—including trades and apprenticeship programs, college-level programs (including CÉGEP in Quebec), and university programs—is generally associated with better labour market outcomes.Note In general, children of immigrant parents were more likely to have postsecondary qualifications than their counterparts from the third generation or more. Among youth aged 13 to 17 in 2006, 72% of those with an immigrant background had a postsecondary certificate, diploma or degree in 2016, compared with 67% of youth from the third generation or more. Immigrant parents also had higher levels of education than Canadian-born parents, which may have affected their children’s education outcomes.
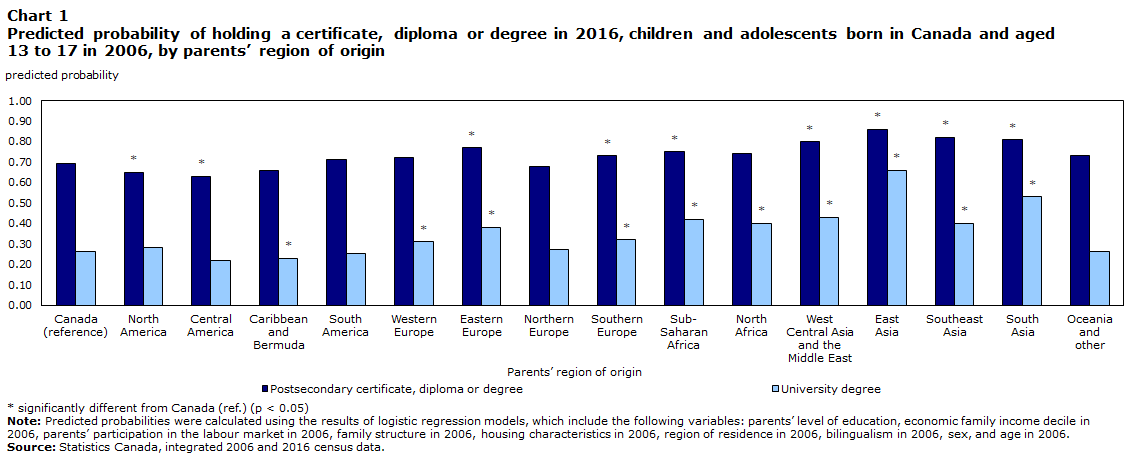
Outcomes varied significantly between regions of origin, even after taking into account other factors that could affect education (see Data sources, methods and definitions). Children of immigrant parents from Asian regions (East Asia, Southeast Asia, South Asia, West Central Asia and the Middle East) were particularly more likely to obtain a postsecondary certificate, diploma or degree than children from the third generation or more (Chart 1). Children of immigrant parents from Eastern Europe, Southern Europe and sub-Saharan Africa were also more likely to have a postsecondary certificate, diploma or degree than children from the third generation or more.
Data table for Chart 1
| Parents’ region of origin | Postsecondary certificate, diploma or degree | University degree |
|---|---|---|
| predicted probability | ||
| Canada (reference) | 0.69 | 0.26 |
| North America | 0.65Note * | 0.28 |
| Central America | 0.63Note * | 0.22 |
| Caribbean and Bermuda | 0.66 | 0.23Note * |
| South America | 0.71 | 0.25 |
| Western Europe | 0.72 | 0.31Note * |
| Eastern Europe | 0.77Note * | 0.38Note * |
| Northern Europe | 0.68 | 0.27 |
| Southern Europe | 0.73Note * | 0.32Note * |
| Sub-Saharan Africa | 0.75Note * | 0.42Note * |
| North Africa | 0.74 | 0.40Note * |
| West Central Asia and the Middle East | 0.80Note * | 0.43Note * |
| East Asia | 0.86Note * | 0.66Note * |
| Southeast Asia | 0.82Note * | 0.40Note * |
| South Asia | 0.81Note * | 0.53Note * |
| Oceania and other | 0.73 | 0.26 |
Source: Statistics Canada, integrated 2006 and 2016 census data. |
||
However, children of immigrant parents from North America and Central America were less likely to have a postsecondary certificate, diploma or degree than children from the third generation or more. This demonstrates that there are variations in outcomes across regions of origin.
Differences were even more notable for obtaining a university degree (bachelor’s degree or higher). Among youth from an immigrant background aged 13 to 17 in 2006, 43% had a university degree 10 years later, compared with 29% of children of Canadian-born parents in the same age group.
Although children with an immigrant background generally have a higher likelihood of completing a university degree, this is particularly true for children of East Asian origin (including children from China and Hong Kong). For this group of youth aged 13 to 17 in 2006, the likelihood of having completed a university degree was 66% ten years later (in 2016), which is two-and-a-half times higher than the likelihood among children from the third generation or more, even after accounting for other factors. In fact, youth from all regions of Europe, Africa and Asia had higher proportions of university graduates than the average for Canadian youth from the third generation or more.
Youth with an immigrant background from the Caribbean and Bermuda who were aged 13 to 17 in 2006 had a 23% probability of having a university degree in 2016, making them the only group with a significantly lower probability than Canadian youth from the third generation or more in the same age group.
Children of immigrant parents with lower education levels achieve relatively high educational outcomes
In most member countries of the Organisation for Economic Co-operation and Development, intergenerational transmission of postsecondary education is less direct among children of immigrant parents than other children.Note Furthermore, immigrants with lower education levels are more eager than their counterparts from the third generation or more for their children to stay in school as long as possible.Note To what extent are the education outcomes of children of immigrant parents affected by the education levels of their parents?
Among children whose parents had a high school diploma or less, children with an immigrant background were significantly more likely to have a university degree than children of Canadian-born parents. This was true for most regions of origin.
Specifically, among Canadian youth from the third generation or more whose parents had a high school diploma or less, the predicted probability (adjusted for other factors) of having a university degree was 11%. Comparatively, the corresponding probability was three to nearly six times higher among their counterparts with an immigrant background from sub-Saharan Africa, South Asia, North Africa and East Asia (Table 1).
| Parents’ region of origin | Parents’ level of education | |||
|---|---|---|---|---|
| High school diploma or less | Postsecondary diploma below bachelor level | Bachelor’s degree | University certificate, diploma or degree above bachelor level | |
| predicted probability | ||||
| Canada | 0.11 | 0.17Note * | 0.34Note * | 0.40Note * |
| North America | 0.20 | 0.22 | 0.52Note * | 0.58Note * |
| Central America | 0.09 | 0.23 | 0.46Note * | 0.52Note * |
| Caribbean and Bermuda | 0.15 | 0.17 | 0.31Note * | 0.31Note * |
| South America | 0.09 | 0.14 | 0.26Note * | 0.38Note * |
| Western Europe | 0.14 | 0.17 | 0.26Note * | 0.34Note * |
| Eastern Europe | 0.19 | 0.22 | 0.41Note * | 0.44Note * |
| Northern Europe | 0.16 | 0.16 | 0.37Note * | 0.39Note * |
| Southern Europe | 0.16 | 0.24Note * | 0.47Note * | 0.50Note * |
| Sub-Saharan Africa | 0.35 | 0.39 | 0.46 | 0.59Note * |
| North Africa | 0.44 | 0.37 | 0.77Note * | 0.71Note * |
| West Central Asia and the Middle East | 0.12 | 0.19Note * | 0.38Note * | 0.40Note * |
| East Asia | 0.62 | 0.68 | 0.76Note * | 0.82Note * |
| Southeast Asia | 0.25 | 0.24 | 0.33Note * | 0.42Note * |
| South Asia | 0.41 | 0.57Note * | 0.69Note * | 0.71Note * |
| Oceania and other | 0.52 | 0.42 | 0.73 | 0.79 |
Source: Statistics Canada, integrated 2006 and 2016 census data. |
||||
For youth with an immigrant background from East Asia whose parents had a high school diploma or less, their probability of having a university degree (62%) was even higher than that of Canadian youth from the third generation or more whose parents had a university degree above the bachelor level (40%). This suggests that the education level of parents is not as influential for children of immigrants as it is for children of Canadian-born parents.
Thus far, the results have indicated that children with an immigrant background are generally more likely to obtain a postsecondary or university degree than children with Canadian-born parents. One of the most common hypotheses to explain this gap involves the role and influence of parents of children with an immigrant background, who envisage a better life for themselves, but also for their children.Note As a result, immigrant parents would have higher expectations and aspirations for their children than Canadian-born parents and would do everything in their power to instill those ambitions in their children.Note The following section examines the labour market outcomes of children with an immigrant background, again by region of origin.
There are gaps in employment earnings between children with an immigrant background and children from the third generation or more
Two factors are often associated with recent immigrants having more difficulty integrating into the labour market than non-immigrants: (1) postsecondary degrees received abroad, which may not always be as well recognized by employers in Canada as Canadian degrees, and (2) insufficient knowledge and proficiency in an official language (i.e., English or French). However, these two factors should not disadvantage the children with an immigration background considered in this study since they all went through the Canadian school system, and nearly all of them earned a high school diploma or postsecondary degree from a Canadian institution.
Charts 2 and 3 present the employment earnings gaps between young adults aged 30 to 34 with an immigrant background and their counterparts from the third generation or more, among those who had a university degree and worked full year and full time. Results are presented separately for men and women, by region of origin.
According to the unadjusted results, young men with an immigrant background earned more than those from the third generation or more, except for those from the Americas and Western Europe. The gap was larger for young men whose parents were from East Asia: they earned $5,700 more than their counterparts from the third generation or more (Chart 2).

Data table for Chart 2
| Parents’ region of origin | Observed gap | Adjusted gap |
|---|---|---|
| dollars | ||
| North America | 1,940 | -1,390 |
| Central America | -5,060 | -7,270Note * |
| Caribbean and Bermuda | -2,650 | -6,950Note * |
| South America | -400 | -6,970Note * |
| Western Europe | -860 | -2,220Note * |
| Eastern Europe | 3,680 | -2,400Note * |
| Northern Europe | 2,090 | -400 |
| Southern Europe | 970 | 790 |
| Sub-Saharan Africa | 4,490 | -3,330Note * |
| North Africa | 1,140 | -360 |
| West Central Asia and the Middle East | 2,930 | -1,110 |
| East Asia | 5,730 | -3,450Note * |
| Southeast Asia | 5,340 | -6,160Note * |
| South Asia | 3,720 | -3,030Note * |
| Oceania and other | 3,950 | -4,850 |
Source: Statistics Canada, Census of Population, 2016. |
||
However, these results do not take into account differences in field of study or other characteristics. For example, youth with an immigrant background are more likely to pursue studies in scientific fields (science, technology, engineering, math and computer science, also called "STEM" fields) at university. These fields of study tend to lead to higher-paying jobsNote and, consequently, higher employment earnings for people with an immigrant background.
Once fields of study and other sociodemographic characteristics were taken into account, the annual employment earnings of young men with an immigrant background were lower than those of their non-immigrant counterparts for 9 of the 15 regions of origin. The most significant gaps were seen among university graduates with an immigrant background whose region of origin was Central America (-$7,300), South America (-$7,000), the Caribbean and Bermuda (-$7,000) and Southeast Asia (-$6,200). For other regions of origin such as Northern Europe, Southern Europe and North Africa, the employment earnings of young men with an immigration background were closer to those of young Canadian men from the third generation or more. Several hypotheses could explain these gaps by region of origin, including lack of social networks, lack of contacts in established businesses and employment discrimination.
In contrast, unadjusted data indicate a generally small gap between young women from an immigrant background and their counterparts from the third generation or more. However, an exception was observed between young women from the third generation and more and women from Central America, the Caribbean and Bermuda, and South America. Women in these groups earned $3,700 to $8,500 less than their counterparts from the third generation or more (Chart 3).

Data table for Chart 3
| Parents’ region of origin | Observed gap | Adjusted gap |
|---|---|---|
| dollars | ||
| North America | -860 | 1,130 |
| Central America | -7,410 | -2,880 |
| Caribbean and Bermuda | -8,510 | -2,810Note * |
| South America | -3,700 | -1,560 |
| Western Europe | 730 | -1,250 |
| Eastern Europe | 2,910 | -150 |
| Northern Europe | 1,340 | -870 |
| Southern Europe | 2,350 | 1,830Note * |
| Sub-Saharan Africa | 190 | 340 |
| North Africa | 3,650 | 2,390 |
| West Central Asia and the Middle East | 2,560 | 680 |
| East Asia | 1,580 | 2,260Note * |
| Southeast Asia | -950 | -190 |
| South Asia | 3,840 | -1,170 |
| Oceania and other | 250 | -1,410 |
Source: Statistics Canada, Census of Population, 2016. |
||
Once other factors were taken into consideration, the gaps in employment earnings were even smaller among young women. For most regions of origin, young women from an immigrant background earned about the same as their counterparts with Canadian-born parents, except for young female university graduates with an immigrant background from East Asia (+$2,300) and Southern Europe (+$1,800), who earned more than their counterparts from the third generation or more.
The observed labour market gaps bring nuance to the generally positive picture of the education outcomes of youth with an immigrant background. For most regions of origin, young men with an immigrant background who had the same level of education and the same field of study earned less than young men with Canadian-born parents. Similar trends were not observed among young women, however. More research will be required to better understand the reasons for these employment earnings gaps between children of immigrant parents and children from the third generation or more, particularly among young men.
Martin Turcotte is a senior researcher with the Centre for Ethnocultural, Language and Immigration Statistics at Statistics Canada.
Start of text box
Data sources, methods and definitions
Data sources
This study mainly used integrated data from the 2006 and 2016 censuses. The main advantages of this data integration are (1) the availability of information on the family environment of youth before they leave the parental home; (2) a relatively large sample size, allowing for youth to be grouped into several distinct regions of origin (16, including Canada, in this study); and (3) the option of comparing the outcomes of youth from an immigrant background (1.5 and second generation) with those of Canadian youth from the third generation or more, which would not be possible with other databases that include information on immigrants only.Youth aged 18 and older in 2006 were excluded from the study because a larger proportion of youth no longer live with their parents as of age 18 (which makes it impossible to control for family-related variables). All analyses were weighted using a weight to account for the probability of selection for both the 2006 and 2016 censuses.
Definitions
Children of immigrant parents
In this study, the term “children of immigrant parents” (or children “with an immigrant background”) refers to children and youth with one or two immigrant parents. These children were born in Canada (the majority), or they arrived in Canada before age 15 (i.e., the 1.5 generation, who experienced the Canadian school system and earned a high school diploma or postsecondary degree in Canada, as applicable).Note
Regions of origin
The region of origin of children with an immigrant background is the main variable of interest. In this study, in all cases, the region of origin corresponded with the parents’ place of birth, not the children’s own place of birth. When parents had different places of birth, the mother’s place of birth was used unless the mother was born in Canada, in which case the father’s place of birth was used. Children from the third generation or more are children whose parents were both born in Canada. Other than Canada, the following 15 other regions of origin were examined (the main countries of origin for each region are indicated in parentheses): North America (United States), Central America (Mexico, El Salvador, Guatemala), the Caribbean and Bermuda (Jamaica, Haiti, Trinidad and Tobago), South America (Guyana, Brazil, Chile), Western Europe (Germany, France, Netherlands), Eastern Europe (Poland, Russian Federation, Romania), Northern Europe (United Kingdom), Southern Europe (Portugal, Italy), sub-Saharan Africa (Republic of South Africa, Ghana, Tanzania, Nigeria, Kenya), North Africa (Egypt, Morocco, Algeria), West Central Asia and the Middle East (Lebanon, Iran, Afghanistan, Syria), East Asia (China, Hong Kong, South Korea), Southeast Asia (Philippines, Viet Nam, Cambodia), South Asia (India, Sri Lanka), and Oceania and other (Fiji, Australia, New Zealand).
Employment earnings
Employment earnings refer to the wages, salaries and commissions received for paid work. The employment income of self-employed individuals was excluded from the study. For data from the 2016 Census, the reference period is 2015.
Multivariate analysis
In the first section, logistic regression models were used to estimate the adjusted predicted probability of having obtained a given level of education (postsecondary education, university education and STEM [science, technology, engineering, math and computer science] university education). In the tables, control variables are maintained at their average value for the sample in question (i.e., the average value for respondents included in the model in question). Multivariate analyses of employment earnings were conducted using quantile regression.
End of text box
- Date modified: