
Insights on Canadian Society
Results from the 2016 Census: Occupations with older workers

Archived Content
Information identified as archived is provided for reference, research or recordkeeping purposes. It is not subject to the Government of Canada Web Standards and has not been altered or updated since it was archived. Please "contact us" to request a format other than those available.
by Bertrand Ouellet-Léveillé and Anne Milan

Start of text box

Today, Insights on Canadian Society is releasing a study based on 2016 Census data. This study uses census information on employment and occupation. Additional data from the Labour Force Survey (LFS) are also used to provide a comprehensive picture of the aging of the workforce in Canada.
End of text box
Start of text box
Over the past two decades, the share of the employed population aged 55 and over increased significantly. This study uses Census of Population and Labour Force Survey data to examine the changing age composition of workers within the most prevalent occupations (with at least 10,000 workers), as well as the occupations that are increasing and decreasing in size most rapidly.
- The ratio of younger workers to older workers, defined in this study as the number of workers aged 25 to 34 for each worker aged 55 or over, declined from 2.7 in 1996 to 1.0 in 2018.
- The share of workers aged 55 and over in many occupations was smaller for women than for men, reflecting women’s more recent entry into certain occupations. For example, the proportion of general practitioners and family physicians aged 55 and over was twice as high for men (38%) as for women (19%) in 2016, up from 25% for men and 7% for women in 1996.
- Workers who provide care to an increasingly older population are themselves aging. Among female registered nurses and registered psychiatric nurses, 1 in 5 were aged 55 and over in 2016, compared with 1 in 10 in 1996. The ratio of younger to older female workers in this occupation declined from 4.5 in 1996 to 1.6 in 2016.
- In some occupations, population aging may be exacerbated by difficulties attracting younger workers, or by structural changes such as increased automation, which decreases the overall number of workers. Among managers in agriculture, for instance, more than half (52%) were aged 55 and over in 2016, and the ratio of younger workers to older workers was 0.2.
- Aging was a smaller issue for fast-growing occupations such as professional occupations in advertising, marketing and public relations. The total number of workers in this occupation grew by 256% from 1996 to 2016, while the share of older workers rose modestly from 8% to 13% over the same period.
End of text box
Introduction
It is widely understood that Canada, along with many industrialized countries, has an aging population. This has many consequences for the labour force. Attachment to the labour market generally decreases with age,Note which reduces the size of the employed population for older age groups. However, an increasing number of older Canadians have remained in, or returned to, the labour force in recent decades. Understanding the labour market activity of individuals who have reached retirement age and the characteristics of older workers is a growing policy and research interest. For example, recent studies have indicated that seniors who had higher levels of education, had no activity limitations, had mortgage paymentsNote and lived in rural areasNote were more likely to work. In addition, reasons for working at older ages were split roughly evenly between choice and financial necessity.Note
Older workers are increasingly represented in a growing number of occupations.Note While these workers can possess accumulated skills and experience, an occupation or sector that is characterized by larger shares of older workers can foreshadow challenges that employers may face in competing for potential replacements over the coming decades. In some cases, an occupation with aging workers and relatively few younger workers can be a symptom of industries or trades that are in decline in Canada. This could be because either the activities are declining due to automation or outsourcing, such as occupations in some manufacturing industries, or substitutes are now used more frequentlyNote , as in the case of postal workers.
In this study, data from the Census of Population (1996 and 2016) and from the Labour Force Survey, or LFS (1996 to 2018) are used to examine changes in the age composition of occupations (see the Data sources, methods and definitions section for additional details). For the purpose of this analysis, occupations include those with at least 10,000 workers and a comparable classification in both 1996 and 2016. The primary indicators used in this study to measure aging in occupations are the proportion of employed population aged 55 and over, and the ratio of younger workers to older workers, which can also be seen as a measure of occupational renewal.Note This ratio is defined as the number of employed people aged 25 to 34 over the number of employed people aged 55 and over.
First, this study explores the variation in the number of younger and older workers in broad occupational groups from 1996 to 2018. This is followed by an analysis of three categories of the most prevalent occupations for men and women: occupations usually requiring a university degree, occupations not usually requiring a university degree, and management occupations. This approach is used because the extent and pace of aging of occupations that require a higher level of education, or specific experience or skills, may differ from those of occupations that require a lower level of education. Furthermore, results are analyzed separately for women and men, given their different occupational profiles. Finally, the occupations that grew most rapidly—and those that declined the most—in the 20 years to 2016 are examined.
Being able to identify which occupations—such as nurses and physicians—may be in greater demand as the population becomes older, as well as the extent to which workers in these occupations are themselves aging, is important. It will allow policy makers and planners to better prepare for potential labour demands or shortages, and to develop strategies for occupational rejuvenation.
Ratio of younger workers to older workers currently near parity
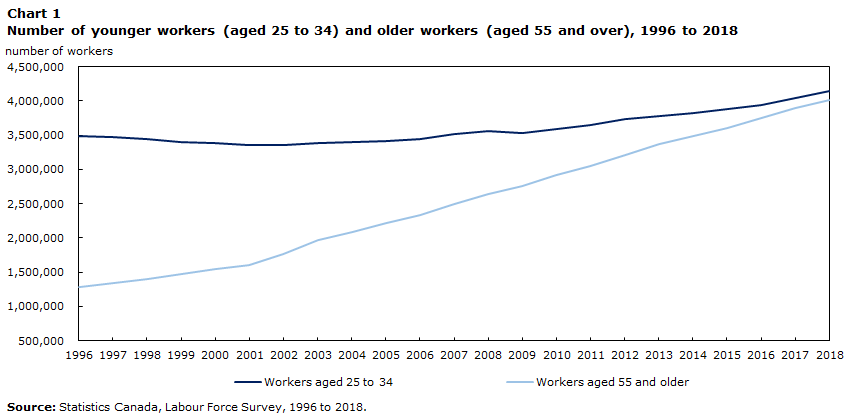
The changing age composition of workers can be observed in the increasing share of older workers (aged 55 and over). According to the LFS, in 2018, the number of older workers (4.0 million) nearly converged with that of younger workers aged 25 to 34 (4.1 million).Note Growth in the number of older workers began to accelerate in 2001, the year that the first wave of the large baby-boom cohort reached age 55 (Chart 1).Note While the number of younger workers increased (+18%) from 1996 to 2018, mostly since 2009, the number of older workers more than tripled (+213%) over the same 22-year period. Consequently, the share of workers aged 55 and over rose from 10% in 1996 to 21% in 2018 (increasing from 8% to 21% for women, and from 11% to 22% for men).Note
Data table for Chart 1
| Year | Workers aged 25 to 34 | Workers aged 55 and older |
|---|---|---|
| number of workers | ||
| 1996 | 3,494,000 | 1,282,000 |
| 1997 | 3,470,000 | 1,339,000 |
| 1998 | 3,450,000 | 1,398,000 |
| 1999 | 3,394,000 | 1,467,000 |
| 2000 | 3,385,000 | 1,540,000 |
| 2001 | 3,363,000 | 1,598,000 |
| 2002 | 3,352,000 | 1,761,000 |
| 2003 | 3,380,000 | 1,970,000 |
| 2004 | 3,405,000 | 2,089,000 |
| 2005 | 3,415,000 | 2,222,000 |
| 2006 | 3,440,000 | 2,335,000 |
| 2007 | 3,513,000 | 2,500,000 |
| 2008 | 3,557,000 | 2,646,000 |
| 2009 | 3,529,000 | 2,755,000 |
| 2010 | 3,596,000 | 2,923,000 |
| 2011 | 3,655,000 | 3,053,000 |
| 2012 | 3,732,000 | 3,209,000 |
| 2013 | 3,778,000 | 3,369,000 |
| 2014 | 3,820,000 | 3,491,000 |
| 2015 | 3,877,000 | 3,602,000 |
| 2016 | 3,947,000 | 3,749,000 |
| 2017 | 4,045,000 | 3,890,000 |
| 2018 | 4,139,000 | 4,011,000 |
| Source: Statistics Canada, Labour Force Survey, 1996 to 2018. | ||
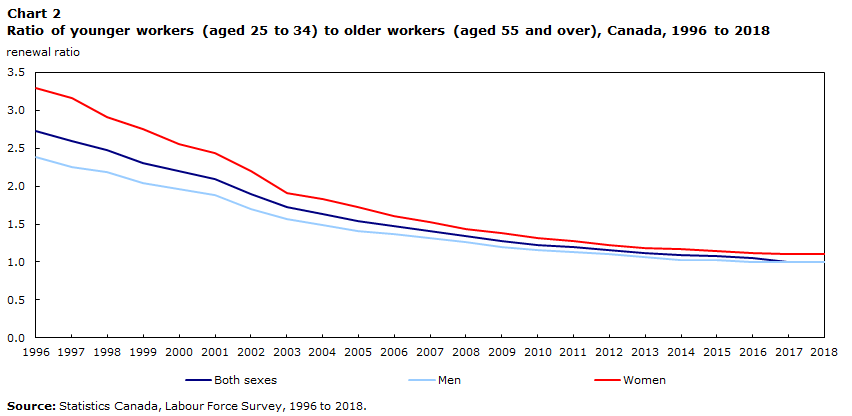
The ratio of younger workers to older workers gives an indication of the renewal of the employed population. The majority of younger workers have completed the educational requirements necessary for most occupations and can be expected to remain in the labour force for many additional years, while older workers are nearer to exiting the labour force. A ratio greater than 1.0 means that there are more younger workers than older workers, or more relatively recent entrants compared with those expected to leave the labour market more quickly. Conversely, a ratio of less than 1.0 means more exits than recent entries and may indicate a difficulty in replacing retiring workers. A ratio equal to 1.0 indicates that there are as many younger workers as there are older workers. Ensuring an adequate number of replacements for particular occupations may be a challenge because the population under age 35 is seeing virtually no growth.Note
This renewal ratio has fallen over time since the growth in the number of younger workers has not kept pace with the increase of older workers (Chart 2). In 1996, a ratio of 2.7 was observed with LFS data, meaning that there were 2.7 younger workers for each older worker in Canada. By 2018, there was an equivalent number of younger workers and older workers, resulting in a ratio of 1.0.
Data table for Chart 2
| Both sexes | Men | Women | |
|---|---|---|---|
| renewal ratio | |||
| 1996 | 2.7 | 2.4 | 3.3 |
| 1997 | 2.6 | 2.3 | 3.2 |
| 1998 | 2.5 | 2.2 | 2.9 |
| 1999 | 2.3 | 2.0 | 2.8 |
| 2000 | 2.2 | 2.0 | 2.6 |
| 2001 | 2.1 | 1.9 | 2.4 |
| 2002 | 1.9 | 1.7 | 2.2 |
| 2003 | 1.7 | 1.6 | 1.9 |
| 2004 | 1.6 | 1.5 | 1.8 |
| 2005 | 1.5 | 1.4 | 1.7 |
| 2006 | 1.5 | 1.4 | 1.6 |
| 2007 | 1.4 | 1.3 | 1.5 |
| 2008 | 1.3 | 1.3 | 1.4 |
| 2009 | 1.3 | 1.2 | 1.4 |
| 2010 | 1.2 | 1.2 | 1.3 |
| 2011 | 1.2 | 1.1 | 1.3 |
| 2012 | 1.2 | 1.1 | 1.2 |
| 2013 | 1.1 | 1.1 | 1.2 |
| 2014 | 1.1 | 1.0 | 1.2 |
| 2015 | 1.1 | 1.0 | 1.2 |
| 2016 | 1.1 | 1.0 | 1.1 |
| 2017 | 1.0 | 1.0 | 1.1 |
| 2018 | 1.0 | 1.0 | 1.1 |
| Source: Statistics Canada, Labour Force Survey, 1996 to 2018. | |||
Among the employed population, the ratio in 1996 was larger for women (3.3) than for men (2.4), reflecting the increase in women joining the labour force throughout the preceding decades.Note Over the last two decades, the renewal ratio fell more sharply for women as their labour market entry began to slow, and, by 2018, the renewal ratio was about 1.0 for both women and men.
The ratio of younger workers to older workers varied across occupations (Chart 3). For natural and applied sciences and related occupations, the ratio of younger workers to older workers was 1.7 in 2018—the highest among the broad occupational groups—but one-third of what it was in 1996 (5.3). For women, the drop during the 22-year period from 1996 to 2018 was even more striking, falling from 11.2 to 2.1. In 1996, there were few older women in these occupations, but, from 1996 to 2018, women entered these occupations more quickly (+155%) than men (+93%). As these women grew older and were not replaced by younger women at the same pace, the renewal ratio fell. Despite their gains in numbers, women still represented less than one-quarter of workers in natural and applied sciences and related occupations in 2018.

Data table for Chart 3
| Occupational category | 1996 | 2018 |
|---|---|---|
| renewal ratio | ||
| All occupations | 2.7 | 1.0 |
| Natural and applied sciences and related occupations | 5.3 | 1.7 |
| Occupations in art, culture, recreation and sport | 3.8 | 1.1 |
| Health occupations | 3.6 | 1.5 |
| Occupations in manufacturing and utilities | 3.4 | 0.8 |
| Business, finance and administration occupations | 3.1 | 0.9 |
| Occupations in education, law and social, community and government services |
3.0 | 1.3 |
| Trades, transport and equipment operators and related occupations | 2.8 | 1.0 |
| Sales and service occupations | 2.5 | 1.1 |
| Natural resources, agriculture and related production occupations | 2.4 | 1.0 |
| Management occupations | 1.4 | 0.5 |
| Source: Statistics Canada, Labour Force Survey, 1996 and 2018. | ||
In health occupations, the occupational renewal ratio was 3.6 younger workers for every older worker in 1996, a ratio that more than halved 22 years later (1.5 in 2016). Although the number of younger workers in this occupational category increased by 77% from 1996 to 2016, the number of older workers more than quadrupled (+334%). For more information, see the section titled Growth of health care occupations.
In occupations in manufacturing and utilities, the occupational renewal ratio was 3.4 in 1996. As the number of younger workers declined and the number of older workers more than doubled over time, this ratio decreased to 0.8 in 2018, meaning that the number of younger workers entering these occupations was lower than the number of workers near the end of their working lives. Specifically, the number of workers aged 55 and over increased by about 161%, while the overall number of workers in manufacturing fell from 1996 to 2018, mostly from 2004 to 2009.
In business, finance and administration occupations, the ratio of younger workers to older workers was below 1.0 in 2018—down from 3.1 in 1996. Over the 22‑year period, the number of younger workers in this broad occupational group was little changed (+2%), while the number of older workers tripled (+236%).
Women mitigating the impact of aging in many occupations requiring a university degree
The extent of aging within occupations from 1996 to 2016 can be examined using data from the Census of Population, since it can provide information at the most detailed occupational level by age and gender. The analysis is divided into three categories of the most prevalent occupations: occupations usually requiring a university degree, occupations not usually requiring a university degree, and management occupations. Only occupations that were comparable over time were analyzed.Note Employers may find it more challenging to replace aging workers in occupations that usually require a university degree, as well as aging workers in management occupations, since these workers typically require specific education and skills or higher-level experience compared with other occupations. Given the different occupational profile of women and men—women are more concentrated in a smaller number of occupations—they are considered separately.
In 2016, the predominant occupation for women usually requiring a university degree (Skill Level A in the National Occupational Classification [NOC]Note ) was registered nurses and registered psychiatric nurses (Table 1). Among the 263,000 women in this occupation in 2016, 20% were aged 55 and over—the same as the national proportion of older employed women, and double the proportion of older women in this occupation in 1996 (10%).Note Among female registered nurses and registered psychiatric nurses, the proportion of those aged 25 to 34 increased by 77% from 1996 to 2016, a slower rise than for the older ones (+158%), lowering the renewal ratio from 4.5 in 1996 to 1.6 in 2016. The aging of health care workers creates a particular challenge, because of the increase in demand for health care services brought about by the aging of the population.
| 1996 | 2016 | |||||||
|---|---|---|---|---|---|---|---|---|
| Workers | Proportion of workers aged 55 and over | Median age | Ratio of younger workers to older workersTable 1 Note 2 | Workers | Proportion of workers aged 55 and over | Median age | Ratio of younger workers to older workersTable 1 Note 2 | |
| number | percent | years | ratio | number | percent | years | ratio | |
| Occupation | ||||||||
| Registered nurses and registered psychiatric nurses | 214,800 | 9.6 | 41.6 | 4.51 | 262,500 | 20.3 | 42.8 | 1.56 |
| Elementary school and kindergarten teachers | 183,100 | 7.2 | 43.7 | 4.18 | 238,700 | 13.8 | 41.2 | 2.65 |
| Financial auditors and accountants | 52,200 | 6.4 | 37.2 | 4.65 | 108,400 | 19.1 | 43.8 | 1.35 |
| Secondary school teachers | 77,300 | 7.9 | 42.7 | 4.12 | 94,900 | 16.0 | 42.2 | 2.58 |
| Professional occupations in advertising, marketing and public relations | 16,200 | 5.6 | 36.7 | 5.45 | 60,100 | 10.9 | 35.7 | 4.03 |
| Human resources professionals | 14,200 | 3.7 | 40.2 | 10.40 | 53,200 | 15.1 | 40.8 | 1.82 |
| Other financial officersTable 1 Note 1 | 12,200 | 6.9 | 38.8 | 3.61 | 51,600 | 19.5 | 44.3 | 1.21 |
| Social workers | 28,400 | 6.1 | 39.2 | 3.97 | 49,200 | 16.7 | 41.4 | 2.22 |
| College and other vocational instructors | 46,800 | 8.1 | 41.4 | 4.48 | 47,200 | 25.2 | 46.1 | 0.65 |
| Lawyers and Quebec notaries | 17,600 | 2.3 | 35.8 | 6.06 | 39,500 | 15.1 | 39.9 | 2.56 |
| Post-secondary teaching and research assistants | 12,000 | 3.4 | 29.1 | 23.03 | 34,000 | 7.0 | 28.9 | 6.71 |
| Professional occupations in business management consulting | 12,600 | 5.2 | 38.6 | 3.33 | 33,800 | 18.7 | 43.7 | 0.99 |
| Business development officers and marketing researchers and consultants | 12,200 | 4.4 | 34.9 | 8.46 | 31,900 | 11.8 | 38.1 | 4.28 |
| University professors and lecturers | 15,500 | 14.0 | 43.2 | 2.23 | 28,800 | 30.3 | 47.6 | 0.40 |
| General practitioners and family physicians | 11,300 | 6.8 | 37.8 | 7.83 | 26,500 | 18.8 | 40.7 | 1.47 |
|
||||||||
The share of workers aged 55 and over was smaller for women than for men in many occupations, reflecting women’s comparatively more recent entry into the labour force (Table 2). This has mitigated the impact of aging within certain occupations, such as general practitioners and family physicians. Despite the relatively larger share of older workers in this occupation, the proportion of men aged 55 and over (38%) was double that of women (19%) in 2016.Note From 1996 to 2016, the number of female general practitioners and family physicians grew more quickly (+135%) than the number of their male counterparts (+14%). This pattern was also seen in other professional occupations, such as lawyers and Quebec notaries, as well as financial auditors and accountants.
| 1996 | 2016 | |||||||
|---|---|---|---|---|---|---|---|---|
| Workers | Proportion of workers aged 55 and over | Median age | Ratio of younger workers to older workersTable 2 Note 2 | Workers | Proportion of workers aged 55 and over | Median age | Ratio of younger workers to older workersTable 2 Note 2 | |
| number | percent | years | ratio | number | percent | years | ratio | |
| Occupation | ||||||||
| Financial auditors and accountants | 64,100 | 13.8 | 41.9 | 2.06 | 85,200 | 30.7 | 46.3 | 0.88 |
| Secondary school teachers | 76,200 | 11.8 | 46.3 | 2.41 | 66,000 | 21.1 | 45.2 | 0.88 |
| Other financial officersTable 2 Note 1 | 20,400 | 16.6 | 42.7 | 2.52 | 62,300 | 25.4 | 44.4 | 1.15 |
| Lawyers and Quebec notaries | 40,200 | 13.3 | 43.4 | 1.52 | 50,400 | 36.7 | 48.5 | 0.71 |
| Mechanical engineers | 24,100 | 11.8 | 39.0 | 3.39 | 47,200 | 19.8 | 42.1 | 1.41 |
| Civil engineers | 28,600 | 14.2 | 40.9 | 3.27 | 45,400 | 25.2 | 44.5 | 1.53 |
| Elementary school and kindergarten teachers | 42,500 | 6.5 | 44.2 | 7.68 | 44,800 | 14.6 | 41.8 | 3.45 |
| Professional occupations in business management consulting | 22,600 | 20.4 | 44.4 | 0.79 | 44,500 | 29.3 | 46.3 | 0.45 |
| College and other vocational instructors | 44,400 | 15.4 | 45.1 | 1.14 | 40,100 | 34.0 | 49.9 | 0.36 |
| Electrical and electronics engineers | 29,800 | 9.2 | 38.7 | 4.23 | 39,800 | 21.3 | 44.2 | 1.73 |
| University professors and lecturers | 31,500 | 29.2 | 49.1 | 0.38 | 37,600 | 36.8 | 50.1 | 0.32 |
| Business development officers and marketing researchers and consultants | 13,700 | 11.8 | 40.2 | 3.78 | 31,000 | 19.4 | 40.9 | 1.67 |
| Professional occupations in advertising, marketing and public relations | 9,100 | 12.0 | 40.3 | 2.16 | 29,900 | 16.3 | 38.3 | 1.77 |
| General practitioners and family physicians | 26,100 | 25.4 | 45.8 | 1.87 | 29,800 | 37.9 | 49.7 | 0.71 |
| Financial and investment analysts | 11,000 | 7.9 | 37.5 | 3.25 | 28,400 | 12.1 | 37.3 | 7.61 |
|
||||||||
Financial auditors and accountants was the most prevalent occupation usually requiring a university degree for men, with 85,000 employed men in 2016. The share of men aged 55 and over in this occupation rose from 14% in 1996 to 31% in 2016, while the renewal ratio fell from 2.1 to 0.9. For women, this was the third most common occupation in 2016. The composition by sex of financial auditors and accountants changed over time, however, from a male majority in 1996 to a female majority in 2016. Despite the younger age profile of women compared with men, the proportion of older women in this occupation tripled from 6% in 1996 to 19% in 2016, and their renewal ratio fell from 4.7 to 1.3.
For women, 5 of the 15 most prevalent occupations usually requiring a university degree were in the educational sector, as were 4 of the top occupations for men, although aging patterns varied within these occupations. Elementary school and kindergarten teachers tended to be younger. About 1 in 7 elementary school and kindergarten teachers were aged 55 and over in 2016, up from 1 in 14 in 1996, with little difference by sex. Among secondary school teachers, the proportion of older workers increased from 8% in 1996 to 16% in 2016 for women, and from 12% to 21% for men over this same 20-year period, which is exacerbated by a decline in young men in this occupation. In contrast, university professors and lecturers tended to be older in both 1996 and 2016.
The share of male university professors and lecturers aged 55 and over increased from 29% in 1996 to 37% in 2016, while the proportion of their female counterparts rose from 14% to 30% over the same period. The growing share of full-time academic staff in senior positions resulting from factors such as the aging of the large baby-boom cohort and the end of mandatory retirement, has contributed to an older university teaching workforce.Note
Some prevalent occupations usually requiring a university degree were characterized by rapid growth, a slower pace of aging than the national average, and renewal ratios well above replacement. This was the case for both women and men in professional occupations in advertising, marketing and public relations, as well as business development officers and marketing researchers and consultants. Smaller shares of workers aged 55 and over were found for some of the occupations most prevalent only among women (notably, social workers and human resources professionals). Among the prevalent occupations for men, smaller shares of older workers were found for several engineering occupations (mechanical, civil, and electrical and electronics).
Several occupations not requiring a university degree have a large proportion of older workers, including transport truck drivers, cleaners, and janitors
While 12 of the 15 most prevalent occupations usually requiring a university degree were common to both women and men, this was the case for only 2 of the 15 occupations that did not require a university education (tables 3 and 4). Prevalent occupations for women included administrative support and office support workers, while trades such as welders, electricians, labourers and vehicle repair were among the predominant occupations for men.
| 1996 | 2016 | |||||||
|---|---|---|---|---|---|---|---|---|
| Workers | Proportion of workers aged 55 and over | Median age | Ratio of younger workers to older workersTable 3 Note 3 | Workers | Proportion of workers aged 55 and over | Median age | Ratio of younger workers to older workersTable 3 Note 3 | |
| number | percent | years | ratio | number | percent | years | ratio | |
| Occupation | ||||||||
| Retail salespersons | 311,400 | 9.7 | 32.6 | 2.21 | 355,600 | 20.0 | 33.0 | 1.09 |
| Cashiers | 214,800 | 4.3 | 24.9 | 4.08 | 260,500 | 14.3 | 24.6 | 0.95 |
| Administrative assistantsTable 3 Note 1 | 294,200 | 10.7 | 41.0 | 2.39 | 230,600 | 29.8 | 48.4 | 0.49 |
| Administrative officers | 76,300 | 8.9 | 40.7 | 5.07 | 218,000 | 26.3 | 47.3 | 0.84 |
| Nurse aides, orderlies and patient service associates | 98,500 | 12.0 | 41.6 | 2.23 | 213,000 | 23.4 | 45.1 | 0.75 |
| General office support workers | 160,700 | 10.1 | 39.2 | 2.95 | 190,500 | 27.4 | 46.8 | 0.67 |
| Early childhood educators and assistants | 76,900 | 4.7 | 33.8 | 6.01 | 186,600 | 12.8 | 39.5 | 1.71 |
| Food and beverage servers | 157,200 | 3.2 | 26.2 | 8.61 | 167,000 | 8.0 | 26.0 | 3.14 |
| Light duty cleaners | 97,800 | 14.8 | 41.4 | 1.25 | 164,900 | 31.6 | 49.2 | 0.49 |
| Other customer and information services representativesTable 3 Note 2 | 74,300 | 5.0 | 34.2 | 4.22 | 128,300 | 16.2 | 38.8 | 1.32 |
| Accounting and related clerks | 209,100 | 9.2 | 38.9 | 5.81 | 117,700 | 27.0 | 47.5 | 0.97 |
| Accounting technicians and bookkeepers | 89,300 | 16.3 | 41.7 | 1.30 | 112,500 | 37.5 | 51.2 | 0.29 |
| Social and community service workers | 35,500 | 5.8 | 35.8 | 4.10 | 108,600 | 17.5 | 40.4 | 1.93 |
| Elementary and secondary school teacher assistants | 52,300 | 9.2 | 41.3 | 1.71 | 108,400 | 24.9 | 46.6 | 0.53 |
| Cooks | 82,800 | 12.7 | 39.4 | 1.71 | 86,200 | 24.0 | 44.0 | 0.71 |
|
||||||||
| 1996 | 2016 | |||||||
|---|---|---|---|---|---|---|---|---|
| Workers | Proportion of workers aged 55 and over | Median age | Ratio of younger workers to older workersTable 4 Note 1 | Workers | Proportion of workers aged 55 and over | Median age | Ratio of younger workers to older workersTable 4 Note 1 | |
| number | percent | years | ratio | number | percent | years | ratio | |
| Occupation | ||||||||
| Transport truck drivers | 198,000 | 12.2 | 40.0 | 2.49 | 278,500 | 31.4 | 48.9 | 0.57 |
| Retail salespersons | 201,300 | 10.5 | 32.8 | 3.44 | 271,200 | 21.1 | 33.3 | 1.00 |
| Janitors, caretakers and building superintendents | 168,800 | 19.6 | 41.1 | 0.99 | 160,800 | 36.9 | 50.9 | 0.35 |
| Construction trades helpers and labourers | 75,800 | 7.5 | 33.1 | 3.48 | 152,200 | 14.9 | 35.9 | 2.16 |
| Automotive service technicians, truck and bus mechanics and mechanical repairers | 120,500 | 8.7 | 36.3 | 5.10 | 147,900 | 19.3 | 41.0 | 1.60 |
| Material handlers | 105,400 | 7.0 | 34.1 | 4.41 | 146,600 | 19.3 | 40.2 | 1.38 |
| Carpenters | 93,000 | 12.2 | 39.2 | 3.24 | 144,600 | 20.3 | 39.9 | 2.00 |
| Cooks | 92,400 | 5.8 | 27.8 | 5.60 | 124,500 | 10.2 | 28.9 | 2.38 |
| Store shelf stockers, clerks and order fillers | 78,300 | 2.8 | 21.7 | 5.82 | 108,600 | 12.0 | 24.3 | 1.34 |
| Landscaping and grounds maintenance labourers | 54,300 | 8.4 | 27.5 | 2.60 | 83,100 | 19.4 | 32.2 | 0.97 |
| Welders and related machine operators | 78,600 | 9.3 | 38.8 | 4.69 | 83,000 | 19.0 | 40.3 | 1.70 |
| Electricians (except industrial and power system) | 39,500 | 9.6 | 38.5 | 4.68 | 82,100 | 15.8 | 36.7 | 2.42 |
| Delivery and courier service drivers | 82,100 | 10.3 | 35.4 | 3.29 | 80,400 | 30.5 | 47.0 | 0.55 |
| Shippers and receivers | 85,600 | 6.8 | 33.9 | 6.57 | 80,100 | 21.7 | 42.7 | 0.94 |
| Heavy equipment operators (except crane) | 52,300 | 13.8 | 41.1 | 2.18 | 72,800 | 25.3 | 44.8 | 0.95 |
|
||||||||
As more and more youth are going to university or college, the difficulty attracting younger workers is evident in a number of these prevalent occupations. Among men, transport truck drivers was the largest occupation, with more than 278,000 men employed in 2016. About 31% (nearly one-third) of these workers were aged 55 and over in 2016, up from 12% in 1996.Note Transport truck drivers has been among the top occupations for the most employer-reported vacancies in recent years. In 1996, there were 2.5 transport truck drivers aged 25 to 34 for each transport truck driver aged 55 and over, a ratio that fell to 0.6 in 2016. Other occupations not usually requiring a university degree were overrepresented among older workers. Among men, 37% of janitors, caretakers and building superintendents were aged 55 and over in 2016 (up from 20% in 1996). Similarly, among women, 32% (about one-third) of light duty cleaners were older workers in 2016 (up from 15% in 1996).
Many of the most prevalent occupations that do not usually require a university degree, especially those in the accommodation and food services and retail trade sectors, were overrepresented among the youngest workers (aged 15 to 24),Note who often turn to these types of jobs to support their studies. In 2016, nearly 600,000 of the youngest workers were employed in three occupations: retail salespersons; cashiers; and food counter attendants, kitchen helpers and related support occupations. These occupations are also paid below averageNote and have relatively high turnover, consistently large numbers of vacancies, and generally smaller shares of workers aged 55 and over. The most prevalent occupation not usually requiring a university education for women (and second most common for men) across all age groups in 2016 was retail salespersons. Nevertheless, about one in five retail salespersons was aged 55 or over, slightly below the average for all occupations (22%), and double the share for this occupation in 1996.
The only other occupation not requiring a university degree that appeared in the top 15 occupations of both women and men was cooks. Previous research has noted the declining proportion of female cooks aged 25 to 34 in recent decades.Note Consequently, the share of female cooks aged 55 and over was 24% in 2016, with a renewal ratio below replacement (0.7). In comparison, the share of older male cooks was smaller, at 10% in 2016, contributing to a renewal ratio of 2.4.
Over half of agriculture managers are aged 55 and over
Among the five most prevalent management occupations, the share of workers aged 55 and over varied. Senior managers are generally older, given the experience often required for such positions. These occupations may also be less physically demanding and reflect more office-related work, allowing individuals to remain in, or take on, these jobs at older ages. Still, while aging affects all of the most common management occupations, the extent has varied.
The most notable prevalent management occupation is in agriculture, where the overall number of managers declined for both men (-35%) and women (-27%) from 1996 to 2016 (tables 5 and 6). This reflects the long-term decline in agricultural employment over the past century, which is related to socioeconomic changes that include increased farm concentration and new technology, such as automation.Note Note In 1996, this occupation was already characterized by a relatively high proportion of older workers, and this has increased over time, but not at the pace of some other occupations. Specifically, over half of women and men (52% in both cases) were aged 55 and over in 2016, up from 37% for women and 41% for men in 1996.Note Note Managers in agriculture was also among the few occupations that already had a renewal ratio well below 1.0 for both women and men in 1996 (0.4 each), although it declined further to 0.1 for women and 0.2 for men by 2016.
| 1996 | 2016 | |||||||
|---|---|---|---|---|---|---|---|---|
| Workers | Proportion of workers aged 55 and over | Median age | Ratio of younger workers to older workersTable 5 Note 1 | Workers | Proportion of workers aged 55 and over | Median age | Ratio of younger workers to older workersTable 5 Note 1 | |
| number | percent | years | ratio | number | percent | years | ratio | |
| Occupation | ||||||||
| Retail and wholesale trade managers | 108,300 | 9.9 | 38.9 | 2.41 | 161,400 | 20.6 | 44.3 | 0.69 |
| Restaurant and food service managers | 42,400 | 7.4 | 37.0 | 3.65 | 62,500 | 15.4 | 40.8 | 0.84 |
| Financial managers | 18,900 | 7.7 | 39.8 | 5.70 | 42,000 | 23.0 | 47.2 | 0.65 |
| Managers in agriculture | 52,000 | 36.5 | 49.3 | 0.42 | 38,200 | 52.1 | 55.7 | 0.14 |
| Advertising, marketing and public relations managers | 25,100 | 4.6 | 37.2 | 13.43 | 37,500 | 10.0 | 38.9 | 1.50 |
|
||||||||
| 1996 | 2016 | |||||||
|---|---|---|---|---|---|---|---|---|
| Workers | Proportion of workers aged 55 and over | Median age | Ratio of younger workers to older workersTable 6 Note 1 | Workers | Proportion of workers aged 55 and over | Median age | Ratio of younger workers to older workersTable 6 Note 1 | |
| number | percent | years | ratio | number | percent | years | ratio | |
| Occupation | ||||||||
| Retail and wholesale trade managers | 175,100 | 13.0 | 40.9 | 1.89 | 225,900 | 26.7 | 46.8 | 0.48 |
| Managers in agriculture | 174,900 | 41.5 | 50.8 | 0.36 | 114,100 | 51.6 | 55.6 | 0.20 |
| Construction managers | 41,500 | 16.9 | 43.4 | 2.19 | 73,300 | 25.1 | 45.9 | 1.01 |
| Restaurant and food service managers | 58,200 | 11.3 | 37.8 | 3.60 | 64,000 | 20.3 | 42.6 | 0.79 |
| Manufacturing managers | 50,200 | 15.6 | 43.9 | 1.00 | 55,900 | 29.2 | 49.2 | 0.32 |
|
||||||||
Despite the large share of older managers in agriculture, the most prevalent management occupation in 2016 for both women and men was retail and wholesale trade managers, with the share of workers aged 55 and over doubling since 1996 to 21% for women and 27% for men.
Aging patterns in other management occupations reflect trends in broader occupational groups. For example, similar to other occupations within the accommodation and food services sector, the proportions of female and male restaurant and food service managers aged 55 and over (15% for women and 20% for men) in 2016 were below the national proportions for older employed women (20%) and men (23%).
Among women employed as advertising, marketing and public relations managers, a smaller share of workers was aged 55 and over, at 10% in 2016, up from 5% in 1996. In 2016, common management occupations for men included construction managers and manufacturing managers. Among men, the share of manufacturing managers aged 55 and over nearly doubled from 16% in 1996 to 29% in 2016, while there was a moderate increase for construction managers, from 17% to 25% over the same period.
Aging related to pace of growth within occupations
The number of workers in some occupations has increased greatly over the 20-year period from 1996 to 2016. The pace of aging is influenced by patterns of growth within occupations. In other words, rapidly growing occupations slow the pace of aging, while occupations that are declining in numbers become older more quickly (tables 7 and 8). Occupations where employment tripled or more between 1996 and 2016 include professional occupations in advertising, marketing and public relations (+256%); computer and information systems managers (+209%); and inspectors in public and environmental health and occupational health and safety (+207%).Note While aging still occurred in fast-growing occupations, it was generally less of an issue. For example, the share of older workers in professional occupations in advertising, marketing and public relations increased modestly, from 8% in 1996 to 13% in 2016.
| Workers | Percent change in number of workers | Proportion of workers aged 55 and over | |||
|---|---|---|---|---|---|
| 1996 | 2016 | 1996 to 2016 | 1996 | 2016 | |
| number | percent | ||||
| Occupation | |||||
| Executive assistantsTable 7 Note 2 | 11,300 | 43,600 | 286 | 8.0 | 25.2 |
| Estheticians, electrologists and related occupations | 15,100 | 57,800 | 284 | 5.2 | 11.2 |
| Professional occupations in advertising, marketing and public relations | 25,300 | 89,900 | 256 | 7.9 | 12.7 |
| Computer and information systems managers | 20,100 | 62,200 | 209 | 5.0 | 15.6 |
| Inspectors in public and environmental health and occupational health and safety | 10,200 | 31,300 | 207 | 10.6 | 20.9 |
| Social and community service workers | 48,200 | 139,800 | 190 | 5.7 | 17.9 |
| Chefs | 20,500 | 59,000 | 188 | 8.8 | 14.5 |
| Financial and investment analysts | 18,900 | 51,600 | 173 | 6.1 | 11.8 |
| Human resources professionals | 26,800 | 72,300 | 170 | 8.5 | 18.3 |
| Food service supervisors | 15,300 | 40,400 | 164 | 5.6 | 7.8 |
| Administrative officersTable 7 Note 2 | 100,100 | 260,500 | 160 | 10.2 | 26.0 |
| Financial sales representatives | 24,200 | 60,500 | 151 | 4.4 | 15.8 |
| Post-secondary teaching and research assistants | 24,900 | 62,300 | 150 | 4.1 | 6.8 |
| Business development officers and marketing researchers and consultants | 25,900 | 62,900 | 143 | 8.3 | 15.5 |
| Early childhood educators and assistants | 79,900 | 193,600 | 142 | 4.6 | 12.9 |
| Purchasing agents and officers | 18,500 | 44,300 | 139 | 9.6 | 23.6 |
| Human resources and recruitment officers | 12,900 | 30,600 | 137 | 8.0 | 13.3 |
| Dental hygienists and dental therapists | 11,100 | 26,100 | 136 | 1.0 | 11.0 |
| Residential and commercial installers and servicers | 19,800 | 46,400 | 135 | 7.3 | 18.1 |
| Professional occupations in business management consulting | 35,200 | 78,300 | 123 | 15.0 | 24.7 |
| Program leaders and instructors in recreation, sport and fitness | 47,000 | 104,700 | 123 | 3.4 | 8.7 |
| Senior managers – financial, communications and other business services | 28,700 | 61,400 | 114 | 20.2 | 32.4 |
| Nurse aides, orderlies and patient service associates | 117,500 | 245,500 | 109 | 11.3 | 23.1 |
| Electricians (except industrial and power system) | 40,100 | 83,700 | 109 | 9.5 | 15.7 |
| Elementary and secondary school teacher assistants | 57,600 | 119,900 | 108 | 9.1 | 24.5 |
|
|||||
| Workers | Percent change in number of workers | Proportion of workers aged 55 and over | |||
|---|---|---|---|---|---|
| 1996 | 2016 | 1996 to 2016 | 1996 | 2016 | |
| number | percent | ||||
| Occupation | |||||
| Industrial sewing machine operators | 60,900 | 16,200 | -73 | 11.7 | 41.6 |
| Service station attendants | 41,300 | 16,800 | -59 | 3.2 | 14.0 |
| Data entry clerks | 82,000 | 34,000 | -59 | 6.2 | 20.9 |
| Banking, insurance and other financial clerks | 54,200 | 23,600 | -56 | 5.8 | 20.0 |
| Supervisors, general office and administrative support workers | 27,300 | 12,700 | -54 | 9.4 | 21.9 |
| Accounting and related clerks | 251,400 | 140,900 | -44 | 9.9 | 26.7 |
| Electronics assemblers, fabricators, inspectors and testers | 24,400 | 14,300 | -42 | 6.5 | 29.0 |
| Labourers in wood, pulp and paper processing | 35,300 | 21,200 | -40 | 6.0 | 21.8 |
| Mechanical assemblers and inspectors | 17,300 | 10,500 | -40 | 8.4 | 23.0 |
| Couriers, messengers and door-to-door distributors | 43,400 | 26,700 | -38 | 7.9 | 30.1 |
| Sales and account representatives – wholesale trade (non-technical) | 173,400 | 108,800 | -37 | 12.3 | 25.9 |
| Nursery and greenhouse workers | 23,500 | 14,800 | -37 | 11.1 | 26.1 |
| Advertising, marketing and public relations managers | 103,400 | 66,300 | -36 | 10.8 | 12.4 |
| Survey interviewers and statistical clerks | 25,700 | 17,100 | -34 | 13.0 | 35.2 |
| Home child care providers | 129,200 | 85,800 | -34 | 9.7 | 20.3 |
| Managers in agriculture | 226,900 | 152,300 | -33 | 40.4 | 51.7 |
| Purchasing and inventory control workers | 41,700 | 28,100 | -33 | 7.2 | 21.5 |
| Fishermen/women | 21,300 | 15,000 | -30 | 13.2 | 31.5 |
| Supervisors, finance and insurance office workers | 26,100 | 18,500 | -29 | 6.6 | 22.6 |
| Labourers in metal fabrication | 18,400 | 13,300 | -28 | 7.7 | 21.2 |
| Mail, postal and related workers | 39,000 | 28,100 | -28 | 11.7 | 32.9 |
| Machining tool operators | 14,500 | 10,600 | -27 | 9.1 | 24.3 |
| Tailors, dressmakers, furriers and milliners | 21,600 | 16,200 | -25 | 22.4 | 47.9 |
| Customer services representatives – financial institutions | 95,100 | 73,200 | -23 | 3.8 | 16.2 |
| Butchers, meat cutters and fishmongers – retail and wholesale | 24,400 | 18,800 | -23 | 10.4 | 26.4 |
|
|||||
The occupation that declined the most quickly is within the clothing manufacturing sector. The number of industrial sewing machine operators decreased significantly (from 61,000 to 16,000, or -73%) from 1996 to 2016. Note In fact, from 2004 to 2008, about half of the employment in clothing manufacturing and textile and textile product mills disappeared.Note In addition to globalization and outsourcing of the textiles manufacturing industry, this occupation may be subject to greater automation and turnover, and may attract fewer younger workers willing to be apprenticed in the trade. Industrial sewing machine operators also had the highest increase in workers aged 55 and over across all occupations, from 12% in 1996 to 42% in 2016 (+30 percentage points).
Other occupations with large declines over the two-decade period include service station attendants (-59%); data entry clerks (-59%); and banking, insurance and other financial clerks (-56%). These occupations also experienced rapid aging from 1996 to 2016, with three- to four-fold increases in the proportions of workers aged 55 and over.
Conclusion
To understand a well-functioning labour force, it is essential to know about the pattern and pace of aging within occupations, and about which occupations face problems of declining size and renewal. This study used Census of Population and Labour Force Survey data on comparable occupations with at least 10,000 workers to examine their changing age compositions during the two decades after 1996.
The ratio of younger workers (aged 25 to 34) to older workers (aged 55 and over) has fallen during the past 20 years. Overall, there are currently about the same number of younger and older workers. Some occupations, however, have renewal ratios below 1.0 (such as most managers, physicians and university professors). This is because the skills and experience required for these positions may better fit an older demographic. Nevertheless, the share of older workers has increased for almost all occupations.
Additionally, it may be difficult for certain occupations to attract younger workers because of structural changes such as automation and globalization. These occupations are typically decreasing in absolute numbers and characterized by a larger share of workers aged 55 and over. This trend can also be seen in the nature of the occupations that have declined in size the most since 1996, including data entry clerks and occupations involved with clothing manufacturing. However, the share of older workers in other still-common occupations has increased substantially, which may signal future employment opportunities for those willing to join these occupations.
In contrast, some occupations have had a greater degree of replacement by younger workers, even among occupations that usually require a university degree. This helps to moderate the pace of aging. Among the fastest-growing occupations are those characterized by a smaller share of workers aged 55 and over, such as professional occupations in advertising, marketing and public relations; and computer and information systems managers. Furthermore, women often had a younger age profile than men, mitigating the impact of aging across many occupations.
Bertrand Ouellet-Léveillé is an analyst and Anne Milan is chief of analysis in the Labour Statistics Division at Statistics Canada.
Start of text box 1
Data sources
The Census of Population, conducted every five years, gathers demographic, social, economic and cultural information on the Canadian population. Most households are asked to provide basic information only, while the remainder provide more detailed information, including their labour market activities during the week prior to enumeration and in the previous year. In this study, Census of Population data from 1996 and 2016 are used to examine occupations with at least 10,000 employed individuals aged 15 and over for both census years. According to the 2016 Census, occupations with at least 10,000 workers aged 15 years and over in 2016 represented 14.6 million workers across more than 270 occupations, out of a total of 17.2 million workers.
The Labour Force Survey (LFS) is a monthly survey of about 54,000 households. The LFS sample is representative of the civilian non-institutionalized population aged 15 and over. It gathers information on the labour force status of those surveyed, as well as detailed information on the nature of the main occupation of those employed. In this study, LFS data from 1996 to 2018 are used to compute the renewal ratio and draw comparisons over time.
The employed population refers to people aged 15 and over who were paid workers, self-employed, or unpaid family workers during the week preceding the census. Paid workers earned a wage, salary, tips or commissions, or were paid in kind. The self-employed worked for profit in their own business, farm or professional practice, while unpaid family workers worked without pay in a family farm or business. Also included are people who were temporarily absent from their job or business, with or without pay, for the entire week because of vacation, illness, a labour dispute, maternity leave, family responsibilities or some other reason. Institutional residents living in collective dwellings, such as nursing homes and penal institutions, are excluded from the workforce. Unpaid household activities, unpaid child and elder care, and volunteer work are excluded from the definition of work.
The North American Industry Classification System (NAICS) 2012 is an industry classification system. Industry, or industrial sector, refers to a generally homogeneous group of economic producing units primarily engaged in a specific set of activities. An activity is a particular method of combining goods and services inputs, labour and capital to produce one or more goods and/or services (products). In most cases, the activities that define an industry are homogeneous with respect to the production processes used.
The National Occupational Classification (NOC) is the nationally accepted taxonomy and organizational framework of occupations in the Canadian labour market. This study uses the four-digit NOC for comparable occupations in 1996 and 2016.
Prevalent occupations in 2016 that had no direct match in 1996
Some prevalent occupations in 2016 had no direct equivalent in 1996. These occupations sometimes related to computer and information systems and reflect the growing importance of workers in a knowledge economy. Information systems analysts and consultants, computer programmers and interactive media developers, and computer network technicians were the three most common occupations in this group, representing a total of nearly 325,000 people. These also tended to be occupations with younger workers and relatively small shares of workers aged 55 and over (between 9% and 16%).
In contrast, some occupations that were common in 1996 did not have an equivalent in 2016, which was often the result of changes or mergers in occupational classifications. For example, food service counter attendants were amalgamated with food preparers and kitchen and food service helpers to create a new occupational category called food counter attendants, kitchen helpers and related support occupations. In total, these workers represented 358,000 people in 2016, making it the third most prevalent occupation. It comprised relatively young workers, with 11% of workers aged 55 and over.
Similarly, receptionists and switchboard operators were amalgamated with telephone operators to create a new classification of receptionists in 2016, an occupation for which 22% of the 145,000 workers, primarily women, were aged 55 and over in 2016.
Security guards and related security service occupations was another common occupation in 2016, with about 110,000 workers, resulting from a merger. It was also among the occupations with the highest proportion of older workers—almost 30% of workers were aged 55 and over.
End of text box 1
Start of text box 2
At 2.3 million workers in 2016, health care and social assistance was the largest industry in Canada, accounting for 13% of all workers. From 1996 to 2016, the number of workers grew by 68%, placing it among the most rapid growth rates by industry. In other words, the aging population is being cared for by an increasing number of workers—but workers who are themselves growing older.
With more than 286,000 workers in 2016, the most common health-related occupation—registered nurses and registered psychiatric nurses—grew by 26% from 1996 to 2016 (Table 9). Over the same period, the second most common health occupation—nurse aides, orderlies and patient service associates—more than doubled in size (+109%) to 245,500 workers. Other occupations with rapid growth included dental hygienists and dental therapists (+136%), specialist physicians (+108%), physiotherapists (+89%) and pharmacists (+79%).
| 1996 | 2016 | |||
|---|---|---|---|---|
| Workers | Proportion of workers aged 55 and over | Workers | Proportion of workers aged 55 and over | |
| number | percent | number | percent | |
| Occupation | ||||
| Specialist physicians | 21,400 | 22.8 | 44,500 | 30.8 |
| Dentists | 15,700 | 15.1 | 21,400 | 29.6 |
| General practitioners and family physicians | 37,400 | 19.8 | 56,300 | 28.9 |
| Nursing co-ordinators and supervisors | 13,800 | 14.0 | 15,700 | 25.5 |
| Nurse aides, orderlies and patient service associates | 117,500 | 11.3 | 245,500 | 23.1 |
| Medical laboratory technologists | 17,600 | 4.9 | 19,800 | 21.4 |
| Other assisting occupations in support of health servicesTable 9 Note 2 | 19,000 | 6.4 | 33,500 | 20.8 |
| Registered nurses and registered psychiatric nurses | 226,600 | 9.4 | 286,200 | 19.8 |
| Pharmacists | 20,300 | 11.3 | 36,300 | 17.1 |
| Medical laboratory technicians and pathologists' assistants | 20,500 | 6.7 | 22,000 | 17.0 |
| Licensed practical nurses | 38,800 | 8.2 | 69,600 | 16.1 |
| Medical radiation technologists | 13,100 | 5.3 | 19,400 | 15.6 |
| Physiotherapists | 12,800 | 6.2 | 24,100 | 13.8 |
| Other technical occupations in therapy and assessmentTable 9 Note 3 | 10,700 | 6.0 | 10,900 | 13.3 |
| Dental assistants | 21,100 | 2.5 | 32,500 | 11.2 |
| Dental hygienists and dental therapists | 11,100 | 1.0 | 26,100 | 11.0 |
| Paramedical occupations | 13,200 | 3.9 | 26,800 | 9.9 |
|
||||
The occupations with the largest shares of workers aged 55 and over in 2016 were specialist physicians (31%), dentists (30%), general practitioners and family physicians (29%), and nursing co-ordinators and supervisors (26%). In contrast, health occupations with smaller shares of older workers included paramedical occupations (10%), dental assistants (11%), and dental hygienists and dental therapists (11%).
End of text box 2
- Date modified: