
Insights on Canadian Society
Workers looking for a new job

Archived Content
Information identified as archived is provided for reference, research or recordkeeping purposes. It is not subject to the Government of Canada Web Standards and has not been altered or updated since it was archived. Please "contact us" to request a format other than those available.

Skip to text
Text begins
Start of text boxOverview of the study
This study uses data from the Longitudinal and International Study of Adults (LISA) to provide information on individuals looking for work even if they are already employed. The study examines the reasons why workers want to look for a new job. The paper also explores the links between looking for a job while employed, the characteristics of workers seeking a new job and their level of job satisfaction.
- In 2014, 12% of paid workers reported that they had looked for a new job in the four weeks preceding the survey. This proportion has been on the rise since the mid-1990s, when it was around 5%.
- Workers looking for a new job are younger and more educated, and have higher literacy and numeracy scores than workers who are not looking for a new job. In addition, almost one-third of them had a different job two years earlier, compared with 18% of other workers.
- Workers who looked for another job estimated the probability of losing their current job in the next year at about 1 in 5 (19%), compared with 10% for other workers. In contrast, they were more optimistic than the rest of workers about their chances of finding a job that was at least as good as their current job.
- On average, the desired wage among workers who are looking for a new job was 23% higher than the wage earned in their current job.
- Among workers dissatisfied with their current job, the probability of looking for a new job was more than 40% for both men and women, even after taking other factors associated with the job search into account. The same probability was 6% among those who were satisfied or very satisfied with their job.
End of text box
Introduction
Workers may want to change jobs for any number of reasons, which are not always related to poor working conditions. The criteria used to determine what defines a “better job” differs from one person to another, and evolves through different stages of life. For young parents, for example, their job search could be largely motivated by the need to find a job that favours a work–life balance. For people approaching retirement age, a job search may be more closely related to a need for financial security or personal fulfillment.
Many job changes occur without any unemployment spells between the two periods of employment. This type of transition represents the majority of the job changes recorded over the course of a yearNote 1 and is the main source of gains in employment earnings during ones’ career.Note 2 In many cases, the job search begins weeks or months before the job change occurs, giving job seekers an opportunity to acquire valuable information about labour market conditions. Workers looking for a new job are thus in a better position to take advantage of opportunities than those who did not look for work while employed, and post a larger gain in earnings after changing jobs.Note 3 However, the gain in earnings varies depending on the reasons for the job change.Note 4
In comparison with unemployed people who have similar skill levels and who are looking for a job with the same level of intensity, workers looking for a job are more likely to be contacted by an employerNote 5 and receive a higher number of job offers.Note 6 They also may be more successful in securing job offers with better working conditions (wages, hours, benefits) than unemployed people with similar characteristics and skills.Note 7
This article provides information on the number of workers looking for work in Canada and examines the reasons why these workers want to leave their job. It also explores the different links that exist between looking for a job while employed, the characteristics of job seekers and their level of job satisfaction. More particularly, the study answers the following questions:
- How many workers are looking for a new job? How do they differ from other workers and the unemployed?
- What are the reasons given by workers for looking for a new job, and at what wage level would they agree to change jobs?
- What are the factors associated with job search among employed people, including the degree of satisfaction with the current job?
This study uses data from the Longitudinal and International Study of Adults (LISA) to answer these questions. Currently, LISA is the only source of data that includes information on job search activities and the reservation wage for both the unemployed and those looking for a new job.
In 2014, 12% of workers reported that they had looked for a new job in the four weeks preceding the survey
From 1976 to 1995, information on looking for a job while employed was collected using the Labour Force Survey (LFS). With LISA, this information is again collected by Statistics Canada, following the introduction in 2014 of a module of questions based on the job search activities of both employed and unemployed persons (see the Data sources, methods and definitions section).
According to LFS and LISA data, on-the-job search has been on the rise over the last 40 years. According to a previous study,Note 8 the proportion of paid workers looking for work more than doubled from 1976 to 1995 in Canada, as it increased from 2% to 5% during this period. Over the same period, similar trends were also observed in the United Kingdom.Note 9 About 20 years later, in 2014, this proportion increased to 12% of paid workers.Note 10 There were nearly two workers looking for work for every unemployed person in Canada in 2014.
One factor that may explain the increase in the proportion of workers who are looking for a new job is the decrease in costs associated with looking for work.Note 11 The rapid increase in information and communications technologies, in particular, may explain the cheaper cost of looking for work.
In addition, given the growing pool of educated workers and the role played by skills in today's labour market, another possibility is that more workers are trying to take advantage of better employment opportunities.
Workers looking for a new job are more likely to be in the early stages of their career
Empirical studies on job stability indicate that workers can expect to make a dozen job changes over the course of their career, and that the majority of them (about two-thirds) will occur in the first 10 years after entering the labour market. These numerous job transitions may result in a better match between the position and the employee and promote faster earnings growth.Note 12
Workers looking for a job were proportionately younger than other workers, but older than those who were unemployed. About 22% of workers looking for a new job were aged 18 to 24 in 2014, compared with 11% of other workers and 32% of the unemployed (Table 1).
| Paid workers looking for a new job | Paid workers not looking for a new job | Unemployed persons | |
|---|---|---|---|
| percent | |||
| Sex | 100.0 | 100.0 | 100.0 |
| Men | 51.5 | 50.2 | 54.7 |
| Women | 48.5 | 49.8 | 45.3 |
| Couple with or without children | 100.0 | 100.0 | 100.0 |
| Yes | 56.0 | 67.7Note ** | 39.1Note ** |
| No | 44.0 | 32.3Note ** | 60.9Note ** |
| Age group | 100.0 | 100.0 | 100.0 |
| 18 to 24 | 21.6 | 11.2Note ** | 32.1Note * |
| 25 to 34 | 33.2 | 22.3Note ** | 17.6Note ** |
| 35 to 54 | 40.5 | 47.9Note ** | 33.4 |
| 55 and over | 4.7 | 18.6Note ** | 16.9Note ** |
| Highest level of education | 100.0 | 100.0 | 100.0 |
| High school or less | 28.6 | 31.5 | 51.6Note ** |
| Postsecondary certificate or diploma below the bachelor levelTable 1 Note 2 | 28.2 | 33.1 | 31.0 |
| Postsecondary certificate or diploma equal to or above the bachelor level | 43.1 | 35.4Note * | 17.4Note ** |
| Literacy proficiency level | 100.0 | 100.0 | 100.0 |
| Low level of literacy (levels 0 to 2) | 31.1 | 42.9Note ** | 52.3Note ** |
| High level of literacy (levels 3 to 5) | 68.9 | 57.1Note ** | 47.7Note ** |
| Numeracy proficiency level | 100.0 | 100.0 | 100.0 |
| Low level of numeracy (levels 0 to 2) | 42.8 | 48.6 | 60.1Note * |
| High level of numeracy (levels 3 to 5) | 57.2 | 51.4 | 39.9Note * |
| Problem-solving proficiency level | 100.0 | 100.0 | 100.0 |
| Low level of problem-solving skills (levels 0 and 1) | 37.3 | 52.7Note ** | 57.5Note ** |
| High level of problem-solving skills (levels 2 and 3) | 62.7 | 47.3Note ** | 42.5Note ** |
| Labour force activity in 2012 | 100.0 | 100.0 | 100.0 |
| Employed | 79.5 | 86.3Note * | 53.6Note ** |
| Unemployed or not in the labour force | 14.8 | 7.6Note ** | 37.1Note ** |
| Unknown | 5.7 | 6.1 | 9.3 |
| Worked for the same employer in 2012 and 2014Table 1 Note 3 | 100.0 | 100.0 | Note ...: not applicable |
| Yes | 67.9 | 82.2Note ** | Note ...: not applicable |
| No | 32.1 | 17.8Note ** | Note ...: not applicable |
| number of years | |||
| Number of years of seniority in the current jobTable 1 Note 4 | 7.4 | 12.2Note ** | Note ...: not applicable |
... not applicable
|
|||
However, on-the-job search is not limited to younger workers: nearly one-half of employed people who are looking for a job were aged 35 or over. At later stages of one’s career, finding a new job may not necessarily be motivated exclusively by earnings and benefits, but also by other aspects of the job. According to previous studies, older workers are more likely to value job stability, interpersonal relationships at work and the nature of work than younger workers.Note 13
Workers looking for a new job were more educated than workers who had not looked for a new job as well as the unemployed, and they had higher literacy, numeracy and problem-solving scores. Moreover, about 43% had a postsecondary degree equal to or above the bachelor level, compared with 35% of workers not looking for a new job and 17% of the unemployed.
The longitudinal properties of LISA were used to examine the employment status of job seekers two years before the study, in 2012. The results show that workers who were looking for a new job in 2014 were nearly twice as likely to be unemployed or out of the labour force in 2012 (15%) as those who were not looking for work (8%). Compared with the unemployed population, however, they were less likely to be out of work two years earlier.
Among job seekers who were employed in both 2012 and 2014, close to one-third had a different employer in 2012, compared with 18% of those who were not looking for work in 2014.Note 14 They also had fewer years of job tenure at their current job than workers who had not looked for another job. This was the case even when the sample was restricted to those who had not changed employers during this period (7 years versus 12 years). Such results suggest that workers looking for a new job are characterized by a high level of mobility in the labour market.
Workers looking for a new job are more likely to have a job with less favourable working conditions
Working conditions are often linked to the workers’ decision to seek a new job. Workers who were looking for a new job in 2014 were less likely than other workers to have a full-time or permanent job, to be covered by a collective agreement, or to participate in a pension plan that was partially or fully financed by their employer (Table 2).
| Paid workers looking for a new job | Paid workers not looking for a new job | |
|---|---|---|
| percent | ||
| Job conditions | ||
| Employed full timeTable 2 Note 2 | 74.8 | 83.7Note ** |
| Permanent job | 71.1 | 77.9Note ** |
| Protected by a collective agreement or an employment contract | 25.8 | 33.9Note ** |
| Participates in a pension plan offered by the employer | 45.4 | 52.9Note * |
| Variation in employment requirements in the previous two years | ||
| Increased level of complexity | 53.9 | 44.1Note ** |
| Increased level of responsibility | 59.9 | 51.7Note ** |
| Increased work pace | 53.4 | 46.6Note * |
| Higher compensation | 48.3 | 58.3Note ** |
| Increase in the level of complexity, level of responsibility and pace of work | 39.6 | 30.9Note ** |
| percentage distribution | ||
| Occupational categories | 100.0 | 100.0 |
| Managers | 6.6 | 7.3 |
| Professional staff | 27.0 | 22.0 |
| Technical staff and supervisors | 30.2 | 33.9 |
| Support staff | 36.1 | 36.7 |
| Job-education match | 100.0 | 100.0 |
| Worker's level of education is below the level requested | 12.5 | 15.2 |
| Worker's level of education is equal to the level requested | 54.2 | 58.4 |
| Worker's level of education is above the level requested | 33.3 | 26.5Note * |
| average hours | ||
| Average number of hours usually worked | 33.8 | 36.0Note ** |
|
||
Workers seeking new jobs were also more likely to have seen their job responsibilities, complexity, or pace of work increase over the previous two years. For example, 60% of those looking for a job reported that their level of responsibility increased in the previous two years, compared with 52% of workers who had not looked for work. On the other hand, they were relatively less likely to have received a wage increase in the previous two years;Note 15 48% of them saw their earnings increase during this period, compared with 58% of workers who were not looking for work.
Workers looking for a job earned less than other workers. In 2014, they earned, on average, $23.57 per hour compared with $26.27 per hour for workers who had not looked for work in the previous month (Table 3). The wage gap was more pronounced for men (14%), people under 35 (11%) and those with a high school diploma or less (15%) or a diploma equal to or above the bachelor level (14%).
| Paid workers looking for a new job | Paid workers not looking for a new job | Wage gap | |
|---|---|---|---|
| dollars | percent | ||
| All paid workers | 23.57 | 26.27Note ** | 10 |
| Sex | |||
| Men | 24.92 | 28.94Note ** | 14 |
| Women | 22.14 | 23.59 | 6 |
| Age group | |||
| 18 to 24 | 13.78 | 15.41Note * | 11 |
| 25 to 34 | 21.68 | 24.26Note * | 11 |
| 35 to 54 | 30.06 | 29.44 | -2 |
| 55 and over | 25.82 | 27.11 | 5 |
| Highest level of education | |||
| High school or less | 16.31 | 19.25Note ** | 15 |
| Postsecondary certificate or diploma below the bachelor levelTable 3 Note 2 | 22.72 | 25.34Note * | 10 |
| Postsecondary certificate or diploma equal to or above the bachelor level | 28.94 | 33.46Note ** | 14 |
| Number of years of seniority in the current job | |||
| Less than 2 years | 18.96 | 20.41 | 7 |
| 2 to 5 years | 23.61 | 24.24 | 3 |
| 6 to 8 years | 25.53 | 27.85 | 8 |
| More than 8 years | 31.14 | 30.19 | -3 |
|
|||
This wage disadvantage, however, was less pronounced in older age groups,Note 16 which is not surprising given that job-education mismatches are more common at the beginning of a career. Therefore, the impact of job changes on employment earnings is expected to be larger in the earlier years after labour market entry.Note 17
Workers cite several reasons for wanting a new job
Wanting a better paying job was the reason most often cited by workers looking for another job (51%), followed by wanting to find a job better suited to their qualifications and education (28%). The desire for better working conditions and dissatisfaction with their current job, which were both mentioned by 23% of respondents, ranked third among the reasons for looking for a new job (Chart 1).
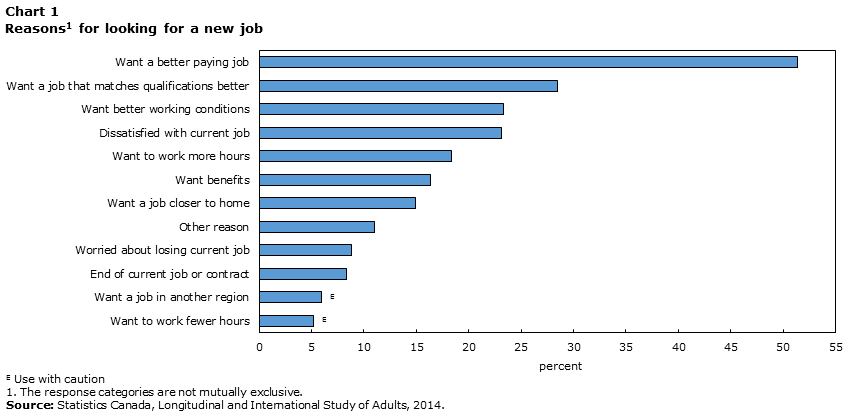
Data table for Chart 1
| Percent | |
|---|---|
| Want to work fewer hours | 5.2Note E: Use with caution |
| Want a job in another region | 6.0Note E: Use with caution |
| End of current job or contract | 8.3 |
| Worried about losing current job | 8.8 |
| Other reason | 11.0 |
| Want a job closer to home | 14.9 |
| Want benefits | 16.4 |
| Want to work more hours | 18.4 |
| Dissatisfied with current job | 23.1 |
| Want better working conditions | 23.3 |
| Want a job that matches qualifications better | 28.5 |
| Want a better paying job | 51.4 |
E use with caution
|
|
Regardless of the type of work contract (full time, part time, indeterminate, temporary), education and age of the individual, similar patterns emerged. However, there were some differences between groups. For example, job seekers who worked part-time or in temporary jobs were significantly more likely to report that they wanted to work longer hours than those who were employed full time or on an indeterminate basis. Among part-time workers, hours of work was the reason most frequently cited (53%), ahead of the desire for better pay (39%). Job seekers with a university degree were also more likely to look for a job that better matched their qualifications and educational background (37%) than those who did not have a degree (22%). No significant differences were observed between workers under 35 and those aged 35 and over.
Workers looking for a new job estimate having a 6 in 10 chance of finding a job as good as their current one
As part of LISA, workers were asked to describe, using percentages, how high they assessed their likelihood of leaving or losing their current job, as well as their chances of finding a job offering conditions that are at least as good as their current job. When asked about their job prospects in the following year (Chart 2), workers who had looked for a job estimated that their chances of losing their current job in the next year was about 1 in 5 (19%), almost double the rate reported by other workers (10%).
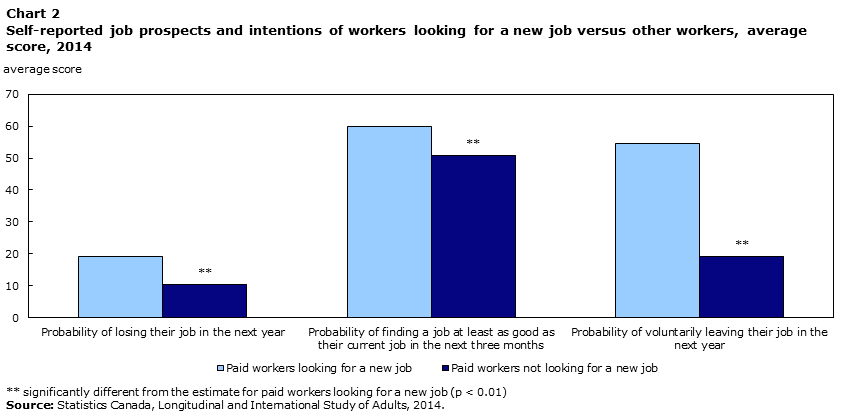
Data table for Chart 2
| Paid workers looking for a new job | Paid workers not looking for a new job | |
|---|---|---|
| average score | ||
| Probability of losing their job in the next year | 19.1 | 10.3Note ** |
| Probability of finding a job at least as good as their current job in the next three months | 60.0 | 50.8Note ** |
| Probability of voluntarily leaving their job in the next year | 54.5 | 19.1Note ** |
|
||
In contrast, workers who had looked for work were more optimistic than other workers about their chances of finding a job at least as good as their current job in the next three months. On average, they estimated having a 6 in 10 chance of finding such a job in the next three months, while the probability was estimated at 5 in 10 among other workers. The higher level of optimism seen among workers looking for a job was also associated with a higher probability of voluntarily leaving their current job in the following year (55% versus 19%).Note 18
These results suggest that, among workers looking for a new job, the chances of quitting their current job are not only related to a desire to find a better job, but are also linked to perceived (or actual) labour market opportunities.Note 19 This is consistent with the fact that job searches and voluntary departures increase in times of economic growth.Note 20
Workers looking for a new job want to earn 23% more than their current wage
The LISA questionnaire also collects information on the reservation wage from job seekers, including the unemployed. Job seekers were asked to report the lowest wage amount they would be willing to accept for a job with the desired characteristics.
On average, workers looking for a new job wanted to earn 23% more than their current wage (Table 4). Desired earnings ranged from 10% to 30% higher depending on sex, age or level of education; these differences, however, were not statistically significant.
| Average reservation wage | Ratio of the reservation wage to the current or previous wageTable 4 Note 1 Table 4 Note 2 | |||
|---|---|---|---|---|
| Paid workers looking for a new job | Unemployed persons | Paid workers looking for a new job | Unemployed persons | |
| dollars | ratio | |||
| Total employees | 28.04 | 18.32Note ** | 1.23 | 1.18 |
| Sex | ||||
| Men | 31.42 | 20.96Note ** | 1.30 | 1.21 |
| Women | 24.43 | 15.11Note ** | 1.15 | 1.14 |
| Age group | ||||
| 18 to 24 | 16.22 | 12.32Note ** | 1.13 | 1.28 |
| 25 to 34 | 27.58 | 20.22Note ** | 1.29 | 1.16 |
| 35 to 54 | 34.01 | 20.00Note ** | 1.22 | 1.21 |
| 55 and over | 35.03 | 24.60 | 1.27 | 1.07 |
| Highest level of education | ||||
| High school or less | 19.32 | 15.12Note * | 1.13 | 1.09 |
| Postsecondary certificate or diploma below the bachelor levelTable 4 Note 3 | 26.34 | 20.48Note * | 1.24 | 1.23 |
| Postsecondary certificate or diploma equal to or above the bachelor level | 34.97 | 23.96Note ** | 1.29 | 1.34 |
|
||||
Job seekers reported a higher reservation wage than the unemployed, regardless of sex, age or level of education. Having a job appears to go hand in hand with job seekers expecting higher earnings. In contrast, the unemployed seem more willing to accept lower wages given the urgency of finding a job.
However, when current earnings (or past earnings for the unemployed) are compared with the reservation wage, job seekers do not necessarily have higher wage expectations than the unemployed. Both groups of job seekers want to earn approximately 20% more per hour.
There is a strong link between job satisfaction and looking for a new job
Even though job satisfaction is undoubtedly linked to factors such as employment earnings, hours worked and employment benefits, it is also strongly correlated with other characteristics of the work environment such as workload, variety of tasks to be performed and level of support from the employer and colleagues.Note 21 Job satisfaction may also reflect people’s values, preferences and perceptions of their employment prospects.Note 22 Two people with similar jobs may have different levels of job satisfaction, for example if their career aspirations are not the same, or if they do not have the same perception vis-à-vis their chances of finding a better job.
Several related studies show that there is an important link between job satisfaction, the intention to quit a job and job turnover.Note 23 These studies show that job satisfaction plays a role in job turnover and suggest that job satisfaction is a good predictor of voluntary departures. A lower level of job satisfaction is also linked to lower work productivityNote 24 and a higher absentee rate,Note 25 and may represent a cost to the employer.
The LISA questionnaire collects information on satisfaction with the current job. Survey participants were asked to describe their level of overall job satisfaction using a scale from 0 to 10, with 10 being the highest level of satisfaction. For the purposes of this study, the scores were grouped into three levels of satisfaction: 1) Not very or not at all satisfied (score of 3 or less); 2) fairly satisfied (score of 4 to 6); and 3) satisfied or very satisfied (score of 7 or more).
As expected, workers looking for a new job have a lower level of job satisfaction than other workers (Chart 3). They were five times more likely to be “not very or not at all satisfied” with their job than those who took no steps to find a new job (20% versus 4%). Conversely, they were almost two times less likely as other workers to be “satisfied or very satisfied” with their job (40% versus 76%).
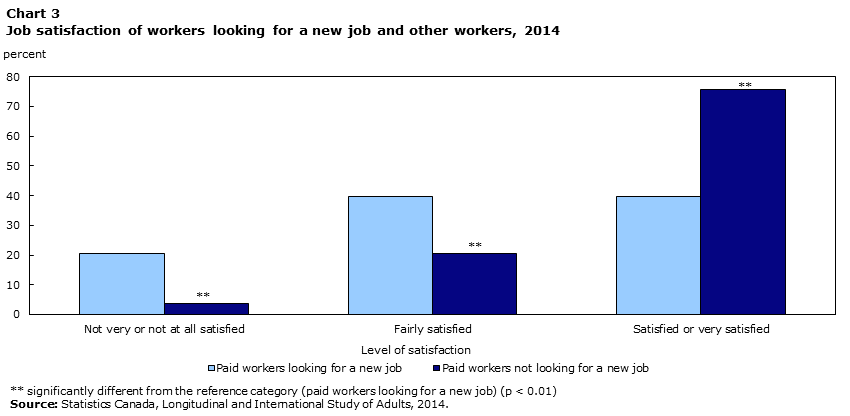
Data table for Chart 3
| Level of satisfaction | Paid workers looking for a new job | Paid workers not looking for a new job |
|---|---|---|
| percent | ||
| Not very or not at all satisfied | 20.4 | 3.8Note ** |
| Fairly satisfied | 39.7 | 20.6Note ** |
| Satisfied or very satisfied | 39.8 | 75.6Note ** |
|
||
Several factors are associated with looking for a new job among those who are employed
Previous studies have shown that job changes are more frequent at the beginning of a career. In addition, the age of workers is known to be correlated with a number of characteristics, including seniority, level of education and employment earnings. For example, young workers are less likely to have high employment earnings relative to older workers with the same level of education because the former have fewer years of experience on the labour market.
In this section, a multivariate analysis is used to examine the association between a number of personal characteristics and the probability to look for a new job. A logistic regression modelNote 26 was estimated for all workers. The dependent variable is 1 for job seekers, and 0 for workers who have not undertaken any job search activity in the previous four weeks. Three separate models were estimated: one for all workers, one for men only and one for women only. Each model takes several risk factors into account related to individual characteristics, employment characteristicsNote 27 and changes over the previous two years.
Age, seniority, level of educationNote 28 and level of job satisfaction all had a significant influence on the probability of looking for a job while employed (Table 5). The probability of looking for a job decreased with age,Note 29 seniority and level of job satisfaction, but increased with level of education. In terms of age, for example, the probability of a worker looking for a new job while employed was four times higher among workers aged 18 to 34 (12%) than among those aged 55 and over (3%), all else being equal.
| All | Men | Women | |
|---|---|---|---|
| predicted probability | |||
| Sex | |||
| Men | 10.0Note * | Note ...: not applicable | Note ...: not applicable |
| Women (ref.) | 8.0 | Note ...: not applicable | Note ...: not applicable |
| Age group | |||
| 18 to 34 (ref.) | 12.2 | 14.1 | 10.5 |
| 35 to 54 | 10.2 | 9.6Note * | 10.3 |
| 55 and over | 3.2Note ** | 2.9Note ** | 3.0Note ** |
| Family situation | |||
| Not in a relationship, no children under 18 in the household (ref.) | 9.7 | 7.1 | 11.3 |
| Not in a relationship, child(ren) under 18 in the household | 8.9 | 9.7 | 8.5 |
| Couple with no child(ren) under 18 in the household | 8.6 | 9.3 | 7.6Note * |
| Couple with child(ren) under 18 in the household | 9.0 | 9.9Table 5 Note † | 7.8Note * |
| Highest level of education | |||
| High school diploma or less (ref.) | 6.5 | 6.0 | 6.8 |
| Postsecondary certificate or diploma below bachelor levelTable 5 Note 1 | 9.1Note ** | 9.5Note ** | 8.0 |
| Postsecondary certificate or diploma equal to or above bachelor level | 11.4Note ** | 12.2Note ** | 10.4Note * |
| Job-education match | |||
| Worker's level of education is below the level requested | 9.7 | 7.9 | 10.9 |
| Worker's level of education is equal to the level requested (ref.) | 8.8 | 8.9 | 8.4 |
| Worker's level of education is above the level requested | 8.9 | 9.9 | 7.5 |
| Seniority in the current job | |||
| Less than 2 years (ref.) | 15.5 | 15.2 | 15.0 |
| 2 to 5 years | 12.1Note * | 10.8Table 5 Note † | 12.6 |
| 6 to 8 years | 8.4Note ** | 9.2Note * | 7.5Note ** |
| More than 8 years | 5.2Note ** | 5.6Note ** | 4.6Note ** |
| Employed full time | |||
| Yes | 8.3Note ** | 8.7Table 5 Note † | 7.5Note ** |
| No (ref.) | 13.1 | 12.5 | 12.7 |
| Permanent job | |||
| Yes | 8.8 | 9.2 | 8.0 |
| No (ref.) | 9.7 | 8.5 | 10.4 |
| Employer-provided pension plan | |||
| Yes | 10.2Note * | 10.6Table 5 Note † | 9.3 |
| No (ref.) | 7.7 | 7.3 | 7.7 |
| Job protected by a collective agreement | |||
| Yes | 7.5Note * | 6.7Note * | 8.1 |
| No (ref.) | 9.8 | 10.3 | 8.7 |
| Public service job | |||
| Yes | 8.4Note * | 10.8 | 10.5Table 5 Note † |
| No (ref.) | 10.9 | 8.6 | 7.6 |
| Hourly wage quintile | |||
| First ($13.26 or less) (ref.) | 10.9 | 13.7 | 8.8 |
| Second ($13.27 to $19.25) | 11.4 | 12.6 | 10.4 |
| Third ($19.26 to $25.25) | 9.7 | 8.8Note * | 9.9 |
| Fourth ($25.26 to $35.29) | 7.5Note * | 7.6Note ** | 7.0 |
| Last ($35.30 or more) | 6.8Note ** | 6.8Note ** | 6.3 |
| Occupational categories | |||
| Managers | 11.5Table 5 Note † | 7.4 | 19.3Note ** |
| Professional staff | 10.9Table 5 Note † | 12.0 | 9.2 |
| Technical staff and supervisors | 8.5 | 8.6 | 8.2 |
| Support staff (ref.) | 7.9 | 8.3 | 7.3 |
| Increase in the level of complexity in the past two years | |||
| Yes | 10.0Table 5 Note † | 10.6Table 5 Note † | 9.1 |
| No (ref.) | 8.1 | 7.8 | 8.0 |
| Increase in the level of responsibility in the past two years | |||
| Yes | 9.4 | 10.1 | 8.1 |
| No (ref.) | 8.5 | 7.8 | 8.9 |
| Increase in the pace of work in the past two years | |||
| Yes | 9.7 | 10.1 | 8.9 |
| No (ref.) | 8.4 | 8.1 | 8.1 |
| Increase in compensation in the past two years | |||
| Yes | 7.9Note ** | 7.5Note ** | 7.8 |
| No (ref.) | 10.8 | 11.9 | 9.5 |
| Level of flexibility at work | |||
| Little or no flexibility | 7.3Note ** | 7.6 | 6.9Note * |
| Moderate flexibility | 9.6 | 9.5 | 9.1 |
| A lot of flexibility (ref.) | 10.2 | 10.0 | 9.9 |
| Level of satisfaction at work | |||
| Not very or not at all satisfied | 42.5Note ** | 44.0Note ** | 42.7Note ** |
| Fairly satisfied | 20.0Note ** | 20.2Note ** | 19.7Note ** |
| Satisfied or very satisfied (ref.) | 5.8 | 5.8 | 5.3 |
... not applicable
Source: Statistics Canada, Longitudinal and International Study of Adults, 2014. |
|||
For most of the factors examined, results differed little between men and women. However, there were some differences related to marital status, type of occupation and employment earnings. For example, among women, those who were single and without children were more likely than those in a relationship to look for a new job while employed.
Unlike men, employment-related financial considerations did not appear to have a significant impact on women’s decision to look for a new job. Women were equally likely to undertake job search activities, regardless of whether they earned a high salary or received a salary increase in the previous two years. However, they were more likely to look for a new job if they held a management position (19%). For men, the type of occupation did not appear to have a significant impact on the probability of looking for a job.
Finally, even after taking earnings and other working conditions into account, the strong association between job satisfactionNote 30 and the probability of looking for a new job remained. The probability was over 40% for both men and women who were “not very or not at all satisfied” with their current job. This probability was 20% among “fairly satisfied” workers and 6% among “satisfied or very satisfied” workers.Note 31 This result is consistent with the fact that job satisfaction can be influenced by many other characteristics of the work environment, as well as work-related preferences and values.
Conclusion
Within the Canadian workforce, the prevalence of those who are looking for a new job even though they are already employed has increased in recent decades. In 2014, 12% of salaried workers in Canada reported that they were looking for a new job, compared with 5% in the mid-1990s. This upward trend may be the result of lower job search costs resulting from the rapid emergence of information and communication technologies (e.g., websites, social media, mobile devices) during this period.
Workers looking for a new job differ from other workers and even from the unemployed. They were proportionately younger and more educated than other workers and had better numeracy and literacy scores. They received, on average, a lower hourly wage, particularly among those under 35 and those with a high school diploma or less. They were also less satisfied with their job, more likely to have changed jobs in the previous two years and more optimistic about their chances of finding a job at least as good as their current job. In addition, they wanted to earn 23% more per hour than their current wage on average.
The importance of satisfaction as a precursor to workers voluntarily leaving their job is increasingly acknowledged by researchers. The level of satisfaction allows people’s preferences and perceptions to be taken into account, factors that are just as important as traditional well-being indicators such as earnings and other working conditions. While employment earnings continue to be a significant factor, especially among workers at the beginning of their career, the results of this study show that job satisfaction is a contributing factor in looking for a new job while employed. Even after taking differences in personal characteristics, earnings and other working conditions into account, the probability of a worker looking for a new job while employed was seven times higher for those who were “not very or not at all satisfied” with their job than among those who were “satisfied or very satisfied”.
Manon Langevin is an analyst with Statistics Canada’s Insights on Canadian Society group.
Start of text boxData sources, methods and definitions
Data sources
This study is based on data from the first (2012) and second wave (2014) of the Longitudinal and International Study of Adults (LISA). LISA is a longitudinal survey that collects information from the same individuals at each new survey wave. It includes detailed information on the themes of family, work, education, income and health.
Methods
The sample of workers looking for a new job includes anyone aged 18 and over, working for an employer and looking for work at any time during the four weeks preceding day of the survey. For the purposes of this study, self-employed and unpaid workers were excluded from the sample. The analytical sample consisted of 10,857 people, of which 715 were unemployed, 1,306 were looking for a job and 8,836 were workers who did not look for a new job.
The predicted probabilities were calculated from a logistic regression model and correspond to the marginal effects evaluated at the mean values of the model’s other explanatory variables.
The sampling variance was estimated from bootstrap weights.
Definitions
Proportion of workers looking for a new job
The proportion of workers looking for a new job is the number of workers looking for a job divided by the total number of employed persons aged 18 and over.
Workers looking for a new job in the Labour Force Survey
Between 1976 and 1995, the Labour Force Survey (LFS) collected information on job search activities for the employed population. However, the information collected was never included in the LFS public use data file.
The LISA question is sufficiently similar to the one included in the LFS to allow comparisons between the data from the two surveys. However, because of slightly different wording, it may have been interpreted differently by some respondents.
Question in the LFS:
In the past 4 weeks, have you looked for another job?
Question in LISA:
At any time in the last 4 weeks have you looked for a new job?
Test of literacy, numeracy and problem-solving skills in a technological environment
A skills test was conducted with some LISA participants. With respect to literacy and numeracy skills, scores below 276 (level 2 or below) were considered as having lower skills, while those at or above that score (level 3 or above) were considered as having higher skills. For problem-solving skills, the threshold was set at 291. These thresholds were determined based on those provided in the technical report of the Program for the International Assessment of Adult Competencies.Note 32
Job-education match
In this article, a self-reported measure of job-education match is used. In the LISA, respondents are asked to report the level of education required to qualify for their position. This level is then compared to the person’s highest level of education.
Variation in job requirements and compensation
In LISA, questions about the variation in employment requirements and compensation in the previous two years relate to the same employer. Given that some respondents began their employment during the reference period, the question was slightly different for this particular group. Instead of starting with “Compared with two years ago, ...”, the question these respondents were asked started with “Since you started working for this employer, ...”. For these respondents, the reference period is therefore shorter than two years.
Degree of flexibility at work
The indicator of flexibility at work groups the information provided into questions about the degree of freedom with respect to the order of the tasks, the method of work, the pace of work and the hours of work. The indicator takes the score given to each activity into account and takes the form of a categorical variable composed of three groups: little or no flexibility at work, moderate flexibility, a lot of flexibility.
End of text box
Start of text boxFactors associated with job satisfaction
Job satisfaction depends on many factors. It varies across factors often measured in surveys, such as compensation and benefits offered by the employer, but also across other factors that are more difficult to measure such as a sense of belonging and peer recognition. Furthermore, the level of satisfaction associated with a specific criterion may vary, depending on the values, preferences and perceptions of respondents.
In order to measure the association between job characteristics and job satisfaction, an ordered logit model was estimated. The size of the workplace was included as a control factor because it is known to be positively correlated with better working conditions. A separate model was estimated for women and men. The same satisfaction groupings as those used in the descriptive analysis were used. Predicted probabilities were based on the highest level of satisfaction, as either “satisfied or very satisfied” with the current job. With the exception of workplace size, the same explanatory variables were used both to explain looking for a job while employed and job satisfaction. The purpose of this exercise is to illustrate the magnitude of the correlation between job satisfaction and other variables in the model, such as salary and benefits, usually associated with higher levels of satisfaction.
The likelihood of being “satisfied or very satisfied” with the current job is influenced by the size of the workplace, the level of flexibility at work,Note 33 compensation, and the job-education match (Table 6). Among women, those in older age groups and those who benefited from a wage increase in the last two years had a higher probability of being “satisfied or very satisfied”, but satisfaction did not vary across wage levels. In contrast, wages play an important role for men. The difference in predicted probabilities between the first and last hourly wage quintiles was 15 percentage points for men. Men also seemed to experience greater satisfaction working in smaller workplaces. Few other explanatory variables were correlated with job satisfaction.Note 34
| All | Men | Women | |
|---|---|---|---|
| predicted probability | |||
| Sex | |||
| Men | 70.7 | Note ...: not applicable | Note ...: not applicable |
| Women (ref.) | 72.4 | Note ...: not applicable | Note ...: not applicable |
| Age group | |||
| 18 to 34 (ref.) | 70.4 | 73.1 | 67.6 |
| 35 to 54 | 71.0 | 70.0 | 72.2Note * |
| 55 and over | 75.2Note ** | 73.6 | 77.4Note ** |
| Size of the workplace | |||
| 1 to 10 employees (ref.) | 75.8 | 72.3 | 73.8 |
| 11 to 50 employees | 72.9 | 71.5Note * | 67.9 |
| 51 to 250 employees | 69.8Note ** | 68.6Note * | 67.9Note * |
| 251 to 1,000 employees | 70.5Note * | 61.2Note ** | 73.5 |
| More than 1,000 employees | 62.9Note ** | 61.2Note ** | 65.1Table 6 Note † |
| Job-education match | |||
| Worker's level of education is below the level requested | 73.2 | 74.8 | 71.8 |
| Worker's level of education is equal to the level requested (ref.) | 73.3 | 73.2 | 73.7 |
| Worker's level of education is above the level requested | 66.5Note ** | 66.6Note ** | 66.4Note ** |
| Employed full time | |||
| Yes | 72.4Note ** | 72.1 | 73.1Note ** |
| No (ref.) | 66.7 | 68.7 | 66.1 |
| Permanent job | |||
| Yes | 71.4 | 71.9 | 71.1 |
| No (ref.) | 72.2 | 71.3 | 73.3 |
| Employer-provided pension plan | |||
| Yes | 70.5 | 73.1 | 71.7 |
| No (ref.) | 70.5 | 70.1 | 71.5 |
| Job protected by a collective agreement | |||
| Yes | 73.0 | 72.8 | 73.4 |
| No (ref.) | 70.8 | 71.3 | 70.5 |
| Public service job | |||
| Yes | 75.0Note ** | 74.9Table 6 Note † | 75.2Note * |
| No (ref.) | 70.3 | 71.0 | 69.7 |
| Hourly wage quintile | |||
| First ($13.26 or less) (ref.) | 65.4 | 60.9 | 68.2 |
| Second ($13.27 to $19.25) | 69.6 | 69.4Table 6 Note † | 69.5 |
| Third ($19.26 to $25.25) | 71.5Note * | 70.1Note * | 73.0 |
| Fourth ($25.26 to $35.29) | 73.7Note ** | 75.0Note ** | 72.1 |
| Last ($35.30 or more) | 75.5Note ** | 75.9Note ** | 75.8Note * |
| Occupational categories | |||
| Managers | 76.9 | 76.7 | 77.6 |
| Professional staff | 71.8 | 73.5 | 70.5 |
| Technical staff and supervisors | 71.0 | 70.0 | 72.4 |
| Support staff (ref.) | 70.7 | 71.1 | 70.7 |
| Increase in the level of complexity in the past two years | |||
| Yes | 68.4Note ** | 67.9Note ** | 69.4 |
| No (ref.) | 74.1 | 74.9 | 73.3 |
| Increase in the level of responsibility in the past two years | |||
| Yes | 72.4 | 73.1 | 71.2 |
| No (ref.) | 70.6 | 70.1 | 68.9 |
| Increase in the pace of work in the past two years | |||
| Yes | 70.2 | 71.6 | 68.9Note * |
| No (ref.) | 72.7 | 71.9 | 74.0 |
| Increase in compensation in the past two years | |||
| Yes | 74.7Note ** | 74.9Note ** | 74.7Note ** |
| No (ref.) | 66.9 | 66.5 | 67.4 |
| Level of flexibility at work | |||
| Little or no flexibility | 66.3Note ** | 67.7Note ** | 65.1Note ** |
| Moderate flexibility | 72.1Note ** | 71.7Note * | 72.8Table 6 Note † |
| A lot of flexibility (ref.) | 76.0 | 75.6 | 76.7 |
... not applicable
Source: Statistics Canada, Longitudinal and International Study of Adults, 2014. |
|||
End of text box
- Date modified: