
Corporate profitability and inflation: 2017 to 2022
Skip to text
Text begins
Acknowledgements
The authors would like to thank Xin Ha, Lydia Couture, Dragos Ifrim, Daanish Garda, Guy Gellatly, Chris Li, Léa-Maude Longpré-Verret and Charles Andrew Barclay for their helpful comments.
Abstract
In 2022, inflation in Canada reached rates not seen since the 1980s with prices paid by Canadian consumers rising 6.8%.Note Note Supply chain disruptions since the onset of the pandemic and ensuing growth in commodity prices manifested in pressures on economy-wide price levels once demand levels recovered in early 2021. In this economic environment, how are Canadian industries being affected? This paper looks at how profitability has evolved for key Canadian industries from 2017 to 2022. A specific focus is given to the post-lockdown period between the second quarters of 2021 and 2022, during which year-over-year inflation exceeded the Bank of Canada’s inflation-control target range ceiling of 3%. In addition to industry-wide trends, energy and food sectors are analyzed given their day-to-day relevance for Canadians.
The key finding of this paper is that energy and mining industries recorded the greatest increases in margins from the second quarter of 2021 to 2022. Most other industries recorded lower margins over the same period, including alcohol, tobacco and cannabis product manufacturing; and agriculture, forestry, fishing and hunting. A complex range of factors, such as supply and demand fluctuations and subsequent uncertainties around price levels, continue to impact markets.
Introduction
This paper analyzes profitability in Canadian non-financial industries from 2017 to 2022 to make an empirical contribution to ongoing discussions on profit levels in the inflationary environment.Note The selected timeframe allows to track profit levels before the Covid-19 pandemic, how they were impacted during the initial period of the pandemic, and how they have evolved since recovery to pre-pandemic levels once lockdowns came to an end.
The measures used are net income or loss levels, net profit margin and the cost ratio derived from the Quarterly Survey of Financial Statements (QSFS).Note Note Net profit margin is the key profitability measure analyzed - also referred to as net income margin. Margins are more comparable than net income or loss levels, which report the monetary difference between operating and non-operating revenues and costs, less taxes and including income from equity in unconsolidated affiliates. Revenues, costs and net income or loss levels can vary greatly across industries due to differences in the nature of their economic activities. They can also vary within an industry over time due to evolving economic conditions. In contrast, margins report net income or loss levels as a percentage of revenues, which is comparable across industries and within an industry over time.
Similarly, the cost ratio highlights how well an industry manages its expenses relative to its total revenues. A lower cost ratio is beneficial as it implies that costs constitute a smaller proportion of revenues. This may be a result of efficiency in business operations. Alternatively, if costs remain constant while higher prices lead to increased revenues, those costs make up a smaller proportion of the higher revenues, which also lowers the cost ratio.
As unprecedented increases in price levels impact business revenues, expenses and net income levels, accounting for the inflationary context is crucial to understand the evolution in profit levels in the recent period. To address the changes in price levels, profitability is analyzed alongside price and volume indexes based on the Gross Domestic Product (GDP).Note The price index reflects the fluctuations of price levels of the total goods and services produced in the economy. The volume index reflects the fluctuations of the total volume of output of the economy. Comparing these indexes reveals the share of the total economic output, as measured by GDP, attributable to price growth and to volume growth. In an inflationary context, this comparison helps measure real economic growth.
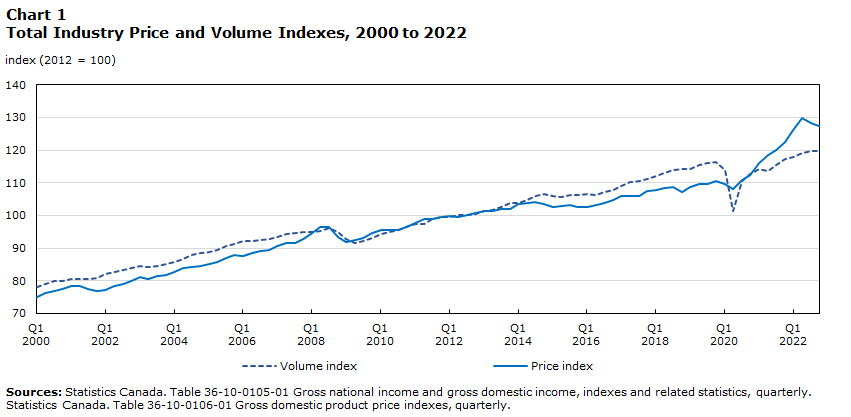
In the context of relatively stable and low levels of inflation since the early 2000s, GDP reflected a more balanced price and volume growth (Chart 1). In the early months of the pandemic, economic output in Canada declined due to pandemic-related measures such as lockdowns. Hence, the GDP volume index declined. Over the same period, price levels were not significantly impacted. The GDP price index recovered to its pre-pandemic level, which is defined as the fourth quarter of 2019, by the third quarter of 2020. The volume index recovered at a slower pace and only reached its pre-pandemic level by the fourth quarter of 2021. Since their respective recoveries to pre-pandemic levels, the price index grew by 15%, compared to the volume index growth of 2% by the fourth quarter of 2022.
Chart 1 start
Data table for Chart 1
| Real gross domestic product, volume index (Table 36-10-0105-01) | Gross domestic product at market prices (Table 36-10-0106-01) | |
|---|---|---|
| index (2012 = 100) | ||
| 2000 | ||
| Q1 | 78.1 | 75.0 |
| Q2 | 79.0 | 76.2 |
| Q3 | 79.8 | 76.9 |
| Q4 | 80.0 | 77.5 |
| 2001 | ||
| Q1 | 80.4 | 78.3 |
| Q2 | 80.6 | 78.3 |
| Q3 | 80.5 | 77.4 |
| Q4 | 81.0 | 76.8 |
| 2002 | ||
| Q1 | 82.2 | 77.1 |
| Q2 | 82.7 | 78.5 |
| Q3 | 83.4 | 79.0 |
| Q4 | 83.9 | 80.0 |
| 2003 | ||
| Q1 | 84.4 | 81.1 |
| Q2 | 84.2 | 80.4 |
| Q3 | 84.5 | 81.4 |
| Q4 | 85.1 | 81.8 |
| 2004 | ||
| Q1 | 85.7 | 82.7 |
| Q2 | 86.8 | 83.8 |
| Q3 | 87.8 | 84.3 |
| Q4 | 88.4 | 84.6 |
| 2005 | ||
| Q1 | 88.7 | 85.1 |
| Q2 | 89.4 | 85.7 |
| Q3 | 90.5 | 86.9 |
| Q4 | 91.3 | 88.0 |
| 2006 | ||
| Q1 | 92.1 | 87.7 |
| Q2 | 92.1 | 88.6 |
| Q3 | 92.4 | 89.1 |
| Q4 | 92.8 | 89.4 |
| 2007 | ||
| Q1 | 93.4 | 90.7 |
| Q2 | 94.3 | 91.5 |
| Q3 | 94.7 | 91.5 |
| Q4 | 94.8 | 92.7 |
| 2008 | ||
| Q1 | 94.8 | 94.5 |
| Q2 | 95.2 | 96.5 |
| Q3 | 96.0 | 96.6 |
| Q4 | 94.8 | 93.4 |
| 2009 | ||
| Q1 | 92.7 | 91.9 |
| Q2 | 91.7 | 92.4 |
| Q3 | 92.1 | 93.2 |
| Q4 | 93.2 | 94.7 |
| 2010 | ||
| Q1 | 94.3 | 95.4 |
| Q2 | 94.8 | 95.4 |
| Q3 | 95.5 | 95.5 |
| Q4 | 96.5 | 96.5 |
| 2011 | ||
| Q1 | 97.3 | 97.8 |
| Q2 | 97.5 | 98.8 |
| Q3 | 98.8 | 98.9 |
| Q4 | 99.6 | 99.6 |
| 2012 | ||
| Q1 | 99.6 | 99.7 |
| Q2 | 100.0 | 99.6 |
| Q3 | 100.1 | 100.1 |
| Q4 | 100.3 | 100.6 |
| 2013 | ||
| Q1 | 101.2 | 101.5 |
| Q2 | 101.8 | 101.4 |
| Q3 | 102.6 | 102.0 |
| Q4 | 103.7 | 102.0 |
| 2014 | ||
| Q1 | 103.9 | 103.5 |
| Q2 | 104.8 | 103.8 |
| Q3 | 105.8 | 104.1 |
| Q4 | 106.6 | 103.4 |
| 2015 | ||
| Q1 | 106.0 | 102.5 |
| Q2 | 105.7 | 102.8 |
| Q3 | 106.1 | 103.3 |
| Q4 | 106.1 | 102.7 |
| 2016 | ||
| Q1 | 106.7 | 102.5 |
| Q2 | 106.2 | 103.2 |
| Q3 | 107.3 | 103.8 |
| Q4 | 107.9 | 104.8 |
| 2017 | ||
| Q1 | 109.1 | 105.8 |
| Q2 | 110.2 | 105.8 |
| Q3 | 110.6 | 105.9 |
| Q4 | 111.2 | 107.4 |
| 2018 | ||
| Q1 | 112.2 | 107.7 |
| Q2 | 113.1 | 108.4 |
| Q3 | 113.8 | 108.6 |
| Q4 | 114.2 | 107.2 |
| 2019 | ||
| Q1 | 114.3 | 108.6 |
| Q2 | 115.4 | 109.6 |
| Q3 | 115.9 | 109.7 |
| Q4 | 116.3 | 110.6 |
| 2020 | ||
| Q1 | 113.8 | 109.5 |
| Q2 | 101.3 | 108.2 |
| Q3 | 110.5 | 110.9 |
| Q4 | 112.8 | 112.5 |
| 2021 | ||
| Q1 | 114.3 | 116.0 |
| Q2 | 113.6 | 118.6 |
| Q3 | 115.3 | 120.1 |
| Q4 | 117.2 | 122.4 |
| 2022 | ||
| Q1 | 118.0 | 126.0 |
| Q2 | 119.0 | 129.9 |
| Q3 | 119.7 | 128.3 |
| Q4 | 119.6 | 127.4 |
| Sources: Statistics Canada. Table 36-10-0105-01 Gross national income and gross domestic income, indexes and related statistics, quarterly. Statistics Canada. Table 36-10-0106-01 Gross domestic product price indexes, quarterly. | ||
Chart 1 end
The price index growth corresponds to higher inflation rates resulting from interlinked factors. In 2020, pandemic-related restrictions affected 85% of manufacturing plants in Canada.Note As well, global supply chain disruptions put pressure on commodity prices and overall price levels since the onset of the pandemic.Note Commodity prices, including energy and agriculture, dramatically rose since mid-2020, following declines at the onset of the pandemic.Note As pandemic-related effects eased, relief from supply chain pressures was partially offset by increased and strong consumer demand, keeping price levels up. Although supply chain pressures have declined from a peak in December 2021, reflected in declining commodity prices from peaks in early 2022, the lasting impacts of these price shocks are reflected in current inflation rates. This is evidenced by 46% of Canadian businesses expecting the rising cost of inputs to be an obstacle and 47% expecting to raise the prices of goods and services in the first quarter of 2023.Note
Inflation and the impacts of higher costs differ by industry and stages of the supply chain. As described, higher commodity prices and supply chain bottlenecks have increased costs for businesses. Specifically, energy-related costs are a crucial component of input costs across industries. Increased energy costs are consequently reflected in higher prices for producer and consumer goods and services. Rising input costs also affect profits. If an increase in input costs is passed on through an increase in prices to consumers, all else equal, revenues increase alongside costs and net income remains the same. This should result in a lower profit margin as the same net income makes up a smaller proportion of the revenues that have increased due to higher sale prices.
Industry-wide profitability rates recovered since the start of the pandemic
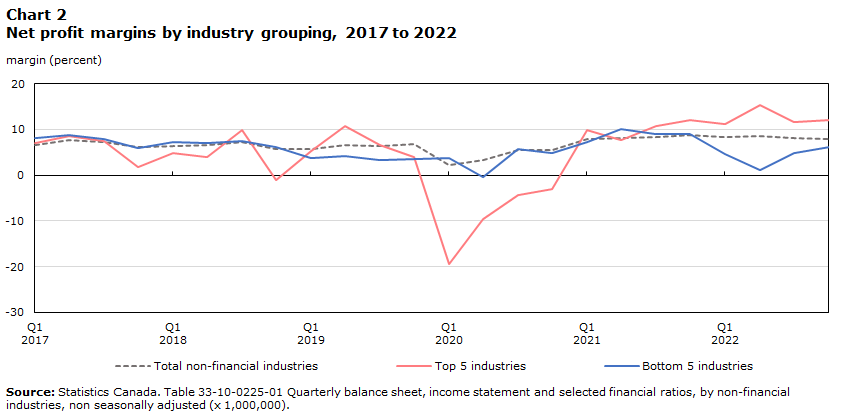
Chart 2 shows the evolution of the total non-financial industry net profit margins between the first quarter of 2017 and the fourth quarter of 2022. It compares total non-financial industry margins with the margins of industries that were most profitable and least profitable between the second quarters of 2021 and 2022.Note Grouping industries that saw substantial changes to their margins in the one year following the end of lockdowns allows tracking the evolution of profitability during the period which recorded the greatest increases in price levels. After a persistent rise in the year-over-year CPI since June 2021, beginning in July 2022, the year-over-year increases in the CPI have been equal to or smaller than preceding months.Note
Chart 2 start
Data table for Chart 2
| Top 5 industries | Bottom 5 industries | Total, non-financial industries | |
|---|---|---|---|
| margin (percent) | |||
| 2017 | |||
| Q1 | 7.1 | 8.2 | 6.6 |
| Q2 | 8.6 | 8.9 | 7.6 |
| Q3 | 7.5 | 7.9 | 7.3 |
| Q4 | 1.9 | 5.9 | 6.2 |
| 2018 | |||
| Q1 | 4.9 | 7.2 | 6.4 |
| Q2 | 4.1 | 7.1 | 6.7 |
| Q3 | 9.9 | 7.5 | 7.3 |
| Q4 | -1.0 | 6.2 | 5.7 |
| 2019 | |||
| Q1 | 5.4 | 3.8 | 5.7 |
| Q2 | 10.7 | 4.2 | 6.6 |
| Q3 | 6.7 | 3.3 | 6.3 |
| Q4 | 3.9 | 3.4 | 6.9 |
| 2020 | 0.0 | 0.0 | 0.0 |
| Q1 | -19.3 | 3.7 | 2.2 |
| Q2 | -9.6 | -0.4 | 3.3 |
| Q3 | -4.3 | 5.6 | 5.4 |
| Q4 | -3.1 | 4.9 | 5.6 |
| 2021 | |||
| Q1 | 10.0 | 7.3 | 7.8 |
| Q2 | 7.7 | 10.0 | 8.1 |
| Q3 | 10.8 | 8.9 | 8.4 |
| Q4 | 12.0 | 9.1 | 8.9 |
| 2022 | |||
| Q1 | 11.3 | 4.7 | 8.4 |
| Q2 | 15.3 | 1.0 | 8.6 |
| Q3 | 11.7 | 4.8 | 8.1 |
| Q4 | 12.1 | 6.2 | 7.9 |
| Source: Statistics Canada. Table 33-10-0225-01 Quarterly balance sheet, income statement and selected financial ratios, by non-financial industries, non seasonally adjusted (x 1,000,000). | |||
Chart 2 end
The most and least profitable industries between the second quarters of 2021 and 2022 are as follows.
Most profitable industries: Oil and gas extraction and support services; Mining and quarrying (except oil and gas) and support activities; Petroleum and coal product manufacturing; Transportation, postal and couriers’ services, and support activities for transportation; Pipelines.
Least profitable industries: Alcohol beverage, tobacco and cannabis product manufacturing; Agriculture, forestry, fishing and hunting; Publishing, motion picture and sound recording, broadcasting, and information services; Motor vehicle and trailer manufacturing; Basic chemical manufacturing and resin, synthetic rubber, and artificial and synthetic fibres and filaments manufacturing.
The total non-financial industry margin increased by 0.5 percentage points between the second quarters of 2021 and 2022, reflecting a 22% rise in net income. Over the same period, the average margin of the top 5 industries increased by 7.6 percentage points (+185.0% net income), while the average margin of the bottom 5 industries declined by 9.0 percentage points (-88.4% net income).
Total non-financial industry profitability faced a pandemic-related decline in 2020 and steadily recovered since. The pandemic-related decline during the first quarter of 2020 reflects a drop in net income (-70.4%) due to lower revenues (-7.0%) and a proportionally smaller decline in costs (-2.2%). Net income is highly sensitive to the difference between revenues and expenses. A positive or negative change in the difference between them can result in an amplified effect on the change in net income.
In contrast to the relatively steady total non-financial industry margin, the average margin for the top 5 industries faced variable periodic increases and decreases. Particularly, margins for the top 5 industries faced a sharp pandemic-related decline, followed by a strong acceleration in profit levels as economic activity ramped up. The average margin of the bottom 5 industries faced a smaller pandemic-related decline, followed by another decline in early 2022. During the third and fourth quarters of 2022, as price levels began to decline (Chart 1), margins of the most and least profitable industries in the preceding period began to converge towards the total non-financial industry average.
The industries that are most and least profitable vary over time. Three relevant time periods are analyzed are: pre-pandemic (first quarter of 2017 to the fourth quarter of 2019); the initial period of the pandemic including lockdowns (first quarter of 2020 to the first quarter of 2021); and post-lockdowns after the main economic effects of the pandemic eased (second quarter of 2021 to the second quarter of 2022).
The petroleum and coal product manufacturing industries were in the top 5 post-lockdown and pre-pandemic, whereas, agriculture, forestry, fishing and hunting were in the bottom 5 post-lockdown and pre-pandemic. Other sectors such as oil and gas extraction and mining and quarrying (except oil and gas) faced fluctuating profitability. They were in the top 5 during the early-pandemic and post-lockdown, while they were in the bottom 5 pre-pandemic. Likewise, the pharmaceutical, medicine, and other chemical product manufacturing industries were in the top 5 pre-pandemic, but in the bottom 5 during the early pandemic. Similarly, the alcohol beverage, tobacco and cannabis product manufacturing industries were in the top 5 during the early pandemic, while in the bottom 5 post-lockdowns.
Table 1 shows that while profitability varied by industry, average margins largely remained positive and were higher post-lockdowns. This rise in profit levels is significant for the top 5 group, which faced net losses during lockdowns, followed by a rapid rise in profitability leading the rise in the total non-financial industry margins post-lockdowns.
| Revenues | Expenses | Net income or loss | Profit margin | Cost ratio | |
|---|---|---|---|---|---|
| percent change | average percent | ||||
| Total, non-financial industries | |||||
| Pre-pandemic (2017Q1-2019Q4) | 18.9 | 18.5 | 23.5 | 6.6 | 92.3 |
| Lockdowns (2020Q1-2021Q1) | 11.0 | 4.3 | 295.9 | 4.9 | 94.2 |
| Post-lockdowns (2021Q2-2022Q2) | 15.3 | 14.2 | 21.9 | 8.5 | 90.2 |
| Top 5 profitable industries | |||||
| Pre-pandemic | 25.6 | 28.6 | -30.6 | 5.8 | 93.0 |
| Lockdowns | 12.8 | -16.7 | -158.3 | -5.3 | 105.4 |
| Post-lockdowns | 43.8 | 27.7 | 185.0 | 11.4 | 86.5 |
| Bottom 5 profitable industries | |||||
| Pre-pandemic | 0.9 | 6.3 | -57.9 | 6.2 | 92.6 |
| Lockdowns | 5.5 | 1.8 | 105.7 | 4.2 | 94.7 |
| Post-lockdowns | 12.6 | 23.8 | -88.4 | 6.8 | 92.2 |
| Source: Statistics Canada. Table 33-10-0225-01 Quarterly balance sheet, income statement and selected financial ratios, by non-financial industries, non seasonally adjusted (x 1,000,000) | |||||
During the first year of the pandemic, most industries faced higher costs resulting from production and supply chain disruptions during lockdowns, enhanced safety measures, or lower productivity due to workplace reorganization, among other factors. The increased costs during this period are correlated with higher cost ratios and lower margins, although both have since recovered.
In an inflationary context, higher input costs are usually observed throughout the supply chain, which were reflected in the estimates as 49% of industries covered by the QSFS reported higher cost ratios between the second quarters of 2021 and 2022. Of the industries that recorded higher cost ratios, the increase was on average 3.2 percentage points higher. In contrast, the industries with improved proportional costs had their ratios decrease on average by 2.9 percentage points.
As described in section 2, higher input costs being passed on to consumers in an inflationary context should lead to lower margins, all else remaining equal. Hence, lower margins across industries over the past years would be expected. Between the second quarters of 2021 and 2022, 49% of the industries covered by the QSFS reported a decrease in margins.
Energy sector profitability rates rose due to soaring prices
Energy prices are sensitive to global economic and political developments, particularly in key oil-producing countries. As oil and natural gas are key commodity inputs in production across industries, changes to supply and demand in any important industry affect their prices. Additionally, being traded on commodity markets, energy prices are influenced by investor expectations, which are interlinked with wider economic developments.
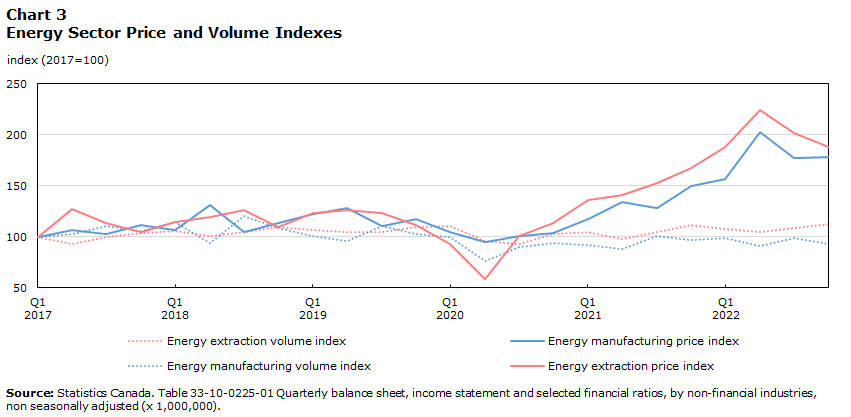
As Chart 3Note outlines, prices in the energy sector significantly increased since the recovery from downturns which began in the third quarter of 2019 due to global disputes over production caps and continued into the initial period of the pandemic (second quarter of 2020). Volume indexes for the energy extraction sector (oil and gas extraction and support services) and energy manufacturing sector (petroleum and coal product manufacturing) slightly declined in this period, followed by a recovery and a relatively stable output in line with pre-pandemic levels.
Chart 3 start
Data table for Chart 3
| Energy extraction price | Energy extraction volume | Energy manufacturing price | Energy manufacturing volume | |
|---|---|---|---|---|
| index (2017=100) | ||||
| 2017 | ||||
| Q1 | 100.0 | 100.0 | 100.0 | 100.0 |
| Q2 | 126.9 | 92.5 | 106.6 | 102.3 |
| Q3 | 113.5 | 99.7 | 102.6 | 110.9 |
| Q4 | 105.2 | 104.0 | 111.5 | 105.8 |
| 2018 | ||||
| Q1 | 114.6 | 105.9 | 106.4 | 114.3 |
| Q2 | 119.7 | 100.9 | 131.7 | 93.9 |
| Q3 | 126.4 | 104.9 | 104.8 | 120.5 |
| Q4 | 110.1 | 110.0 | 113.8 | 108.9 |
| 2019 | ||||
| Q1 | 123.2 | 106.6 | 122.8 | 101.3 |
| Q2 | 126.5 | 105.2 | 128.0 | 96.3 |
| Q3 | 123.2 | 104.4 | 110.5 | 110.5 |
| Q4 | 111.2 | 110.0 | 117.1 | 103.2 |
| 2020 | ||||
| Q1 | 93.2 | 110.5 | 104.9 | 99.6 |
| Q2 | 58.4 | 95.7 | 95.2 | 76.0 |
| Q3 | 100.8 | 92.8 | 101.1 | 90.3 |
| Q4 | 113.3 | 103.2 | 103.8 | 94.2 |
| 2021 | ||||
| Q1 | 135.6 | 104.8 | 117.5 | 91.6 |
| Q2 | 141.1 | 97.6 | 133.8 | 87.7 |
| Q3 | 153.1 | 104.9 | 128.2 | 100.8 |
| Q4 | 167.9 | 111.1 | 149.8 | 96.5 |
| 2022 | ||||
| Q1 | 188.4 | 107.6 | 156.4 | 99.2 |
| Q2 | 224.1 | 104.3 | 203.1 | 91.3 |
| Q3 | 201.9 | 108.4 | 177.0 | 99.3 |
| Q4 | 188.1 | 112.3 | 178.4 | 92.7 |
| Source: Statistics Canada. Table 33-10-0225-01 Quarterly balance sheet, income statement and selected financial ratios, by non-financial industries, non seasonally adjusted (x 1,000,000). | ||||
Chart 3 end
Global production cap disputes, supply bottlenecks and changes to price expectations in the wake of the pandemic resulted in higher costs and lower prices. Consequently, margins declined during and just prior to the pandemic (Chart 4). Although supply bottlenecks continued into 2021, price levels recovered in late 2020 amid a loosening of pandemic restrictions and increased demand for production around the world. This allowed margins to recover. These effects were more pronounced in the energy extraction sector relative to the energy manufacturing sector.
Chart 4 start

Data table for Chart 4
| Energy extraction profit | Energy manufacturing profit | Energy extraction | Energy manufacturing | |
|---|---|---|---|---|
| margin (percent) | cost ratio (percent) | |||
| 2017 | ||||
| Q1 | 6.8 | 3.4 | 96.5 | 95.9 |
| Q2 | 10.9 | 0.8 | 85.7 | 99.7 |
| Q3 | 5.1 | 4.1 | 95.5 | 94.3 |
| Q4 | -3.0 | 5.4 | 104.8 | 93.1 |
| 2018 | ||||
| Q1 | -1.4 | 6.8 | 99.9 | 91.4 |
| Q2 | -6.6 | 6.1 | 105.4 | 92.9 |
| Q3 | 2.3 | 8.3 | 97.5 | 89.9 |
| Q4 | -13.9 | 6.7 | 115.0 | 90.9 |
| 2019 | ||||
| Q1 | 0.5 | 7.1 | 98.4 | 91.7 |
| Q2 | 8.3 | 10.7 | 95.6 | 91.4 |
| Q3 | 2.0 | 7.7 | 97.8 | 91.3 |
| Q4 | -1.2 | 6.6 | 102.9 | 92.3 |
| 2020 | ||||
| Q1 | -67.4 | -8.8 | 178.4 | 108.6 |
| Q2 | -54.3 | -6.7 | 156.6 | 109.1 |
| Q3 | -17.4 | -1.5 | 121.1 | 101.7 |
| Q4 | -13.0 | -4.7 | 116.3 | 106.2 |
| 2021 | ||||
| Q1 | 21.4 | 4.5 | 79.9 | 94.7 |
| Q2 | 13.2 | 4.6 | 89.0 | 94.5 |
| Q3 | 18.3 | 5.7 | 80.3 | 93.2 |
| Q4 | 20.6 | 5.9 | 77.3 | 92.8 |
| 2022 | ||||
| Q1 | 15.5 | 8.3 | 81.6 | 89.6 |
| Q2 | 23.9 | 12.1 | 71.7 | 85.4 |
| Q3 | 22.8 | 5.7 | 73.5 | 94.8 |
| Q4 | 21.6 | 9.3 | 78.7 | 88.6 |
| Source: Statistics Canada. Table 33-10-0225-01 Quarterly balance sheet, income statement and selected financial ratios, by non-financial industries, non seasonally adjusted (x 1,000,000). | ||||
Chart 4 end
As supply constraints eased, volume levels recovered in late 2021, alongside a declining cost ratio. Robust demand during this period led to soaring prices. The combination of declining proportional costs and rising prices allowed a full recovery of margins to pre-pandemic levels. In the extraction sector, margins exceeded their pre-pandemic levels. In early 2022, there was a steep increase in prices following the Russian invasion of Ukraine. Although global energy production levels were maintained in the months following the invasion, restrictions imposed on Russian exports decreased the availability of global energy commodities. Other energy producing countries increased output allowing global production of petroleum and other liquids to exceed December 2021 levels by June 2022.Note Due to increased revenues resulting from higher prices and unchanged costs during this period, profits increased proportionally to revenues and costs.
The high energy prices documented during the first and second quarters of 2022 were last seen in 2008.Note Price levels during these two time periods were the highest recorded in Canada historically.Note As energy commodities are key inputs to production across industries, rising energy levels have meant rising costs across the board. From July 2021 to 2022, over half of the rise in the prices of major commodities sold by manufacturers in Canada was attributed to the increase in energy prices.Note The increases in total non-financial industry margins and reduction of the cost ratio between the second quarters of 2021 and 2022 was led by certain key sectors, including energy and mining, which are a part of the top 5 most profitable industries during this period. Excluding these industries, the total non-financial industry margin declined by 0.2 percentage points. Although a combination of global factors is at play leading to high energy prices, the result has been a continued rise in profit rates in the energy sector, alongside higher costs for consumers and other producers operating in non-energy sectors.
Food and drink sector profit rates grow at a slower pace
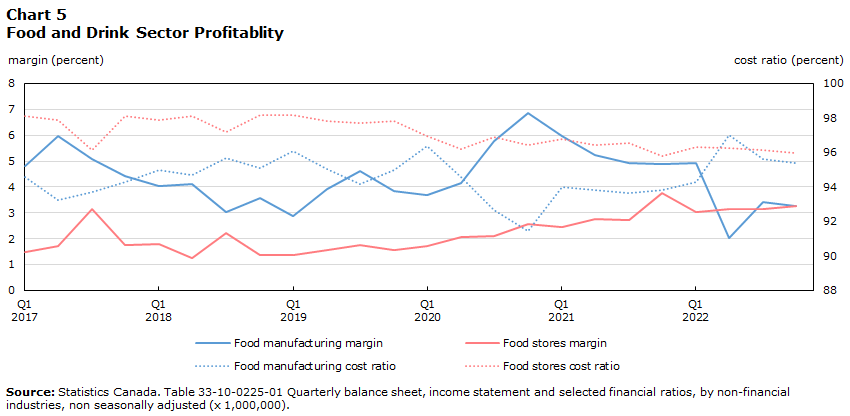
Inflation in the food sector also directly impacts Canadians on a day-to-day basis. For this sector, data is available for the food and beverage stores and food manufacturing industries. Continued growth in prices of commodities, including agriculture, into 2022 contributed to higher costs for the sector and to consumers, with the Consumer Price Index food group increasing by 8.9% in 2022.Note
In contrast to the energy sector, Charts 5 outlines a rise in margins for the food sector during the initial period of the pandemic, followed by a decline and steady reduction since 2021. Stores recorded the same trends as manufacturing after a lag of one quarter, except for the drop in food manufacturing margins during the second quarter of 2022. The food stores industry includes a variety of sub-sectors such as grocery stores, specialty food stores and beer, wine, and liquor stores. Given the data available at this time, the reported margins are aggregates for these sub-sectors.
Chart 5 start
Data table for Chart 5
| Food manufacturing | Food stores | Food manufacturing | Food stores | |
|---|---|---|---|---|
| margin (percent) | cost ratio (percent) | |||
| 2017 | ||||
| Q1 | 4.8 | 1.5 | 94.6 | 98.1 |
| Q2 | 5.9 | 1.7 | 93.2 | 97.9 |
| Q3 | 5.1 | 3.1 | 93.7 | 96.2 |
| Q4 | 4.4 | 1.7 | 94.3 | 98.1 |
| 2018 | ||||
| Q1 | 4.0 | 1.8 | 95.0 | 97.9 |
| Q2 | 4.1 | 1.3 | 94.7 | 98.1 |
| Q3 | 3.0 | 2.2 | 95.7 | 97.2 |
| Q4 | 3.6 | 1.4 | 95.1 | 98.1 |
| 2019 | ||||
| Q1 | 2.9 | 1.4 | 96.1 | 98.2 |
| Q2 | 3.9 | 1.6 | 95.0 | 97.8 |
| Q3 | 4.6 | 1.7 | 94.1 | 97.7 |
| Q4 | 3.8 | 1.6 | 95.0 | 97.8 |
| 2020 | ||||
| Q1 | 3.7 | 1.7 | 96.4 | 97.0 |
| Q2 | 4.1 | 2.1 | 94.6 | 96.2 |
| Q3 | 5.8 | 2.1 | 92.6 | 96.9 |
| Q4 | 6.8 | 2.6 | 91.4 | 96.4 |
| 2021 | ||||
| Q1 | 6.0 | 2.4 | 94.0 | 96.7 |
| Q2 | 5.2 | 2.8 | 93.8 | 96.4 |
| Q3 | 4.9 | 2.7 | 93.6 | 96.5 |
| Q4 | 4.9 | 3.8 | 93.8 | 95.8 |
| 2022 | ||||
| Q1 | 4.9 | 3.0 | 94.3 | 96.3 |
| Q2 | 2.0 | 3.1 | 97.0 | 96.2 |
| Q3 | 3.4 | 3.1 | 95.6 | 96.2 |
| Q4 | 3.3 | 3.3 | 95.4 | 96.0 |
| Source: Statistics Canada. Table 33-10-0225-01 Quarterly balance sheet, income statement and selected financial ratios, by non-financial industries, non seasonally adjusted (x 1,000,000). | ||||
Chart 5 end
In food manufacturing, the peak in margins was followed by a decline due to the rising costs. However, by the first quarter of 2023, food manufacturing margins matched pre-pandemic levels. Similarly, food stores’ margins declined to pre-pandemic levels in mid-2021 and since then, margins have remained above pre-pandemic levels. By the fourth quarter of 2022, margins for food stores were twice as large as before the pandemic (fourth quarter of 2019). This rise reflects a 23% increase in total revenues and a 21% increase in total expenses and a 155% increase in net income, which is highly sensitive to the difference between revenues and expenses.
Food stores’ margins are traditionally low, remaining between 1.5% and 2.3% since 2010, with a few exceptions. In contrast, since the first quarter of 2021, margins have remained consistently higher than pre-pandemic levels, between 2.4% and 3.8%. The economic effects of lockdowns were not felt as strongly by this sector relative to others that had to cease major operations. This could be a contributing factor to the more consistent growth in revenues and margins.
The distinct experience of the food and drink sector during the first year of the pandemic could have offset the effects of rising commodity prices on margins. As pandemic-related measures eased into 2022, profitability rates for the sector moderated from their peak in the first quarter of 2021. Although the Consumer Price Index began to moderate towards the end of 2022, the food group index reached a peak of 10.4% year-over-year peak in January 2023.Note Alongside high price levels in the food and drink sector, profitability rates remained higher than usual in the fourth quarter of 2022, particularly for food and drink stores.
Supply-chain disruptions and high energy prices fueled inflation while select profitable sectors led the rise in industry-wide margins
In the recent economic environment with persistent inflation, countervailing factors impacted profit margins. The average total non-financial industry margin increased from 6.6% between the first quarter of 2017 and the fourth quarter of 2019 to 8.5% between the second quarters of 2021 and 2022. This implies that average margins have been higher since the recovery from the pandemic than they were in the two years leading up to the pandemic.
While a complex range of factors impact industry-wide margins and costs, rising costs due to higher prices of essential commodities in an inflationary environment have negatively impacted the margins of many industries. At the same time, the current economic environment has allowed profit margins of certain sectors to rise significantly.
The rise in margins and declines in proportional costs were led by the oil and gas extraction, mining and quarrying, and petroleum and coal product manufacturing sectors. While the total non-financial industry margin increased from 8.1% to 8.6% between the second quarters of 2021 and 2022, excluding these sectors, it declined from 7.9% to 7.7% over the same period. This decline in margins accounts for several industries that recorded lower margins. Of those seeing declines, the largest declines were recorded in alcohol, tobacco, and cannabis manufacturing; and agricultural, forestry, fishing, and hunting sectors.
In the energy sector, global economic and political developments underlie the significant rise in prices. The higher prices allowed for increasing revenues alongside declining proportional costs, which led to a rise in margins between the second quarters of 2021 and 2022. Alternatively, higher profits can be representative of lower costs due to efficiency in operations and business decisions. For the period examined, any declining costs have not translated to lower prices for consumers or producers down the supply chain. Conversely, consumer (+8%) and producer prices (+14%) increased year-over-year in June 2022.Note Note These increases are mainly attributed to higher commodity prices, particularly energy, and ongoing supply-chain pressures despite an improvement over the past two years.
A rise in margins can imply higher revenues due to increased prices or volume of sales, declining costs due to improved efficiency among other reasons, or a combination of these factors. It is generally the case that a combination of factors impacts margins. During the 12-month period preceding the second quarter of 2022, the rise in industry-wide margins were led by the energy and mining sectors where soaring prices fueled an increase in margins. The considerable impact of higher commodity prices, particularly energy, and supply chain disruptions that began at the onset the pandemic persist across Canadian industries resulting in the current inflation rates. Higher costs of production led to reduced margins in several industries, while industries where costs were constant benefited from the higher price levels.
- Date modified: