
Housing Statistics in Canada
A profile of residential real estate investors in 2020
By Joshua Gordon and Joanie Fontaine
Skip to text
Text begins
Overview
This article presents a detailed profile of residential real estate investors in the provinces of Nova Scotia, New Brunswick, Ontario, Manitoba and British Columbia in 2020. It documents the demographic characteristics of investors, including age, sex and immigration status. It also looks at the geographic distribution of investors in certain provinces. The article is the second in a series on residential real estate investors produced by the Canadian Housing Statistics Program.
Key findings
- Among the provinces studied, Nova Scotia, New Brunswick and British Columbia had the highest share of out-of-province investors and non-resident investors.
- The share of in-province investors owning three or more properties in the housing stock ranged from 1.6% of all owners in New Brunswick to 2.9% in Ontario.
- Established immigrants—those who landed before 2010—comprised a higher share of investors than their share of the provincial populations.
- Residents aged 55 and older represented a higher proportion of investors than their share of the provincial populations.
- Women represented around half of all resident investors in the five provinces but were underrepresented among in-province investors with three or more properties in the housing stock, relative to their share of the provincial populations.
Introduction
In recent years, there has been growing concern about the role of residential real estate investors in Canada (Younglai, 2021a and b; Bank of Canada, 2021; Khan and Xu, 2022; Pasalis, 2022; House of Commons, 2022). While investors can provide needed rental stock, they have also been found to exacerbate house price volatility and can limit housing market access for first-time homebuyers (Haughwout et al., 2011; Allen et al., 2018; Caranci et al., 2022). As house prices increased sharply during the pandemic, several reports indicated that investors had begun to play a more prominent role in the Canadian housing market (Khan and Xu, 2022; Teranet, 2022). The Canadian Housing Statistics Program (CHSP), using comprehensive administrative data, contributes to an understanding of that role in a series of publications and data releases on the topic.
This article follows an initial article released earlier this year that mainly focused on the share of properties used as an investment across five provinces – Nova Scotia, New Brunswick, Ontario, Manitoba and British Columbia – by property type and by investor type (Fontaine and Gordon, 2023). In the present article, the CHSP provides additional information about the profile of investors in those five provinces. Specifically, it examines the demographic characteristics of investors and distinguishes between different types of investors to help clarify the nature of their role in housing markets.
What is an investor?
The analysis below classifies owners into one of three categories: investors, investor-occupants and non-investors.
An investor is an owner of at least one residential property that is not used as their primary place of residence. This category includes
- A business or government that owns at least one residential property, excluding Canadian non-profit organizations. Given the predominance of businesses in this category, they will simply be referred to as a “business investor” in what follows.
- A person who is not a current resident of Canada and is a residential property owner, referred to as a “non-resident investor”.
- A person who lives outside the province where they own residential property, referred to as an “out-of-province investor” in the province of the non-principal residence.
- A person who lives in the province and owns two or more residential properties, or owns a property with multiple residential units and does not occupy that property. These persons will be referred to as “in-province investors”.
By contrast, investor-occupants own a single property with multiple residential units, one of which is their primary place of residence. For example, this category includes owners of a house with a laneway unit or basement suite and owners of a duplex who live in one of the units.
Lastly, non-investors are owners who are not an investor or an investor-occupant. This category primarily includes owners of a single property that does not have multiple residential units who live in the province where their property is located. Canadian non-profit businesses are also included in this category.
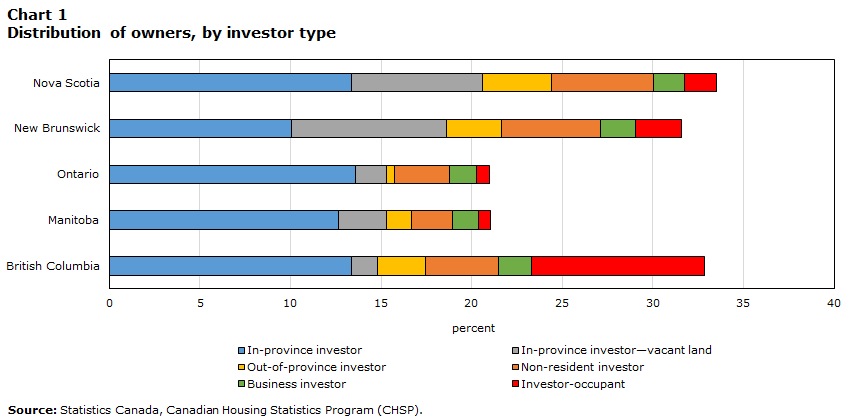
Looking at different investor types across provinces
The share of the different investor types set out above can be compared by province (Chart 1). This comparison is useful because different types of investors may have distinct purposes for owning investment properties and may thus have distinct demographic profiles and differing impacts on the housing market.
Among these investor types, one important distinction is between in-province investors with multiple properties that are part of the housing stock (i.e., properties that are not vacant land) and those who own one property in the housing stock and only parcels of vacant land in addition. This vacant land is often adjoined to the property of the primary residence and is used as an extension of that property. In Chart 1, these types of investors, along with those who own two or more properties of vacant land only, are called “in-province investors—vacant land.”Note
We find that investors with this profile were similar to non-investors in terms of average income, assessed value of residential property holdings and the relative absence of rental income. When they are excluded, most provinces had similar rates of in-province investors among all owners (between 12.6% in Manitoba and 13.6% in Ontario), with a lower rate in New Brunswick (10.0%).
Data table for Chart 1
| Nova Scotia | New Brunswick | Ontario | Manitoba | British Columbia | |
|---|---|---|---|---|---|
| percent | |||||
| In-province investor | 13.4 | 10.0 | 13.6 | 12.6 | 13.4 |
| In-province investor—vacant land | 7.2 | 8.6 | 1.7 | 2.7 | 1.4 |
| Out-of-province investor | 3.8 | 3.0 | 0.5 | 1.4 | 2.7 |
| Non-resident investor | 5.6 | 5.5 | 3.0 | 2.3 | 4.0 |
| Business investor | 1.7 | 1.9 | 1.5 | 1.4 | 1.8 |
| Investor-occupant | 1.8 | 2.5 | 0.8 | 0.7 | 9.6 |
| Source: Statistics Canada, Canadian Housing Statistics Program (CHSP). | |||||
The rate of out-of-province investors in Ontario (0.5%) and Manitoba (1.4%) was relatively lower than in British Columbia (2.7%), New Brunswick (3.0%) and Nova Scotia (3.8%). In British Columbia, higher rates of out-of-province investors were found in areas along the southern portion of the British Columbia-Alberta border. For example, in the regional municipality of Invermere, 40.9% of owners were out-of-province investors, and this rate reached 69.2% in Radium Hot Springs.
In New Brunswick and Nova Scotia, a regional analysis reveals that a high proportion of properties owned by out-of-province investors were in areas near the Atlantic coast or provincial boundaries.
The rate of investor-occupants was highest in British Columbia (9.6%) and significantly lower in the other provinces. This phenomenon is examined in greater detail in the final section of the article. Other CHSP releases have examined variations in the rates of non-resident ownership and business ownership; thus, these investor types are not detailed here.
Differentiating among in-province investors
It is also possible to further differentiate the category of in-province investors (those who reside in the province where they own investment properties). This can be done based on the number of properties they owned and the location of their secondary properties (Chart 2). In this section, “in-province investors – vacant land” are excluded, and thus all properties are assumed to be in the housing stock.

Data table for Chart 2
| Nova Scotia | New Brunswick | Ontario | Manitoba | British Columbia | |
|---|---|---|---|---|---|
| percent | |||||
| In-province investor—three or more properties | 2.6 | 1.6 | 2.9 | 2.2 | 2.8 |
| In-province investor—two properties in the same region | 7.3 | 5.6 | 6.2 | 6.4 | 7.1 |
| In-province investor—two properties in different regions | 3.5 | 2.8 | 4.4 | 4.1 | 3.4 |
|
Note: In this chart, the number of properties excludes vacant land. In-province investors who own one property with multiple residential units and who do not reside in one of those units are included in the category of “in-province investor–two properties in the same region”. Source: Statistics Canada, Canadian Housing Statistics Program (CHSP). |
|||||
One distinct profile among in-province investors are those who own a single additional property in a different region than where their principal residence is located.Note In many cases, these may be recreational property owners, rather than landlords who often own multiple properties in the same region.Note An analysis of declared rental income among these different in-province investor types found that investors with a potential recreational property profile (two properties in different regions) were around half as likely to declare rental income in their tax family than those with a potential landlord profile (two properties in the same region or three or more properties). In British Columbia, for example, 61.8% of the latter type declared rental income in their tax family, compared with 35.4% of the former type. In Ontario, the figures were 61.5% and 25.7%, respectively.Note
In-province investors can also be distinguished by whether they have only one additional property or whether they own three or more properties (Chart 2). Similar rates of these larger-scale in-province investors were found across provinces, ranging from 1.6% of all owners in New Brunswick to 2.9% in Ontario.
Investor incomes
Out-of-province investors had the highest average incomes in all five provinces (Table 1) compared with other types of investors. Among in-province investors, those with three or more residential properties had the highest incomes across all provinces, followed by those with only a single additional property in a different region—a situation consistent with holding a potential recreational property. In-province investors with two properties in the same region had the next highest incomes, while those with vacant land had the lowest incomes among all resident-investor types. In most provinces, investors who only owned vacant land in addition to their principal residence had average incomes similar to those of non-investors and investor-occupants.
| Investor type | B.C. | Man. | Ont. | N.B. | N.S. |
|---|---|---|---|---|---|
| Dollars | |||||
| In-province investor—three or more properties | 115,000 | 80,000 | 110,000 | 80,000 | 80,000 |
| In-province investor—two properties in the same region | 80,000 | 65,000 | 80,000 | 55,000 | 60,000 |
| In-province investor—two properties in different regions | 100,000 | 75,000 | 105,000 | 70,000 | 75,000 |
| Out-of-province investor | 150,000 | 85,000 | 120,000 | 85,000 | 95,000 |
| Investor-occupant | 65,000 | 50,000 | 60,000 | 50,000 | 55,000 |
| Non-investor | 65,000 | 60,000 | 65,000 | 55,000 | 55,000 |
| Source: Statistics Canada, Canadian Housing Statistics Program (CHSP). | |||||
Established immigrants are investors at higher rates than Canadian-born residents
Previous releases from the CHSP have found that the share of homeowners who are immigrants in each province corresponds closely to the share of immigrants in the overall provincial population. In other words, immigrants appear to be able to access homeownership at a similar rate to that of Canadian-born residents. Among individual resident investors, however, immigrants were underrepresented, relative to their share of the provincial population, in Nova Scotia, New Brunswick and Manitoba (Chart 3).Note This is mostly due to fewer recent immigrants (those who landed in Canada since 2010) being investors.Note Established immigrants, on the other hand, made up a higher proportion of investors than their share of the population in these provinces. In Ontario and British Columbia, both immigrants in general and established immigrants were overrepresented among investors, relative to their share of the provincial population.

Data table for Chart 3
| Nova Scotia | New Brunswick | Ontario | Manitoba | British Columbia | |
|---|---|---|---|---|---|
| percent | |||||
| Share of investors who are immigrants | 6.0 | 3.8 | 33.2 | 15.1 | 31.9 |
| Share of non-investor owners who are immigrants | 6.7 | 4.8 | 32.2 | 20.3 | 29.3 |
| Share of population that is immigrant (Census 2021) | 7.5 | 5.8 | 30.0 | 19.7 | 29.0 |
|
Note: Calculations are based on resident owners and exclude owners whose immigration status is unknown. Source: Statistics Canada, Canadian Housing Statistics Program (CHSP). |
|||||
The assessed value of the property holdings of immigrant investors tended to be higher than that of Canadian-born investors in all five provinces.Note For example, the average assessed value of immigrant investors’ total property holdings was $2,200,000 in British Columbia, compared with $1,610,000 for Canadian-born investors. The property holdings in Ontario were on average $1,290,000 for immigrant investors and $890,000 for Canadian-born investors. In the other provinces, the differences in the average value of the total property holdings between immigrant and Canadian-born investors were smaller in absolute terms. In each province, though, most of this difference was explained by the fact that immigrant investors were more likely to own a primary residence in a larger census metropolitan area (CMA), where assessment values tend to be higher than in other parts of the respective provinces. When looking at investors with primary residences in the same census subdivisions (CSDs), the difference in average assessed value between immigrant and Canadian-born investors was smaller.
In Ontario, Manitoba and British Columbia, the average income of immigrant investors was lower than that of Canadian-born investors. The disparity in incomes was most pronounced in British Columbia and Ontario. In British Columbia, Canadian-born investors had an average individual income of $105,000, whereas immigrant investors had an average individual income of $80,000. In Ontario, the average individual income was $80,000 for immigrant investors and $100,000 for Canadian-born investors. In Nova Scotia, the average income of immigrant investors ($75,000) was higher than Canadian-born investors ($65,000). This pattern was also found in New Brunswick, where the average income of immigrant investors ($65,000) was higher than Canadian-born investors ($60,000).
The majority of investors are 55 and older
Residents aged 55 years and older were overrepresented among homeowners relative to their share of the population. This is consistent with the idea that purchasing a home often requires a lengthy period of saving and the higher incomes usually associated with longer experience in the labour market. For similar reasons, residents 55 and older were even more overrepresented among investors (Chart 4). In all five provinces, they constituted the majority of resident investors—from 57.1% in Ontario to 66.9% in Nova Scotia—despite being a minority of the adult population in each province, from 39.8% in Manitoba to 48.3% in New Brunswick.Note
Conversely, Canadians younger than 35 were significantly underrepresented among investors relative to their share of the adult population (Chart 5). This underrepresentation among investors was even more pronounced than their underrepresentation among homeowners and likely occurred for similar reasons: fewer income-earning years make it more difficult to accumulate the financial capital required for homeownership and, especially, real estate investment.

Data table for Chart 4
| Nova Scotia | New Brunswick | Ontario | Manitoba | British Columbia | |
|---|---|---|---|---|---|
| percent | |||||
| Younger than 35 | 4.0 | 4.4 | 5.1 | 6.6 | 4.9 |
| 35 to 54 years old | 29.1 | 29.5 | 37.8 | 35.3 | 36.5 |
| 55 and older | 66.9 | 66.1 | 57.1 | 58.1 | 58.5 |
|
Note: Calculations are based on resident owners and exclude owners with unknown age. Source: Statistics Canada, Canadian Housing Statistics Program (CHSP). |
|||||

Data table for Chart 5
| Nova Scotia | New Brunswick | Ontario | Manitoba | British Columbia | |
|---|---|---|---|---|---|
| percent | |||||
| Share of investors younger than 35 | 4.0 | 4.4 | 5.1 | 6.6 | 4.9 |
| Share of non-investor owners younger than 35 | 9.6 | 11.0 | 10.7 | 12.8 | 9.7 |
| Share of the adult population that is 20 to 34 years old (2021 Census) | 22.7 | 20.5 | 25.5 | 27.1 | 24.6 |
|
Note: Calculations are based on resident owners and exclude owners with unknown age. Source: Statistics Canada, Canadian Housing Statistics Program (CHSP). |
|||||
Men are overrepresented among investors with three or more properties
Women and men constituted a similar proportion of investors in the five provinces. Among resident investors, the proportion of investors who are male ranged from 50.2% in British Columbia to 56.2% in New Brunswick.Note This indicates that there was a limited difference between men and women in the propensity to engage in real estate investment. It is notable, though, that men were overrepresented among investors with three or more properties in the housing stock. This may suggest a more significant difference between men and women in the propensity to become larger-scale investors.
Despite this, the average assessed value of investors’ real estate holdings was similar between men and women in all five provinces.
Consistent with the pattern among all homeowners, the average income of female investors was significantly less than that of male investors. This disparity was the largest in British Columbia and Ontario. In British Columbia, the average income for male investors was $125,000 compared with $70,000 for female investors. In Ontario, those same figures were $115,000 and $75,000, respectively. These statistics align with previous CHSP findings for real estate buyers in Nova Scotia, New Brunswick and British Columbia that showed that female buyers had lower incomes than male buyers, but purchased homes with similar prices.Note

Data table for Chart 6
| Nova Scotia | New Brunswick | Ontario | Manitoba | British Columbia | |
|---|---|---|---|---|---|
| percent | |||||
| Male proportion of non-investor owners | 48.3 | 49.3 | 47.5 | 48.8 | 47.5 |
| Male proportion of in-province investors with two properties | 51.0 | 55.4 | 50.1 | 51.4 | 49.2 |
| Male proportion of in-province investors with three or more properties | 54.4 | 60.9 | 52.9 | 55.0 | 51.2 |
|
Note: The number of properties excludes vacant land. Calculations are based on resident owners and exclude owners with unknown sex. In-province investors who have one property with multiple residential units and who do not reside in one of those units are included in the category of owners of two properties. Source: Statistics Canada, Canadian Housing Statistics Program (CHSP). |
|||||
There is a significant presence of investor-occupants in urban British Columbia
In some expensive urban markets, densification has produced a high number of properties with multiple residential units, such as rental apartment buildings and condominium apartment towers. While densification can take the form of large buildings, it can also emerge through more incremental forms of density, such as single-detached houses with secondary suites or laneway units, duplexes, or triplexes. This latter form of density can produce high rates of investor-occupants (people who own a single property with multiple residential units and live in one of the units).
CHSP data show that this phenomenon is especially prominent in urban British Columbia.Note In the CMA of Vancouver, 12.5% of owners were investor-occupants. In the core CSD, the City of Vancouver, this proportion was 15.9%. This may be attributable to municipal efforts in the City of Vancouver to promote incremental density, such as laneway homes, secondary suites and duplexes. The share of investor-occupants among all owners was also higher than the provincial average in the CMA of Victoria, at 12.2%. In the Victoria CMA, the rate of investor-occupants was highest in the CSDs of Saanich (13.3%), Colwood (14.6%) and Langford (16.5%).
As noted above, investor-occupants had average incomes that were similar to those of non-investors, but lower than investor incomes, in the four CMAs of British Columbia: Abbotsford–Mission, Kelowna, Vancouver and Victoria. For instance, in the Vancouver CMA, the average income for investor-occupants was $65,000, compared with $65,000 for non-investors and $100,000 for in-province investors.
Despite this, the average assessed value of the properties owned by investor-occupants was typically higher than that for non-investors in British Columbia. In the CMA of Vancouver, the properties of investor-occupants had an average assessed value 34.7% higher than the properties of non-investors, while in Victoria they were 6.0% higher.

Description for map 1
The title of the map is: “Proportion of investor-occupants by census subdivision, Vancouver and Victoria census metropolitan areas, 2020.” This figure displays two maps of the census subdivisions (CSDs) of the census metropolitan area (CMAs) of Vancouver (top) and Victoria (bottom).
Each CSD is shaded from light to dark purple based on the proportion of owners that are investor-occupants. The darker the shade, the higher the proportion investor-occupants in that CSD. The map shows that there is a higher proportion of investor-occupants in the City of Vancouver and Surrey CSDs in the Vancouver CMA, and a higher proportion of investor-occupants in the Langford and Colwood CSDs in the Victoria CMA.
| Census subdivision name | Proportion of investor-occupants as a share of owners by CSD (percentage) |
|---|---|
| CMA Vancouver | |
| Anmore, Village | 5.7 |
| Belcarra, Village | 13.2 |
| Bowen Island, Island municipality | 4.7 |
| Burnaby, City | 9.3 |
| Coquitlam, City | 9.7 |
| Delta, District municipality | 10.8 |
| Greater Vancouver A, Regional district electoral area | 0.3 |
| Langley, City | 5.5 |
| Langley, District municipality | 10.6 |
| Lions Bay, Village | 8.7 |
| Maple Ridge, City | 9.5 |
| New Westminster, City | 10.1 |
| North Vancouver, City | 8.2 |
| North Vancouver, District municipality | 13.2 |
| Pitt Meadows, City | 6.5 |
| Port Coquitlam, City | 12.1 |
| Port Moody, City | 3.9 |
| Richmond, City | 4 |
| Surrey, City | 16.2 |
| Vancouver, City | 15.9 |
| West Vancouver, District municipality | 4.5 |
| White Rock, City | 11.5 |
| Victoria | |
| Central Saanich, District municipality | 10.6 |
| Colwood, City | 14.6 |
| Esquimalt, District municipality | 12.1 |
| Highlands, District municipality | 4.6 |
| Juan de Fuca (Part 1), Regional district electoral area | 5.1 |
| Langford, City | 16.5 |
| Metchosin, District municipality | 6.9 |
| North Saanich, District municipality | 8 |
| Oak Bay, District municipality | 6 |
| Saanich, District municipality | 13.3 |
| Sidney, Town | 8.4 |
| Sooke, District municipality | 11.3 |
| Victoria, City | 9.5 |
| View Royal, Town | 12.2 |
| Source: Statistics Canada, Canadian Housing Statistics Program (CHSP). | |
Note to readers
The CHSP is an innovative data project that leverages data sources and transforms them into new and timely indicators on Canadian housing.
The data in this study are compiled from the CHSP for the 2020 reference year. Complete information about the reference years of the property stock, by province and territory, is available here.
In the calculation of the rate of different investor types by CSD, all owners of residential property in each respective CSD are included.
Homeowners for the 2020 reference year are linked to the tax data from the T1 Family File (T1FF) for the 2019 tax year. Data in the T1FF include all individuals who filed a T1 Income Tax Return, combined with other administrative files from the Canada Revenue Agency.
Definitions
An investor is defined as an owner of at least one residential property that is not used as their primary place of residence, excluding Canadian non-profit organizations. A person who owns a single property in the province where they reside is not considered an investor unless they own a property with multiple residential units. This category excludes investor-occupants.
An investor-occupant owns a single property with multiple residential units and occupies that property.
A non-investor is an owner who is not an investor or an investor-occupant. An owner of a single property who lives in the property is included in this category unless they own a property with multiple residential units.
A person is considered a non-resident if their primary dwelling is outside the economic territory of Canada.
Housing stock refers to all residential properties, excluding vacant land.
References
Allen, M.T., Rutherford, J., Rutherford, R., Yavas, A. (2018). Impact of Investors in Distressed Housing Markets. The Journal of Real Estate Finance and Economics. 56. 622-652.
Bank of Canada (2021). Financial System Review, 2021. Bank of Canada.
Caranci, B., Fong, F., Gebreselassie, M. (2022). Is housing perpetuating a wealth divide in Canada? TD Economics.
Fontaine, J., Gordon, J. (2023). Residential real estate investors and investment properties in 2020. Canadian Housing Statistics Program: Statistics Canada.
Gellatly, G., Morissette, R. (2019). Immigrant ownership of residential properties in Toronto and Vancouver. Canadian Housing Statistics Program: Statistics Canada.
Gougeon, A., Moussouni, O. (2021). Residential real estate sales in 2018: Who is purchasing real estate? Canadian Housing Statistics Program: Statistics Canada.
Haughwout, A., Lee, D., Tracy, J., and van der Klaauw, W. (2011). Real estate investors, the leverage cycle, and the housing market crisis. Staff Reports 514, Federal Reserve Bank of New York.
House of Commons (2022). M-71 Affordable Housing Strategy. Private Member Motion.
Khan, M., Xu, Y. (2022). Housing demand in Canada: A novel approach to classifying mortgaged homebuyers. Staff Analytical Note 2022-1, Bank of Canada.
Pasalis, J. (2022). The Good, the Bad, the Ugly for Toronto Real Estate. Realosophy: Move Smartly Report.
Teranet. 2022. Market Insights – The Canadian Source for Housing Information – Q2 2022, https://www.teranet.ca/wp-content/uploads/2022/06/Teranet-Market-Insight-Quarterly-Report-Q2-2022.pdf (accessed September 12, 2022).
Younglai, R. (2021a). “Investors account for a fifth of home purchases in Canada. Are they driving up housing prices in a booming market?” The Globe and Mail, June 22, 2021.
Younglai, R. (2021b). “Average home costs are up 30% since before the pandemic, a spike CMHC links to speculative investors.” The Globe and Mail, November 24, 2021.
- Date modified: