
Economic Insights
Immigrant Ownership of Residential Properties in Toronto and Vancouver

Archived Content
Information identified as archived is provided for reference, research or recordkeeping purposes. It is not subject to the Government of Canada Web Standards and has not been altered or updated since it was archived. Please "contact us" to request a format other than those available.
This article in the Economic Insights series highlights new data on the ownership of residential properties in Toronto and Vancouver. It focuses solely on residential properties owned by Canadian residents, and describes how the housing assets of immigrants differ from those owned by Canadian-born residents. It reports on the prevalence of immigrant ownership for different types of housing, including single-detached houses, semi-detached houses, row houses and condominium apartments, and compares the property values of Canadian-born and immigrant-owned assets. Information on the location, age and size of properties is used to highlight differences in the relative value of immigrant-owned housing. Properties owned by non-residents were addressed in a previous study and are therefore excluded from the study.
Introduction
A central objective of the Canadian Housing Statistics Program (CHSP) is the development of a comprehensive data source that yields timely information on how different social, economic and demographic factors are shaping the evolution of Canadian housing markets. The first wave of CHSP data, released in December 2017, focused on the prevalence of non-resident ownership in the metropolitan areas of Toronto and Vancouver. An article accompanying the release of these data (Gellatly and Morissette, 2017) highlighted the higher prevalence of non-resident ownership among condominiums, and evaluated the extent to which higher property values among non-resident owned condominiums were attributable to the size, age and location of these properties. The study also documented sizable differences in the value of non-resident and resident-owned housing in other segments of the residential property market of both cities, most notably among single-detached houses in Vancouver.
This article uses new data developed by the CHSP to extend the demographic analysis of housing markets in Toronto and Vancouver.Note It compares patterns of homeownership among immigrant residents and Canadian-born residents, focusing on the valuation of single- and semi-detached houses, row houses and condominium apartments. It then describes the extent to which differences in property values between immigrant and Canadian-born owners are associated with an observable set of property-level and owner-level characteristics. Properties owned by non-residents are excluded from the study.
Since the late 1990s, immigration has been the key driver of population growth in Canada. As a result, immigrants are now an important segment of the population in Toronto and Vancouver. According to the 2016 Census, immigrants represented 41% of Vancouver’s population and 46% of Toronto’s population.
Immigrant and Canadian-born families might behave differently—in terms of housing—for a variety of reasons. Homeownership might be an important milestone for immigrants in the path towards social and economic integration.Note Furthermore, immigrant Canadians may exhibit a stronger preference for investments in housing than Canadian-born residents. Data from the Survey of Financial Security (SFS) support this view: housing assets comprise a larger share of average wealth among immigrant families than among the Canadian-born (Chart 1).Note Investments in housing may also be a more important retirement asset and source of wealth creation for immigrants given that they have lower coverage by registered pension plans (RPPs) than their Canadian-born counterparts (Chart 2). For all these reasons, the involvement of immigrants and Canadian-born households in the housing market might differ.
The comparison between immigrant-owned properties and those owned by Canadian-born residents also draws on an established line of immigration research at Statistics Canada. Earlier research at the agency focused on whether the earnings and income trajectories of immigrants differ from those of the Canadian-born (Frenette and Morissette, 2003; Hou and Picot, 2003; Picot and Sweetman, 2005; Picot et al., 2007; Picot et al., 2009; Hou and Picot, 2014; Picot and Lu, 2017). A second set of studies analyzed the socio-economic outcomes of immigrants’ children (Hou and Picot, 2011; Hou et al., 2012; Hou and Bonikowska, 2016). More recent research has focused on the relationship between immigration and business dynamics (Green et al. 2016; Leung et al. 2018; Ostrovsky and Picot, 2018) and on the wealth of immigrant families (Morissette, 2019: forthcoming). Hence, the current article adds the housing dimension to the aforementioned list of socio-economic outcomes that have been previously investigated for immigrants.
The study does not attribute changes in property prices in Toronto and Vancouver to any specific socio-demographic or economic factor. Indeed, many factors may have affected the evolution of housing prices in these cities over the past few years. Increases in housing demand due to population growth—resulting from natural increases and immigration—real income growth, favourable borrowing conditions, and changes in economic activity may have each contributed to higher property prices. Changes in housing supply may also have played a role. Increases in the wealth holdings of some Canadian-born and immigrant households—and thus, in their ability to purchase expensive properties—may also have had an influence on property prices.
To disentangle the causal impact of these factors, one needs comprehensive socio- economic information over many years. Currently, CHSP data contains property value information for a single year only (2017 for Vancouver and 2016 for Toronto) and therefore cannot be used to correlate past movements in property prices with past changes in housing demand and in housing supply.
Despite these limitations, the study provides more detailed information than was available in the past on the degree to which immigrants are integrated in different segments of the housing market in both cities. This information provides a richer understanding of the housing market in these cities.

Data tables for Charts 1 and 2
| 45 to 64 | 35 to 54 | 25 to 44 | |
|---|---|---|---|
| percent | |||
| Canadian-born families | 32.7 | 35.3 | 39.0 |
| Immigrant families | 51.5 | 61.8 | 69.3 |
|
Note: Immigrant families whose primary income earner is aged 25 to 44 (35 to 54, 45 to 64) arrived in Canada less than 10 years ago (10 to 19 years ago, 20 years ago or more).
Source: Statistics Canada, Survey of Finanical Security, 1995, 2005, 2012 and 2016. |
|||
| Immigrants | Canadian-born | All employees aged 25 to 54 | |
|---|---|---|---|
| percent | |||
| Men | 27.1 | 38.7 | 35.6 |
| Women | 31.7 | 44.8 | 41.2 |
| Source: Statistics Canada, Longitudinal and International Study of Adults, 2012. | |||
Immigrants own proportionately fewer single-detached houses in both cities
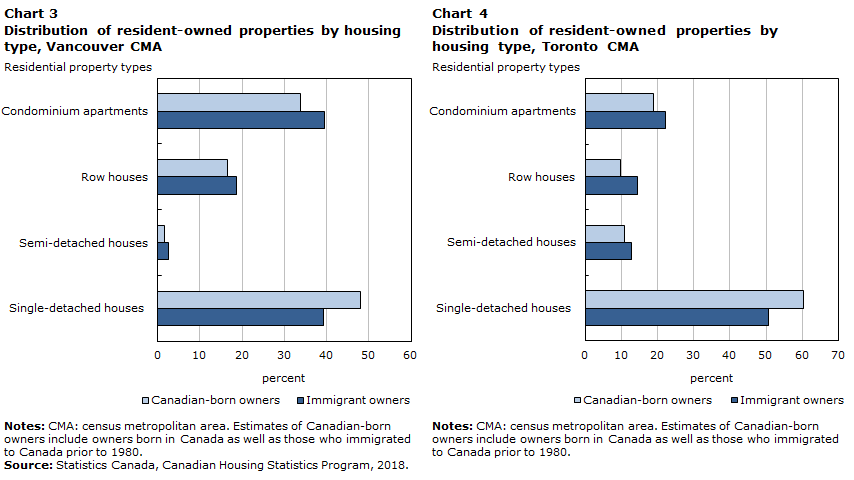
Immigrants own 37% of all selected residential properties in Vancouver and 43% of all selected properties in Toronto.Note In both metropolitan areas, the overall mix of residential properties owned by immigrants differs from those owned by Canadian-born residents. In Vancouver, single detached houses account for 39% of all immigrant-owned properties, compared to 48% of properties owned by Canadian-born residents (Chart 3). Immigrants own proportionately more of all other standard housing types in Vancouver. Condominiums also account for 39% of immigrant-owned properties, compared to 34% of those owned by Canadian-born residents.
A similar pattern is apparent in Toronto, with immigrants owning proportionately fewer single-detached houses, and proportionately more of all other property types. About one-half of all selected properties owned by immigrants in Toronto are single-detached houses, compared to 60% of properties with Canadian-born owners. Condominiums account for 22% of immigrant-owned properties in Toronto, compared to 19% of those owned by Canadian-born residents.
Data tables for Charts 3 and 4
| Single-detached houses | Semi-detached houses | Row houses | Condominium apartments | |
|---|---|---|---|---|
| percent | ||||
| Immigrant owners | 39.3 | 2.6 | 18.6 | 39.5 |
| Canadian-born owners | 48.0 | 1.6 | 16.6 | 33.8 |
|
Notes: CMA: census metropolitan area. Estimates of Canadian-born owners include owners born in Canada as well as those who immigrated to Canada prior to 1980. Source: Statistics Canada, Canadian Housing Statistics Program, 2018. |
||||
| Single-detached houses | Semi-detached houses | Row houses | Condominium apartments | |
|---|---|---|---|---|
| percent | ||||
| Immigrant owners | 50.7 | 12.7 | 14.6 | 22.1 |
| Canadian-born owners | 60.4 | 11.0 | 9.7 | 19.0 |
|
Notes: CMA: census metropolitan area. Estimates of Canadian-born owners include owners born in Canada as well as those who immigrated to Canada prior to 1980. Source: Statistics Canada, Canadian Housing Statistics Program, 2018. |
||||
Immigrants own more expensive single detached houses in Vancouver
Table 1 compares the average assessment values of immigrant-owned properties to those of Canadian-born owners. The data show that in Vancouver, single-detached houses owned by immigrants average $1.77 million, about 17% more than the average value of single-detached homes owned by the Canadian-born ($1.51 million). Immigrant-owned semi-detached houses in Vancouver have lower average assessment values than those owned by Canadian-born residents (a difference of $126,400), while smaller differences in average valuation are apparent among condominiums and row houses.
In contrast, immigrants own less expensive properties, on average, in Toronto. This is true regardless of the types of housing examined. The largest difference occurs for semi-detached houses, where the average value of immigrant-owned dwellings is $88,200 lower than those owned by Canadian-born residents. Similarly, the average assessment value for immigrant-owned condominium apartments is $52,400 lower. Smaller differences (-$19,500) are apparent among single-detached houses. Before adjusting for property characteristics, immigrant-owned single-detached houses in Toronto exhibit a 2% lower average assessment value than those owned by Canadian-born residents.Note
| Average assessment value | Median assessment value | |||||
|---|---|---|---|---|---|---|
| Immigrant owner | Canadian-born owner | Difference | Immigrant owner | Canadian-born owner | Difference | |
| 2017 dollars | ||||||
| Vancouver | ||||||
| All property types | 1,110,500 | 1,073,000 | 37,500 | 810,200 | 851,000 | -40,800 |
| Single detached | 1,767,500 | 1,512,400 | 255,100 | 1,373,000 | 1,254,100 | 118,900 |
| Semi-detached | 1,143,800 | 1,270,200 | -126,400 | 1,139,000 | 1,205,000 | -66,000 |
| Row house | 716,300 | 706,900 | 9,400 | 648,000 | 617,000 | 31,000 |
| Condominium | 639,500 | 619,700 | 19,800 | 543,000 | 515,000 | 28,000 |
| 2016 dollars | ||||||
| Toronto | ||||||
| All property types | 644,700 | 715,000 | -70,300 | 576,000 | 618,000 | -42,000 |
| Single detached | 829,800 | 849,300 | -19,500 | 729,000 | 724,000 | 5,000 |
| Semi-detached | 568,600 | 656,800 | -88,200 | 541,000 | 587,000 | -46,000 |
| Row house | 487,300 | 520,600 | -33,300 | 459,000 | 463,000 | -4,000 |
| Condominium | 368,000 | 420,400 | -52,400 | 333,000 | 359,000 | -26,000 |
|
Note: In this table, Canadian-born owners include owners born in Canada as well as those who immigrated to Canada prior to 1980. Immigrant owners refer to owners who immigrated to Canada from 1980 onwards. Source: Statistics Canada, Canadian Housing Statistics Program. |
||||||
Property characteristics explain most of the difference in the value of single-detached houses in Vancouver
The differences in average assessment values reported in the third column of Table 1 do not take account of differences in property-level characteristics between immigrant and Canadian-born owners. In both Vancouver and Toronto, immigrants tend to own newer properties (which tend to have higher values) than their Canadian-born counterparts. In Vancouver, immigrant-owned properties are, on average, about 8 years newer than those owned by Canadian-born residents. In Toronto, immigrant-owned properties are about 13 years newer.Note Similar age differences are apparent for single-detached homes in both metropolitan areas. By comparison, differences in property size between the two groups are generally less apparent, except among single-detached houses, which tend to be larger if the dwelling is immigrant-owned.Note
The second column of Table 2 reports estimates of the difference in property values between the two groups that factor in observed differences in property age, property size, and location (measured at the census subdivision level). In Vancouver, almost all of the higher average value for immigrant-owned single detached dwellings can be explained by differences in property size, age and location. Controlling for these factors reduces the difference in average assessment value from $255,100 to $22,600. Property characteristics also explain about one-half of the lower average value among immigrant-owned, semi-detached houses.
| Control variables | No controls | Property characteristics | Owner characteristics |
|---|---|---|---|
| 2017 dollars | |||
| Vancouver - all properties | |||
| All property types | 37,500Note *** | 13,300Note *** | 155,200Note *** |
| Single detached | 255,100Note *** | 22,600Note *** | 412,100Note *** |
| Semi-detached | -126,400Note *** | -65,900Note *** | -22,300 |
| Row house | 9,400Note *** | -19,200Note *** | 56,800Note *** |
| Condominium | 19,800Note *** | 11,000Note *** | 60,900Note *** |
| 2016 dollars | |||
| Toronto - all properties | |||
| All property types | -70,300Note *** | -53,300Note *** | -22,500Note *** |
| Single detached | -19,500Note *** | -52,300Note *** | 41,600Note *** |
| Semi-detached | -88,200Note *** | -36,900Note *** | -56,700Note *** |
| Row house | -33,300Note *** | -35,400Note *** | -12,900Note *** |
| Condominium | -52,400Note *** | -29,100Note *** | -23,500Note *** |
Source: Statistics Canada, Canadian Housing Statistics Program. |
|||
In Toronto, immigrant-owned properties exhibit lower average assessment values for each of the four dwelling types examined. Adjusting these differences based on observable property characteristics has a different impact on the estimated gap, depending on the type of housing examined. On an unadjusted basis, immigrant owned, single-detached houses in Toronto have an average assessment value which is $19,500 lower than those owned by Canadian-born residents. After adjusting for size, age, and location, this negative gap widens to $52,300 (when more comparable single-detached units are compared). This means that, taken together, property age, property size, and location cannot explain the lower average assessment value observed for the single-detaches houses owned by immigrants. In contrast, among semi-detached houses and condominiums, controlling for property characteristics reduces the lower average assessment values apparent for immigrant-owned dwellings by about one-half.
Owners’ age and family income do not account for the difference in property values among single-detached homes in Vancouver
Table 2 also reports a second set of adjusted estimates, designed to test whether observed differences in average property values reflect differences in the age and family income of property owners.Note In both Toronto and Vancouver, immigrant owners tend to be substantially younger than their Canadian-born counterparts and have lower average family incomes.Note
Adjusting for the age and family income of owners raises the relative value of immigrant owned properties in both cities. The largest estimated impact is for single-detached houses. In Vancouver, the unadjusted difference of $255,100 (the amount by which the average value of immigrant-owned single-detached homes exceeds that of Canadian-born residents) rises to $412,100 when controlling for differences in the age and family income of owners. This suggests that the higher property values among immigrant owned single-detached houses cannot be accounted for by differences in owners’ age and family income between the two groups.Note In Toronto, the slightly lower unadjusted value of immigrant-owned single-detached homes (-$19,500) increases to a positive difference of $41,600 when controlling for owner age and income. This indicates that, conditional on owners’ age and family income, immigrant-owned single-detached houses are more expensive than those owned by their Canadian-born counterparts.
Higher property values for single detached houses in Vancouver owned by recent immigrants
The estimates for immigrant-owned properties reported previously combine housing data for longer-term immigrants with those of more recent arrivals. As a group, longer-term and recent immigrants own 33% of all single-detached houses in Vancouver, and the average assessment value of these properties, as reported earlier, is $255,100 higher than the corresponding average for Canadian-born owners.
Differentiating between longer-term and recent immigrants has a substantial impact on the value of immigrant-owned, single-detached housing in Vancouver.Note Recent immigrants—Canadian residents that immigrated from 2009 to 2016—own 5% of all single-detached houses in that metropolitan area. These properties have an average assessment value of $2.34 million, $823,900 higher than the corresponding average for single-detached properties owned by Canadian-born residents.Note Differences in the size, age and location of these properties together account for about 60% of this unadjusted difference (Chart 5). As before, the difference in property value between immigrant and Canadian-born owners increases when comparing owners of equivalent age and family income.
Data table for Chart 5
| Toronto: single-detached houses owned by recent immigrants | Toronto: all immigrant-owned single detached houses | Vancouver: single-detached houses owned by recent immigrants | Vancouver: all immigrant-owned single detached houses | |
|---|---|---|---|---|
| dollars | ||||
| Difference adjusted for property characteristics | -10,100 | -52,300 | 326,200 | 22,600 |
| Unadjusted difference | 43,300 | -19,500 | 823,900 | 255,100 |
| Source: Statistics Canada, Canadian Housing Statistics Program, 2018. | ||||
There is no comparable shift in the relative value of immigrant-owned housing in Toronto when only properties owned by recent immigrants are examined. The average assessment value of single-detached houses owned by recent immigrants is $43,300 higher than the average among Canadian-born owners, up from a difference of -$19,500 when the properties of recent and longer-term immigrants are combined.Note
More expensive single-detached housing among recent investor immigrants in Vancouver
As noted previously, the average assessment value of single-detached houses in Vancouver that are owned by recent immigrants, at $2.34 million, is $823,900 higher than the corresponding average for Canadian-born owners. The size of this gap varies substantially when recent immigrant owners are differentiated on the basis of immigration category (the type of program used to facilitate entry into Canada) and country of birth.Note Detailed estimates for Vancouver, broken down by immigration category and source country, are reported in Table 3. Estimates for specific immigration categories are reported for each of the top 5 source countries, as measured in terms of the number of single-detached properties in Vancouver owned by recent immigrants.
Recent investor immigrants, as a group, generally own more expensive single-detached properties in Vancouver than their counterparts who came to Canada under other immigration programs.Note For example, recent investor immigrants own single detached houses with average values of either $3.11 million or $3.30 million, depending on the investor program. In contrast, recent immigrants who came under the Provincial Nominee Programs, the Federal and Quebec Skilled Workers programs, and other programs (e.g. family reunification) owned single-detached houses that averaged no more than $2.38 million.Note
A similar pattern is observed among recent Chinese immigrants.Note While the average values of single-detached houses owned by recent investor immigrants from China is either $3.27 million or $3.34 million (depending on the investor program), the average value of single-detached houses owned by recent Chinese immigrants who came to Canada under other immigration programs varies between $1.83 million and $2.84 million.Note
Differences in average assessment values are observed not only across immigration categories but also across countries of origin within a given immigration category. Among recent immigrants who came to Canada under Provincial Nominee Programs, those coming from India owned single-detached properties with an average value of $1.05 million, compared to $2.84 million and $1.73 million for their counterparts coming from China and the United Kingdom, respectively. The corresponding numbers for recent immigrants coming under the Federal and Quebec Skilled Workers programs amount to $0.93 million, $1.83 million, and $1.59 million.
Investor class single-detached properties also more expensive in Toronto
In Toronto, 4.7% of single-detached properties are owned by recent immigrants. As a group, the average value of their properties is slightly higher than those owned by Canadian-born residents.Note
Among recent immigrant owners, differences in the average property value are again apparent when owners are differentiated on the basis of immigration category and country of birth (Table 4).Note On balance, these differences in Toronto are less pronounced than those observed in Vancouver. Investor immigrants own more expensive single-detached houses in Toronto than recent immigrants who came to Canada under other immigration programs. Average property values are again higher among Chinese-born investor immigrants than for those from other countries.
In both Toronto and Vancouver, much of the difference in assessment value between properties owned by Chinese-born investor immigrants and those owned by Canadian-born residents can generally be explained by differences in the size, age and location of these properties. In contrast, differences in the age and family income of owners do not explain the gap.
| Share of single-detached properties | Number of single-detached properties | Average value | Median value | |
|---|---|---|---|---|
| percent | number | 2017 dollars | ||
| Canadian-born owners | 67.29 | 164,101 | 1,512,400 | 1,254,100 |
| Recent immigrant owners | 4.95 | 12,061 | 2,336,200 | 1,659,000 |
| From China | ||||
| Federal investors | 0.75 | 1,822 | 3,270,400 | 2,547,500 |
| Quebec investors | 0.92 | 2,251 | 3,343,900 | 2,801,000 |
| Provincial nominees | 0.65 | 1,588 | 2,835,400 | 2,106,000 |
| Federal and Quebec skilled workers | 0.49 | 1,202 | 1,831,200 | 1,466,500 |
| Other | 0.56 | 1,371 | 1,955,200 | 1,518,000 |
| From India | ||||
| Federal investors | ‡ | ‡ | ‡ | ‡ |
| Quebec investors | ‡ | ‡ | ‡ | ‡ |
| Provincial nominees | 0.07 | 166 | 1,052,400 | 870,800 |
| Federal and Quebec skilled workers | 0.13 | 321 | 932,900 | 871,800 |
| Other | 0.22 | 540 | 910,000 | 855,500 |
| From Iran | ||||
| Federal investors | 0.01 | 30 | 3,086,700 | 2,692,600 |
| Quebec investors | 0.03 | 61 | 2,728,000 | 2,379,200 |
| Provincial nominees | 0.02 | 55 | 2,323,600 | 1,756,100 |
| Federal and Quebec skilled workers | 0.10 | 253 | 1,686,100 | 1,410,000 |
| Other | 0.03 | 78 | 1,645,500 | 1,377,500 |
| From Taiwan | ||||
| Federal investors | 0.06 | 154 | 1,879,400 | 1,538,000 |
| Quebec investors | 0.01 | 17 | 1,711,700 | 1,412,000 |
| Provincial nominees | 0.01 | 21 | 1,902,300 | 1,510,000 |
| Federal and Quebec skilled workers | 0.03 | 83 | 1,535,800 | 1,216,000 |
| Other | 0.03 | 66 | 1,769,600 | 1,522,400 |
| From United Kingdom | ||||
| Federal investors | ‡ | ‡ | ‡ | ‡ |
| Quebec investors | ‡ | ‡ | ‡ | ‡ |
| Provincial nominees | 0.05 | 120 | 1,728,800 | 1,303,850 |
| Federal and Quebec skilled workers | 0.03 | 85 | 1,587,200 | 1,248,000 |
| Other | 0.05 | 126 | 1,466,800 | 1,241,000 |
| From other countries | ||||
| Federal investors | 0.04 | 95 | 2,312,900 | 1,935,800 |
| Quebec investors | 0.01 | 27 | 2,082,700 | 1,537,000 |
| Provincial nominees | 0.17 | 419 | 1,388,100 | 1,162,000 |
| Federal and Quebec skilled workers | 0.23 | 555 | 1,235,100 | 1,027,000 |
| Other | 0.22 | 541 | 1,310,000 | 1,097,000 |
| From all countries | ||||
| Federal investors | 0.87 | 2,110 | 3,114,700 | 2,396,500 |
| Quebec investors | 0.97 | 2,361 | 3,297,600 | 2,757,000 |
| Provincial nominees | 0.97 | 2,369 | 2,378,300 | 1,667,000 |
| Federal and Quebec skilled workers | 1.02 | 2,499 | 1,550,600 | 1,264,000 |
| Other | 1.12 | 2,722 | 1,583,600 | 1,233,100 |
|
‡ number of observations too small to report. Note: Recent immigrant owners arrived in Canada from 2009 onwards. Canadian-born owners are owners who were born in Canada as well as those who immigrated to Canada prior to 1980. The countries shown in this table are the top five countries in terms of the number of recent immigrant owners holding single-detached properties in Vancouver. Source: Statistics Canada, Canadian Housing Statistics Program. |
||||
| Share of single-detached properties | Number of single-detached properties | Average value | Median value | |
|---|---|---|---|---|
| percent | number | 2016 dollars | ||
| Canadian-born owners | 61.15 | 523,756 | 849,300 | 724,000 |
| Recent immigrant owners | 4.71 | 40,297 | 892,600 | 740,000 |
| From China | ||||
| Federal investors | 0.17 | 1,479 | 1,447,300 | 1,163,000 |
| Quebec investors | 0.28 | 2,427 | 1,482,100 | 1,217,000 |
| Provincial nominees | 0.29 | 2,494 | 1,202,400 | 1,000,000 |
| Federal and Quebec skilled workers | 0.38 | 3,235 | 980,400 | 884,000 |
| Other | 0.71 | 6,113 | 932,800 | 831,000 |
| From India | ||||
| Federal investors | 0.00 | 35 | 773,100 | 694,000 |
| Quebec investors | 0.00 | 40 | 1,083,200 | 741,500 |
| Provincial nominees | 0.05 | 402 | 624,500 | 574,000 |
| Federal and Quebec skilled workers | 0.43 | 3,705 | 605,300 | 570,000 |
| Other | 0.37 | 3197 | 612,900 | 579,000 |
| From Iran | ||||
| Federal investors | 0.02 | 148 | 1,400,600 | 1,285,000 |
| Quebec investors | 0.03 | 276 | 1,305,700 | 1,122,000 |
| Provincial nominees | 0.04 | 329 | 1,090,100 | 952,000 |
| Federal and Quebec skilled workers | 0.21 | 1,760 | 897,400 | 812,000 |
| Other | 0.08 | 676 | 935,000 | 836,500 |
| From Pakistan | ||||
| Federal investors | 0.01 | 55 | 1,060,600 | 904,000 |
| Quebec investors | 0.01 | 94 | 856,600 | 763,000 |
| Provincial nominees | 0.00 | 42 | 756,500 | 654,500 |
| Federal and Quebec skilled workers | 0.08 | 713 | 700,300 | 647,000 |
| Other | 0.06 | 523 | 642,400 | 602,000 |
| From Sri Lanka | ||||
| Federal investors | ‡ | ‡ | ‡ | ‡ |
| Quebec investors | ‡ | ‡ | ‡ | ‡ |
| Provincial nominees | 0.00 | 18 | 912,200 | 912,000 |
| Federal and Quebec skilled workers | 0.02 | 173 | 601,500 | 584,000 |
| Other | 0.10 | 884 | 613,500 | 587,000 |
| From other countries | ||||
| Federal investors | 0.04 | 314 | 1,120,600 | 957,500 |
| Quebec investors | 0.03 | 276 | 1,150,000 | 980,000 |
| Provincial nominees | 0.10 | 824 | 853,600 | 695,000 |
| Federal and Quebec skilled workers | 0.53 | 4,540 | 767,100 | 668,000 |
| Other | 0.64 | 5,514 | 754,900 | 639,000 |
| From all countries | ||||
| Federal investors | 0.24 | 2,038 | 1,370,300 | 1,122,000 |
| Quebec investors | 0.36 | 3,117 | 1,412,100 | 1,169,000 |
| Provincial nominees | 0.48 | 4,109 | 1,061,100 | 882,000 |
| Federal and Quebec skilled workers | 1.65 | 14,126 | 784,300 | 691,000 |
| Other | 1.97 | 16,907 | 788,700 | 689,000 |
|
‡ number of observations too small to report. Note: Recent immigrant owners arrived in Canada from 2009 onwards. Canadian-born owners are owners who were born in Canada as well as those who immigrated to Canada prior to 1980. The countries shown in this table are the top five countries in terms of the number of recent immigrant owners holding single-detached properties in Toronto. Source: Statistics Canada, Canadian Housing Statistics Program. |
||||
Conclusion
Following an initial study that documented patterns of non-resident ownership in Toronto and Vancouver (Gellatly and Morissette, 2017), this study highlights new data on the ownership of residential properties in these metropolitan areas by two groups of Canadian residents: immigrant homeowners and Canadian-born homeowners. It reports on the prevalence of immigrant ownership for different types of housing, including single-detached houses, semi-detached houses, row houses and condominium apartments, and compares the property values of Canadian-born and immigrant-owned assets.
The study shows that immigrant owners own proportionately fewer single-detached houses than Canadian-born owners in both cities. In Vancouver, sizable differences in the value of single-detached homes are observed between Canadian-born and immigrant owners. At least 60% of these differences can be accounted for by the fact that immigrant-owned homes are newer, larger and located in more expensive locations than those owned by their Canadian-born counterparts. Observed differences in property value between immigrant and Canadian born owners in Vancouver become substantially more pronounced when only single-detached homes owned by recent immigrants are examined.
Whether comparisons are made between all immigrants and Canadian-born owners or recent immigrants and Canadian-born owners, differences in owners’ age and family income cannot explain the higher value of single-detached homes among immigrant owners. This finding suggests that other owner characteristics not measured in the CHSP underlie these differences in property values. Wealth holdings in Canada or abroad (e.g. financial assets and properties held abroad) and income earned abroad are some of these owner characteristics that are currently not measured in the CHSP data. It may be that part of the differences in property values observed between immigrant and Canadian-born owners reflect differences in wealth holdings between the two groups.
In Toronto, differences in the value of single detached houses owned by immigrants and those owned by Canadian-born residents are much less apparent. This is true both among immigrant-owned properties generally, and among those owned by recent immigrants.
The study does not attribute changes in property prices in Toronto and Vancouver to any specific socio-demographic or economic factor. To disentangle the causal impact of these factors, one needs comprehensive socio-economic information over many years. Currently, CHSP data contains property value information for a single year only (2017 for Vancouver and 2016 for Toronto) and therefore cannot be used to correlate past movements in property prices with past changes in housing demand and in housing supply.
Despite these limitations, the study provides more detailed information than was available in the past on the degree to which immigrants are integrated in different segments of the housing market in both cities. This information provides a richer understanding of the housing market in these cities.
References
Frenette, M. and R. Morissette. 2003. Will they ever converge? Earnings of immigrant and Canadian-born workers over the last two decades. Analytical Studies Branch Paper Series, Catalogue No. 11F0019MIE, No. 215. Ottawa: Statistics Canada.
Gellatly, G. and R. Morissette. 2017. Non-resident Ownership of Residential Properties in Toronto and Vancouver: Initial Information from the Canadian Housing Statistics Program. Economic Insights, Catalogue No. 11-626-X, No. 78. Ottawa: Statistics Canada.
Green, D., Y. Ostrovsky and G. Picot. 2016. Immigration, Business Ownership and Employment in Canada. Analytical Studies Branch Paper Series Catalogue No. 11F0019MIE, No. 375. Ottawa: Statistics Canada.
Haan, M. 2012. The Housing Experiences of New Canadians: Insights from the Longitudinal Survey of Immigrants to Canada. Ref. No.: RR20120301. Ottawa: Citizenship and Immigration Canada.
Hou, F. and G. Picot. 2003. “The Rise in Low-income Rates Among Immigrants in Canada.” Analytical Studies Branch Research Paper Series, No. 198. Statistics Canada Catalogue No. 11F0019M. Ottawa: Statistics Canada.
Hou, F. and G. Picot. 2011. “Seeking Success in Canada and the United States: The Determinants of Labour Market Outcomes Among the Children of Immigrants” Analytical Studies Branch Research Paper Series, No. 331. Statistics Canada Catalogue No. 11F0019M. Ottawa: Statistics Canada.
Hou, F. T. Abada and Y. Lu. 2012. “Bosses of Their Own: Are Children of Immigrants More Likely than Their Parents to Be Self-Employed?” Analytical Studies Branch Research Paper Series, No. 341. Statistics Canada Catalogue No. 11F0019M. Ottawa: Statistics Canada.
Hou, F. and G. Picot. 2014. “Immigration, Low Income and Income Inequality in Canada: What’s New in the 2000s?” Analytical Studies Branch Research Paper Series, No. 364. Statistics Canada Catalogue No. 11F0019M. Ottawa: Statistics Canada.
Hou, F. and A. Bonikowska. 2016. “Educational and Labour Market Outcomes of Childhood Immigrants by Admission Class?” Analytical Studies Branch Research Paper Series, No. 377. Statistics Canada Catalogue No. 11F0019M. Ottawa: Statistics Canada.
Leung, D., Y.Ostrovsky, and G. Picot. 2018. The Financing of Immigrant-owned Firms in Canada. Analytical Studies Branch Paper Series, Catalogue No. 11F0019MIE, No. 404. Ottawa: Statistics Canada.
Morissette, R. 2019. The Wealth of Immigrant Families in Canada, 1999 to 2016. Analytical Studies Branch Paper Series, Catalogue No. 11F0019MIE, forthcoming. Ottawa: Statistics Canada.
Ostrovsky, Y. and G. Picot. 2018. The Exit and Survival Patterns of Immigrant Entrepreneurs: The Case of Private Incorporated Companies. Analytical Studies Branch Paper Series, Catalogue No. 11F0019MIE, No. 401. Ottawa: Statistics Canada.
Picot, G., F. Hou and S. Coulombe. 2007. “Chronic Low Income and Low-income Dynamics Among Recent Immigrants.” Analytical Studies Branch Research Paper Series, No. 294. Statistics Canada Catalogue No. 11F0019M. Ottawa: Statistics Canada.
Picot, G., Y. Lu and F. Hou. 2009. “Immigrant Low Income Rates: The Role of Market Income and Government Transfers.” Perspectives on Labour and Income, Vol. 10, No. 12: 13 to 27. Catalogue No. 75-001-X. Statistics Canada.
Picot, G. and A. Sweetman. 2005. The Deteriorating Economic Welfare of Immigrants and Possible Causes: Update 2005. Analytical Studies Branch Paper Series, Catalogue No. 11F0019MIE No. 262. Ottawa: Statistics Canada.
Picot, G., and Y. Lu. 2017. “Chronic Low Income Among Immigrants in Canada and its Communities.” Analytical Studies Branch Research Paper Series, No. 397. Statistics Canada Catalogue No. 11F0019M. Ottawa: Statistics Canada.
Data and sample selection
The estimates reported in this article are based on a property-level database developed by the CHSP to support the December 11, 2018 release of residential property estimates for Ontario, British Columbia and Nova Scotia. The database contains detailed information on residential properties in the metropolitan areas of Vancouver and Toronto (the geographic focus on this article), including the age, size, and location of all properties,Note along with their assessed market values. The database also includes information on property titleholders, including their age, family income and immigration status.
To enhance the interpretability of the data, several restrictions were imposed on the set of properties selected for analysis. First, the sample was limited to properties owned by Canadian residents; non-resident owned properties were excluded from the analysis.Note Second, the sample was restricted to single-structure, standard dwelling types, which include single-detached houses, semi-detached houses, row houses and condominium apartments. Multi-dwelling residential properties, or residential properties that include land but no accompanying structure, were excluded. Lastly, the analysis was limited only to properties that are owned by individuals; residential dwellings owned in whole or in part by business or government entities, or that have a commercial as well as a residential use, were also excluded. These restrictions resulted in samples of 545,034 residential dwellings in Vancouver and 1,524,237 dwellings in Toronto.
All properties were classified as either owned by an immigrant or owned by a Canadian-born resident. Ownership status was assigned as follows. Individual property owners were identified as either immigrant or Canadian-born, based on whether they landed in Canada (for immigration purposes) at any point between 1980 and 2016 (the maximum period for which immigration status can be determined from the database). Immigrant owners therefore include both longer-term Canadian residents and residents who landed in Canada more recently.Note For residential properties with a single owner, the assignment of ownership status as either immigrant or Canadian-born was straightforward. This is similarly the case for properties with multiple title holders, where all owners are immigrants, or alternatively, all are Canadian born. Assigning ownership status was less straightforward among properties with a mixture of immigrant and Canadian-born titleholders. In these cases, ownership status was determined on the basis of the relative incomes of property owners: a property was classified as immigrant-owned if the title holder with highest income was an immigrant.Note
- Date modified: