
 StatCan COVID-19: Data to Insights for a Better Canada Inequalities in COVID-19 mortality rates by neighbourhood types in Canada

Archived Content
Information identified as archived is provided for reference, research or recordkeeping purposes. It is not subject to the Government of Canada Web Standards and has not been altered or updated since it was archived. Please "contact us" to request a format other than those available.
by Rajendra Subedi and Nicole Aitken
Text begins
The COVID-19 pandemic has added a disproportionate health burden across populations and neighbourhoods in Canada (Edward, 2021; PHAC, 2020). Some studies have shown higher COVID-19 mortality rates among low socioeconomic status (SES) populations (Hawkins, Charles, & Mehaffey, 2020; Miller, Wherry, & Mazumder, 2021). Other studies have shown a disproportionate impact of the COVID-19 among ethnic minorities and immigrants (Clark, Fredricks, Woc-Colburn, Bottazzi, & Weatherhead, 2020; Edward, 2021; Wadhera, Wadhera, & Gaba, 2020; Yanez, Weiss, Romand, & Treggiari, 2020). In Canada, inequalities in COVID-19 mortality rates were also observed by housing characteristics, neighbourhood level ethnocultural composition and household income (Blair, et al., 2022; Subedi, Greenberg, & Turcotte, 2020). However, there is a very limited understanding of the combined effect of neighbourhood-level socioeconomic, demographic and ethnocultural characteristics in determining COVID-19 mortality risks.
Neighbourhood-based indicators are useful to understand health inequalities in areas where individual-level data are insufficient or may not be easily available (Statistics Canada, 2019). The Canadian Vital Statistics – Death database (CVSD) does not include socioeconomic and ethnocultural variables but they can be added by utilizing a newly developed geographic classification tool called the “Canadian Social Environment Typology (CanSET). Using a standard geography (dissemination area), the CanSET data is attached to the CVSD allowing for neighbourhood level inequalities in COVID-19 mortality rates to be examined.
The CanSET classification tool classifies dissemination areas (DA) of Census metropolitan and Census agglomeration area across Canada into neighbourhood types based on their similarities and differences across 30 socioeconomic, demographic and ethnocultural variables from the 2016 Census of population. The CanSET tool was used to understand inequalities in COVID-19 mortality rates in 2020 by six neighbourhood types in Canada namely: 1) High SES suburban neighbourhoods 2) Low SES suburban neighbourhoods 3) Senior or institutionalized population neighbourhoods 4) High SES urban neighbourhoods 5) Multicultural dense urban neighbourhoods and 6) Large city South/East Asian concentrated neighbourhoods. Neighbourhood type definitions can be found in the data source section. More information on the CanSET is available online (https://www150.statcan.gc.ca/n1/pub/17-20-0002/172000022022001-eng.htm).
Age-standardized COVID-19 mortality rates in 2020 were higher in the neighbourhoods characterized by high proportions of seniors, institutionalized populations, immigrants and low-income families
Some neighbourhood types had noticeably higher age-standardized COVID-19 mortality rates in Canada in 2020 (Chart 1). The COVID-19 mortality rate was highest for neighbourhoods characterized by low income households having higher proportion of elderly population living in an institutional collective dwelling such as a senior home, a hospital or a long-term care home (i.e., senior or institutionalized population neighbourhoods). These neighborhoods collectively reported 148.4 deaths per 100,000 population in Canada, which is almost six times higher than the neighbourhood type reporting the lowest mortality rates (i.e., low SES suburban neighbourhoods). This could be a result of rapid spread of COVID-19 in 2020 among neighbourhoods with more vulnerable elderly population living in institutional collective dwellings. This result is consistent with a previous analysis that reported significantly higher COVID-19 deaths among long-term care residents in Canada (CIHI, 2020) .
The densely populated urban neighbourhoods characterised by very high proportion of immigrants, lone parent families and low-income families (i.e., multicultural dense urban neighbourhoods) also had a significantly higher COVID-19 mortality rate (66.7/100,000 population) compared with the remaining neighbourhood types. It was 2.6 times higher than the neighbourhood type reporting the lowest mortality rates (i.e., low SES suburban neighbourhoods).
The higher COVID-19 mortality rates found in the densely populated multicultural urban neighbourhood could be a result of higher infection and transmission of COVID-19 among low SES population living in more densely populated multi-unit dwellings neighbourhoods surrounded by relatively less open space and greenery (Spotswood, et al., 2021). The increased risk of COVID-19 mortality is likely due to a combination of factors including public contact, geography, income levels, public health restriction compliance, higher frequency low income households working in occupation requiring more contact with the public, and many others.

Data table for Chart 1
| Neighbourhood Type | Age-standardized mortality rate per 100,000 population |
|---|---|
| High SES suburban neighbourhoods | 30.2 |
| Low SES suburban neighbourhoods | 25.9 |
| Senior or institutionalized population neighbourhoods | 148.4 |
| High SES urban neighbourhoods | 33.9 |
| Multicultural dense urban neighbourhoods | 66.7 |
| Large city South/East Asian concentrated neighbourhoods | 40.8 |
| Source: Vital Statistics—Death Database 2020, the Canadian Social Environment Typology and the Census of population 2016. | |
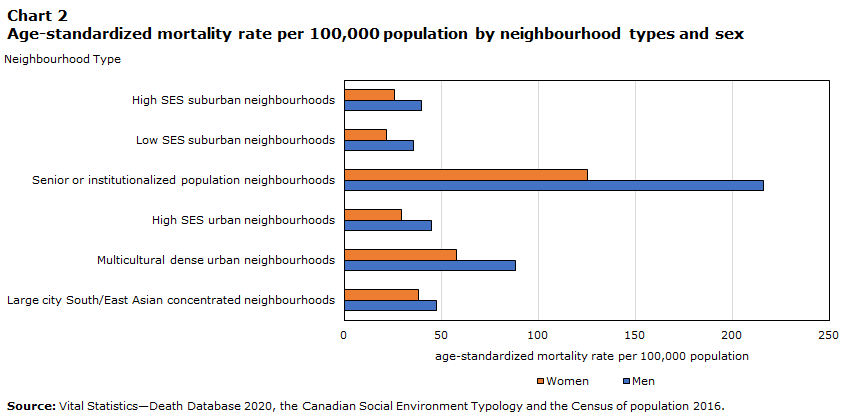
Men had higher COVID-19 mortality rates in 2020 compared with women in all neighbourhood types
Men had higher age-standardized COVID-19 mortality rates compared with women irrespective of the type of neighbourhood in Canada (Chart 2), which is consistent with other studies that found higher COVID-19 mortality rates among men compared with women (O'Brien, Du, & Peng, 2020; Yanez, Weiss, Romand, & Treggiari, 2020). The largest difference in mortality between men and women was found in the senior or institutionalized population neighbourhoods where the age-standardized COVID-19 mortality rate for men was 1.7 times higher than that of women. The higher COVID-19 mortality rates among men, in general, could be due to biological factors (e.g., immune responses) and behavioural risk factors (e.g., smoking, drinking and other lifestyle habits) that create a greater risk for COVID-19 related complications and death among men (Bwire, 2020; Capuana, Rossi, & Paolisso, 2020).
Data table for Chart 2
| Neighbourhood Type | Women | Men |
|---|---|---|
| age-standardized mortality rate per 100,000 population | ||
| High SES suburban neighbourhoods | 26.0 | 39.6 |
| Low SES suburban neighbourhoods | 21.8 | 35.8 |
| Senior or institutionalized population neighbourhoods | 125.0 | 216.1 |
| High SES urban neighbourhoods | 29.4 | 45.1 |
| Multicultural dense urban neighbourhoods | 58.0 | 88.3 |
| Large city South/East Asian concentrated neighbourhoods | 37.9 | 47.3 |
| Source: Vital Statistics—Death Database 2020, the Canadian Social Environment Typology and the Census of population 2016. | ||
COVID-19 mortality rates for the Montreal census metropolitan area were higher than the national rates for all neighbourhood types in 2020
Toronto and Montreal, the two largest cities in Canada, had a higher number of COVID-19 infections and deaths in 2020 compared with other cities. The age-standardized COVID-19 mortality rate for the Montreal census metropolitan area was 2.3 times higher than the rate for Toronto, and 2.7 times higher than the national rate. The age-standardized COVID-19 mortality rate for Toronto was 1.2 times higher than the national rate. Generally, the pattern of COVID-19 mortality rates between Montreal and Toronto neighbourhood types were similar. The highest rate in the Montreal census metropolitan area was found in the senior or institutionalized population neighbourhoods (475.3 per 100,000 population) followed by the multicultural dense urban neighbourhoods (105.5 per 100,000 population (Map 1). Although, the mortality rates for Toronto census metropolitan area were lower than that of Montreal (Map 2), the senior or institutionalized population neighbourhoods had the highest mortality rate in both cities. On the other hand, the lowest COVID-19 mortality rate was found in the high SES suburban neighbourhoods (68.5 per 100,000 population) in Montreal in contrast to the low SES suburban neighbourhood (34.0 per 100,000 population) in Toronto. The high SES suburban neighbourhoods had higher COVID-19 mortality rates than the low SES suburban neighbourhoods in Canada and also in Toronto but not in Montreal. This could be a result of relative location of the neighbourhoods from the core urban centre most affected by the pandemic. The low SES suburban neighbourhoods are further away from the core urban centre in Toronto (Map 1) where as they are equally distributed in Montreal (Map 2). In Montreal, there was less distinction between the neighbourhood types outside of the senior and institutionalized population neighbourhoods and the multicultural dense urban neighbourhoods. There were no significant differences in COVID-19 mortality rates between any of the remaining neighbourhood types.
In addition to the location of the neighbourhoods, the significant difference between the Toronto suburban neighbourhoods could also be a result of lower population density and smaller household size found in the low SES suburban neighbourhoods compared with high SES suburban neighbourhoods. Studies have shown positive correlations of population density and household size with COVID-19 infection and mortality rates (Ke & Zhenghao, 2020; Martins-Filho, 2021; Yang & Aitken, 2021).
In general, the urban neighbourhoods had higher COVID-19 mortality rates than the suburban neighbourhoods in both Montreal and Toronto. This could be a result of quicker transmission of COVID-19 in densely populated urban neighbourhoods. Yet, the neighbourhoods with higher proportion of senior and institutionalized population had higher COVID-19 mortality rates despite their urban or suburban locations. This finding reflects the vulnerability of senior and institutionalized population to COVID-19 pandemic. Although the age-standardized mortality rate for high SES urban neighbourhoods was slightly higher than suburban neighbourhoods, it was significantly lower than other types of urban neighbourhoods. It indicates that the socioeconomic status played an important role, along with other factors like population density and household size, in determining COVID-19 mortality rates in urban neighbourhoods in Canada. Furthermore, the economic response and working arrangements during the pandemic along with the lockdown measures imposed differently by Quebec and Ontario governments may have contributed differently to the COVID-19 mortality rates in Montreal and Toronto.
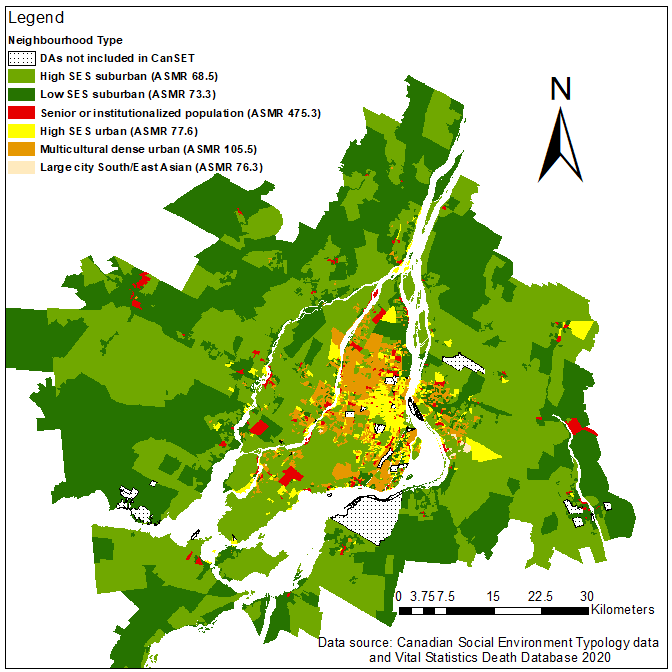
Description for Map 1
The title of the map is “COVID-19 Age-standardized Mortality Rate by neighbourhood type for the Montreal Census Metropolitan Area”.
Map 1 shows age-standardized COVID-19 mortality rates per 100,000 population by six different types of neighbourhoods in Montreal census metropolitan area in 2020. The dark red to light green graduated colours in the map represent neighbourhoods with the highest to the lowest mortality rate respectively. The dark red colour on the map represents the Senior or Institutionalized Population Neighbourhoods, which had the highest COVID-19 mortality rates of 475.3 per 100,000 population. This neighbourhood type comprises 170 dissemination areas. The orange colour on the map represents Multicultural Dense Urban Neighbourhoods with an age-standardized mortality rates of 105.5 per 100,000 population. This neighbourhood type comprises 1518 dissemination areas. The bright yellow colour on the map represents High SES Urban neighbourhoods with an age-standardized mortality rate of 77.6 per 100,000 population. This neighbourhood type comprises 995 dissemination areas. Similarly, the light-yellow colour on the map represents the Large City South and East Asian Concentrated Neighbourhoods with an age-standardized mortality rate of 76.3 per 100,000 population. This neighbourhood type comprises 20 dissemination areas. The dark green colour on the map represents Low SES Suburban Neighbourhoods with an age-standardized mortality rate of 73.3 per 100,000 population. This neighbourhood type comprises 1204 dissemination areas. Finally, the light green colour in the map represents the High SES Suburban Neighbourhoods which has the lowest age-standardized mortality rate of 68.5 per 100,000 population. This neighbourhood type comprises 2519 dissemination areas. Generally, the pattern in the map shows higher COVID-19 mortality rates in neighbourhoods towards the center of the city. The data source for the map are the Canadian Social Environment Typology data and the Vital Statistics Death - Database 2020 (3233).
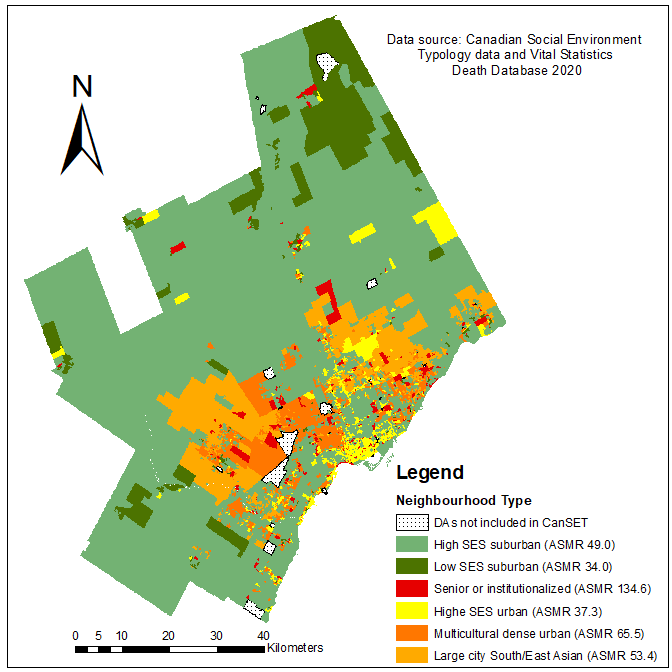
Description for Map 2
The title of the map is “COVID-19 Age-standardized Mortality Rate by neighbourhood types for the Toronto Census Metropolitan Area”.
The dark red to dark green graduated colours in the map represent neighbourhoods with the highest to the lowest mortality raterespectively. The dark red to dark green graduated colours in the map represent neighbourhoods with the highest to the lowest mortality rate respectively. The dark red colour on the map represents the Senior or Institutionalized Population Neighbourhoods, which had the highest COVID-19 mortality rates of 134.6 per 100,000 population. This neighbourhood type comprises 172 dissemination areas. The orange colour on the map represents Multicultural Dense Urban Neighbourhoods with an age-standardized mortality rates of 65.5 per 100,000 population. This neighbourhood type comprises 1307 dissemination areas. Similarly, the light-yellow colour on the map represents the Large City South and East Asian Concentrated Neighbourhoods with an age-standardized mortality rate of 53.4 per 100,000 population. This neighbourhood type comprises 1404 dissemination areas. The bright yellow colour on the map represents High SES Urban neighbourhoods with an age-standardized mortality rate of 37.3 per 100,000 population. This neighbourhood type comprises 1065 dissemination areas. The light green colour on the map represents High SES Suburban Neighbourhoods with an age-standardized mortality rate of 49.0 per 100,000 population. This neighbourhood type comprises 3333 dissemination areas. Finally, the dark green colour in the map represents the Low SES Suburban Neighbourhoods which has the lowest age-standardized mortality rate of 34.0 per 100,000 population. This neighbourhood type comprises 202 dissemination areas. Generally, the pattern in the map shows higher COVID-19 mortality rates in neighbourhoods towards the center of the city. The data source for the map are the Canadian Social Environment Typology data and the Vital Statistics Death - Database 2020 (3233).
The COVID-19 pandemic has added a disproportionate health burden among certain population subgroups in Canada. The neighbourhoods with a higher proportion of senior and institutionalized population, low income population and immigrant population were inequitably affected by COVID-19. These findings can help inform public health efforts to further protect population groups which are more vulnerable to specific health risks in Canada. Statistics Canada will continue to provide COVID-19 mortality rates for specific subgroups of the population as more data becomes available to shed more insight on the evolution of the pandemic.
Data Source
Data used for this analysis included the de-identified final COVID-19 deaths from Vital Statistics - Death Database occurring between January 1st and December 31st, 2020, the Canadian Social Environment Typology (CanSET) data and the Census of population 2016 calculated at Census dissemination area (DA) level. In this study, a neighbourhood corresponds to a DA.
There are different ways to measure mortality due to the COVID-19 pandemic. This analysis uses death certificates where COVID-19 is listed as the underlying cause of death. Statistics Canada and provincial and territorial vital statistics agencies use two codes to identify COVID-19 reported as a cause of death: U071 for COVID-19 specified as confirmed by a positive test result and U072 for COVID-19 described as “possible,” “probable,” or “pending a (positive) test result”. The COVID-19 data in this study are preliminary, as they are not based on all deaths that occurred during the reference period because of reporting delays and because they do not include Yukon.
Age-standardized mortality rates per 100,000 population was calculated for each neighbourhood type using the aggregated population from the Census of Population 2016. The direct standardization method was used to age-standardize all rates to the 2011 Census of Population with five-year age groupings. The confidence interval illustrates the degree of variability associated with a rate. Wide confidence intervals indicate high variability; thus, these rates should be interpreted with due caution. When comparing estimates, it is important to use confidence intervals to determine if differences between values are statistically significant.
A DA is a small, relatively stable geographic unit composed of one or more adjacent dissemination blocks with an average population of 400 to 700 persons. It is the smallest standard geographic area for which all census data are disseminated.
The neighbourhood types used in this analysis are defined as the set of DAs that are similar in terms of the selected characteristics (variables). This data set includes only 43,144 DAs from the Census Metropolitan Area (CMA) and the Census Agglomeration (CA) of Canada. The DAs for which either short form or long form data were not released for confidentiality or data quality issues by the Census were removed from this analysis. The DAs from Indian reserves were also excluded from the analysis. The major characteristics of each type of neighbourhood used in the analysis are outlined below:
High SES suburban neighbourhoods: Neighbourhoods in this cluster have medium population density but higher than average number of people per household; lower than average proportion of single parent families; high proportion of households with a university degree at bachelor’s level or above; low unemployment rate and higher than average household income; higher than average proportion of people in managerial or professional occupations; high dwelling ownership rate and low proportion of households in need of major repair.
Low SES suburban neighbourhoods: Neighbourhoods in this cluster have relatively low population density; lower than average number of people per household but higher than average proportion of single parent families; very low proportion of households with a university degree at bachelor’s level or above; very low proportion of recent immigrant population but higher than average proportion of Aboriginal population; relatively high proportion of labour force in manufacturing, and sales and service occupation; relatively low median dwelling value and low adjusted family income.
Senior or institutionalized population neighbourhoods: Neighbourhoods in this cluster have very small household size; very low proportion of population under the age of 14 years but very high proportion of elderly population aged 65 years and above; very high proportion of institutionalized population; very high proportion of low-income households; very high proportion of government transfer of payment recipients; low dwelling ownership rate; and very low adjusted family income.
High SES urban neighbourhoods: Neighbourhoods in this cluster have very high population density and very low proportion of children 14 years of age and under; very small household size; very low proportion of labour force in manufacturing occupations but high proportion of population in professional occupations; higher than average proportion of households with a university degree; very low dwelling ownership rate and very high proportion of population spending more than 30% of income on housing costs; and higher than average dwelling value. Most of these DAs are located in the provinces of Quebec, Ontario, Alberta and British Columbia.
Multicultural dense urban neighbourhoods: Neighbourhoods in this cluster have very high population density; relatively high proportion of population 14 years of age and under; very high proportion of lone parent families and very high proportion of government transfer of payment recipients; high unemployment rate; very high proportion of immigrants and recent immigrant population; high proportion of labour force working in sales and service related occupations; very low dwelling ownership rate; and very low adjusted family income. DAs in this cluster are mostly from the provinces of Quebec, Ontario and Alberta.
Large city South/East Asian concentrated neighbourhoods: Neighbourhoods in this cluster have high population density; very large household size; very high proportion of immigrant population and very high proportion of visible minorities of South and East Asian origin; very high proportion of the population not speaking either of the official languages of Canada; and very high dwelling value. DAs in this cluster are mostly from the Montreal, Toronto, Calgary and Vancouver CMAs.
Further caution should be used when interpreting the results because demographic and socioeconomic information used to generate the typology were from the Census of population 2016 whereas the COVID-19 death data are from 2020. Please refer to the census dictionary 2016 (https://www12.statcan.gc.ca/census-recensement/2016/ref/dict/index-eng.cfm) for detailed definitions of Census of Population concepts, variables, and geographic terms, as well as historical information.
More information on the Canadian Social Environment Typology (CanSET) data is available at the website or upon request.
References
Blair, A., Pan, S., Subedi, R., Yang, F.-J., Aitken, N., & Steensma, C. (2022). Social inequalities in COVID-19 mortality by area and individual-level characteristics in Canada, January to July/August 2020: Results from two national data integrations. Canada Communicable Disease Report, 48(1).
Bwire, G. M. (2020). Coronavirus: Why men are more vulnerable to Covid-19 than women. SN Comprehensive Clinical Medicine, 2, 874-876. doi:https://doi.org/10.1007/s42399-020-00341-w
Capuana, A., Rossi, F., & Paolisso, G. (2020, July 17). Covid-19 Kills More Men Than Women: An Overview of Possible Reasons. Frontiers in Cartiovascular Medicine, 7, 1-7. doi:https://doi.org/10.3389/fcvm.2020.00131
CIHI. (2020). Pandemic experience in the Long-Term Care sector: How does Canada compare with other countries? Ottawa: Canadian Institute for Health Informaiton.
Clark, E., Fredricks, K., Woc-Colburn, L., Bottazzi, M. E., & Weatherhead, J. (2020). Disporportionate impact of the COVID-19 pandemic on immigrant communities in the United States. PLoS Neglected Tropical Diseases, 14(7). doi:10.1371/journal.pntd.0008484
Clark, J. (2021, June). Impacts of the COVID-19 pandemic in nursing and residential care facilities in Canada. StatCan COVID-19: Data Insights for a Better Canada.
Edward, N. (2021). COVID-19 deaths among immigrants: Evidence from the early months of the pandemic. StatCan COVID-19: Data to Insights for a Better Canada.
Hawkins, R. B., Charles, E. J., & Mehaffey, J. H. (2020). Socio-economic status and COVID-19–related cases and fatalities. Public Health, 189, 129-134. doi:10.1016/j.puhe.2020.09.016
Ke, C., & Zhenghao, L. (2020, December). The spread rate of SARS-VoV-2 is strnogly associated with population density. Journal of Travel Medicine, 27(8). doi:https://doi.org/10.1093/jtm/taaa186
Martins-Filho, P. R. (2021). Relationship between population density and COVID-19 incidence and mortality estimates: A country-level analysis. Journal of Infection and Public Health, 14(8), 1087-1088. doi:https://doi.org/10.1016/j.jiph.2021.06.018
Miller, S., Wherry, L. R., & Mazumder, B. (2021). Estimated mortality increases during the COVID-19 pandemic by socioeconomic status, race, and ethnicity. Health Affairs, 40. doi:https://doi.org/10.1377/hlthaff.2021.00414
O'Brien, J., Du, K. Y., & Peng, C. (2020). Incidence, clinical features, and outcomes of COVID-19 in Canada: Impact of sex and age. Journal of Ovarian Research, 13(137).
PHAC. (2018). Key health inequalities in Canada: A national protrait. Ottawa: Public Health Agency of Canada and the Pan-Canadain Public Helath Network.
PHAC. (2020). Social inequalities in COVID-19 mortality by area- and individual-level characteristics in Canada, January to July/August 2020. Public Health Agency of Canada.
Spotswood, E. N., Benjamin, M., Stoneburner, L., Wheeler, M. M., Beller , E. E., Balk, D., & McDonald , R. I. (2021). Nature inequity and higher COVID-19 case rates in less-green neighbourhoods in the United States. Nature sustainability, 4(12), 1092-1098.
Statistics Canada. (2019, June 12). The Canadian Index of Multiple Deprivation: User Guide.
Subedi, R., Greenberg, L., & Turcotte, M. (2020). COVID-19 mortality rates in Canada's ethnocultural neighbourhoods. Statcan COVID-19: Data to Insights for a Better Canada, 1-8.
Wadhera, R. K., Wadhera, P., & Gaba, P. (2020, April 29). Variation in COVID-19 hospitalizations and deaths across New York City Borough. JAMA, 323(21), 1-4.
Yanez, D. N., Weiss, N. S., Romand, J.-A., & Treggiari, M. M. (2020). COVID-19 mortality risk for older men and women. BMC Public Health, 20(1742).
Yang, F.-J., & Aitken, N. (2021). People living in apartments and larger households were at higher risk of dying from COVID-19 during the first wave of the pandemic. Data to Insights for Better Canada.
- Date modified: